217
Copyright © 2018. IJEMR. All Rights Reserved.
Volume-8, Issue-1, February 2018
International Journal of Engineering and Management Research
Page Number: 217-222
Algorithm Decision Support in Determining Bidikmisi Scholarship
Receive
(Case Study: Bidikmisi Scholarship)
H. E. Harahap1, F. Bukhari2 and B. P. Silalahi3
1Student, Department of Mathematics, Bogor Agricultural University, INDONESIA 2,3Lecturer, Department of Mathematics, Bogor Agricultural University, INDONESIA
1
Corresponding Author: [email protected]
ABSTRACT
The purpose of this research is to find a better method for decision making of Bidikmisi scholarship by comparing FCM and AHP methods. The result show that AHP better then FCM method, where the suitable of decision making AHP method is 590 from 804 scholarship recipients or about 73%. Scholarship recipients using AHP method are 623 pass students and 181 not pass students. While the suitable of decision making FCM method with the results of the decision Bidikmisi scholarship recipients 489 from 804 students or about 60.69%. The scholarship recipients using FCM method are 623 most recommended students, 177 recommended students and 4 students not recommended.
Keywords-- Analytic hierarchy process, Bidikmisi, Decision support system, Fuzzy c-means, Scholarship
I.
INTRODUCTION
Education is important for community to create quality human resources (HR), it can be useful for the nation progress to face the phenomenon in this current globalization era. Currently, there are still many people who have not received qualified education because of high costs of educational and difficult to be reached middle-lower economic community. This causes the government make efforts to give qualified education for middle low economic community by providing a scholarship program.
Scholarship is an award of financial aid for student to future school, scholarship provided by governments, private companies, embassies, universities, and educational institutions or researchers [3]. One of scholarships programmed by government is Bidikmisi scholarship.
Government thought the Directorate General of Higer Educational began in 2010 launched the Bidikmisi scholarship for students to study in 104 state universities
[1]. Bogor Agricultural University become one of state universities that received Bidikmisi scholarship assistance. Bidikmisi scholarship recipients from 2010 to 2012 recipients are 2500 students consisting and from 2013 to 2016 are 3144 students Bidikmisi scholarship recipients.
The large number of Bidikmisi scholarship recipients affects difficulties in scholarship selecting because many factors must be considered. Therefore, efforts that can be done to handle the problem is that need a decision support system. Decision support system (DSS) is an information system that supports decision about problems that may be rapidly changing and not easily specfied in advance [5]. In this research is making algorithm in decision support to help scholarship selecting easily and doing compare of fuzzy c-means (FCM) and analytic hierarchy process (AHP) method. The similar research about decision support system is application of analytic hierarchy process (AHP) method to support decision making in selection of choristers [4].
II.
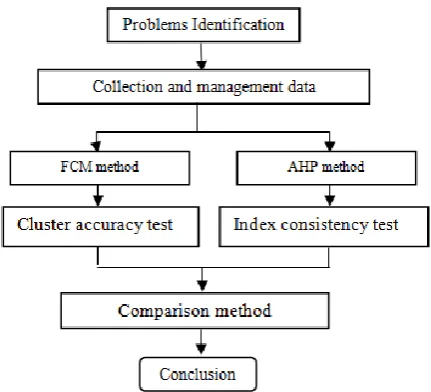
METHODOLOGY
218
Copyright © 2018. IJEMR. All Rights Reserved.
Figure 2 Research method procedure
III.
RESEARCH METHODE
In 1981, Fuzzy c-means was introduced by Jim Bezdek which is a data clustering technique in which the presence of each data point in a cluster is determined by the degree of membership. Then L. Saaty (1977, 1980) developed a decision support system with issues of determining the best alternative in which an existing problem is prepared or described by creating a hierarchy. Fuzzy c-means
Fuzzy c-means (FCM) is one of algorithms used for clustering data. Clustering of FCM point in a cluster is determined by its membership level based on the normal form of Euclidian. The degree of membership ( ) can be calculated as follows:
*∑ ( ) +
∑ *∑ ( ) +
(1)
where
: membership degree ( ) center cluster
( )
: students data ( )criteria (
)
: center cluster ( ) criteria (
) w : weight
: number of cluster
The concept of fuzzy c-means is to determine the cluster center that will mark the average location of each cluster.Center cluster can be calculated using the
following equation:
∑ (( ) ) ∑ ( )
(2)
with and .
In initial conditions, the center of cluster is still not accurate where each data point has a membership degree for each cluster. Therefore it is repeated to improve the cluster center and degree of membership of each data point so it can be seen that the center cluster
will move towards an appropriate location. This loop is based on minimization of objective function that describes the distance between the data points to center cluster. he objective function of iteration ( ) as follow as:
∑ ∑ (*∑ ( ) + ( ) ) (3)
With boundary [ ] ∑ .
Fuzzy c-means algorithm in Bidikmisi scholarship recipients case in this research as follows [2]:
Step 1: Input data student candidate of Bidikmisi scholarship recipient who will be in cluster
, with : amount of data to be in cluster and number of variables / attributes (criteria).
: sample data i ( ), attribute j
( ).
Step 2: Determine number of clusters c desired, in this case the number of clusters Bidikmisi scholarship determined as many as 3 that were pass, recommended, and not pass.
Step 3: Determine smallest expected error ( ) is for termination of iteration, this value is a positive value if smaller expected error then value of data was accurate.
Step 4: Determine maximum iteration ( ). Step 5: Generate random numbers as
elements of initial partition matrix membership degree to indicates how likely a data can be a member into a cluster.
Step 6: Calculate cluster center k ( ), using equation
(2).
Step 7: Calculate objective value t, ( )as recurrence requirement to obtain correct cluster center using equation (3).
Step 8: Calculate the change of degree of membership of
on each cluster by using equation (1)
Step 9: Check termination conditian :
a. if ( – ) or ( ) overwise go stop step
b. if not, do for t= t +1 repeat step ke-6. The optimum cluster accuracy on fuzzy c-means can be measured using one of the validation methods that is modified partiton coefficient which will be explained on the method of testing modified partititon coefficient.
The number of cluster that taking, using modified partition coefficient (MPC) method for validating. MPC is depvelopment of methos partition coefficient (PC) which used measure clustering that overlap. Value of PC is at partition ( ) .
( ) ∑ ∑ ( )
Modiwith PC (c) is the PC index of the c-cluster, n is the number of student data, c is the number of clusters.
Modification of the PC index can reduce the monotonous changes to the diversity of c values in which MPC values are at 0≤ MPC (c) ≤1. In general the most optimal number of ( ( )) clusters is
determined from the largest MPC value. Here is the MPC method algorithm:
219
Copyright © 2018. IJEMR. All Rights Reserved.
Analytic Hierarchy Process methodIn general, analytic hierarchy process (AHP) method completion is following [4]:
Step 1: Define the problem of describing the problem by preparing a hierarchy for decision making. The preparation of the hierarchy can be seen in Figure 3.
Figure 3 Hierachy on the Bidikmisi scholarship case
Step 2.: Comparison in pairs, give assessing each criterion by determine relationship between the criteria with each other. Comparison of criteria in pairs is transformed into matrix form shown in Table 3.
Table 3 Comparison of criteria matrix
Criteria
Value is element comparisson value
(row) of (kolom) which states how big relationship importance level (colom) of criteriacomparison (kolom). The numerical value given for whole comparison is obtained from Table 4.
Step 3: Finding the weighted value of each criterion with priority weight criteria = number of columns / number of criteria.
Step 4: Consistency, calculation of consistency on AHP model is important because AHP model use human perception as input. This allows the occurrence of inconsistencies in input value of criteria comparison scale. The consistency index calculation as follows:
( ) ( ).
Where:
: the number of criteria consider : consistensy index
: result from sum of rows with priority
weight
Consistency ratio obtained by dividing index consistency with random index. The random index represents average consistency of a comparison matrix of size 1 to 10.
where yaitu consistency index, adalah random concintency index. The random index of number n used can be seen in Table 5.
Tabel 5 Random index (RI)
Table 4 Scale of comparison criteria Intensity Description Linguistic
1 Equal Two elements equally important
3 Moderate Two elementsThe assessment of one element is slightly more supportive than other elements
5 Strong The assessment of one element is more important compared to other elements
7 Demonstrated One element is more strongly than other elements 9 Extreme One element has absolutly of other elements
2, 4, 6,8 Intermediate value This value is given if two elements have an equally important proximity
Inverse Given if the element in column j is preferred over the other pair
IV.
APPLICATION MODEL
In this section, the beginning describe Bidikmisi scholarship data that represent the usefulness of each criterion or parameter. These criteria are used as input values for FCM and AHP. Both methods will be
compared to find out which method is appropriate in decision making of Bidikmisi scholarship recipients. Data Description
220
Copyright © 2018. IJEMR. All Rights Reserved.
Bidikmisi IPB scholarship the period of 2016/2017 as many as 804 students, including 623 students accepted and 181 students did not accepted. Data in this research were obtained from Directorate Student Affairs of Institut Pertanian Bogor (IPB). The criteria or requirements proposed by Bidikmisi scholarship are used as parameters on calculation method to be used. Parameters used are family income, parent education, number of family dependents, home ownership, electricity load used, land area and building area.
Parents income becomes main benchmark to know the economic condition of family with condition passing parents income determined by Bidikmisi scholarship that is combined parents income maximum 3 000 000 IDR per month and / or combined of parents income divided by maximum family member 750 000 IDR Every month. While the criteria based on number of family dependents is an indicator in determining amount of cost dependent to be issued each month. Moreover, the other criterion is parental education as shown in Figure 2.
Figure 2 shows parents education of scholarship recipient candidates, it appears that the parents of scholarship recipients with high school graduates more dominate than others. Most graduates to the fewest successively are SMA, SD, SMP, S1, no school and S2.
Figure 2 Education of parents of Bidikmisi scholarship recipients
The difference in parents education of scholarship recipients candidate between father and mother is influenced by the education that has been taken by them. The difference can be solved by giving weight of each education category in accordance with provisions of Bidikmisi scholarship. Parents educational conversions are presented in Table 1.
Table 1 Parents educational conversion Parents education
1= no school 5= Senior high school 2= not completed in
primary school
6= Diploma
3= Elementery school 7= S1 4= Junior high school 8= S2
The weighting also applied to parameters of home ownership status and electrical power. Home ownership can be used to determine the value of scholarship recipients candidate where renting a house status has a lower welfare value than house with its own status. Similarly, the electricity used by community is the main means of conducting daily activities. Giving weight of ownership of house and electric power can be seen in Table 2.
Table 2 The weight of home ownership and electrical power
Home ownership Electrical power (Watt) 1 = Belonging to grandma /
Grandpa
1= 250
2 = Ride 2= 450
3 = Contract 3= 950
4 = Inheritance / guardian 4= 1300 5 = Own property
Analysis of fuzzy c-means
In accordance with the algorithm of FCM programming objective function it is concluded
that iteration calculation ends in the 83rd iteration. The cluster center of iteration is shown in Table 6. The cluster central iteration in Table 6 shows that the first cluster contains criteria of scholarship recipients who have an average of parent income of 1 312 300 IDR, the average of family dependent 4.8692, the average parent education 8.4325, average of home ownership value 3.3147, average of electric power 2.5983 watts, average of land area 166.79 and building area averaging 92.17 . This explanation also applied to cluster 2 and cluster to-3. Information on the tendency of a scholarship recipient data to be among 3 clusters that have been determined is shown in Table 7.
The membership degree in Table 7 shows that the value of 0.5169 is the first membership data value in cluster 1 or , membership degree value of 0.4822 is
the first membership data value in cluster 2 or , and
the membership degree of 0.0008 is the first membership data value in cluster 3 or so on until the membership
value of 0.008 is the membership value of the 804 data in the 3rd cluster or . The membership value of student
221
Copyright © 2018. IJEMR. All Rights Reserved.
Table 6 Center cluster 83rd iteration
Cluster
Cluster 1 ( ) 1.3123 4.8692 8.4325 3.3147 2.5983 1.6679 0.9217
Cluster 2 ( ) 1.5120 4.8822 8.8465 3.7325 2.6148 11.9292 4.2484
Cluster 3 ( ) 1.5448 5.0715 8.8669 3.8508 2.6564 13.1804 168.469
Table 7 The membership degree of each data in cluster with FCM
Number
Membership degree U Trend data on the cluster
1 0.5169 0.4822 0.0008 1
2 0.0277 0.9721 0.0001 2
804 0.1348 0.8644 0.0008 2
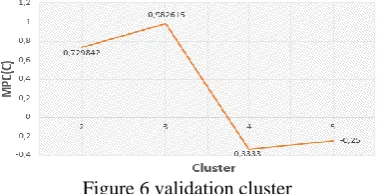
Cluster validation
Validation test determination number of scholarship recipients clusters on the FCM method is done by using MPC with testing number of clusters two to five clusters. The test can be seen in Figure 6.
Figure 6 validation cluster
The value of MPC index is at 0 to 1, the highest level of validity is owned by number of clusters with highest MPC index. Based on Figure 6 the number of clusters 3 is higher than others with a value of 0.982618. Therefore number of clusters 3 is optimal in scholarship recipients clustering.
Analysis of Analytic Hierarchy Process Method
A pairwise comparison scale value shows that the importance of each criterion between row criteria compared to column criteria. The scoring can be seen in Table 8.
Table 8 Comparison of priority of each Bidikmisi scholarship criterion
Criteria
1 5 2 3 4 7 9
0.2 1 5 4 2 7 3
0.111 0.333 0.5 0.333 0.5 0.5 1
In Table 8 the comparison of in colom with on line value is 1 meaning that both elements have same important level. Comparison of with value is 5 meaming that is strongly influential than another strongly influential than another element. The explanation of the scale value can be seen in Table 4. Then sought the weight of each parameter to know magnitude interest of each parameter as in Figure 7.
Figure 7 The order weight of priority criteria
Figure 7 shows the order weight of priority from high to low are parent's income, number of dependents, parent education, home ownership status, electric power, land area, and building area. Weight analysis of Bidikmisi scholarship priority criteria that the income of parents is 35.33% is the most prioritized criteria, the number of dependents is 22.62%, parents education is 16.54%, home ownership 9.94%, electric power 7.88%, building area 3.84% , and land area of 3.81%.
The consistency index test is performed to show the use of weight value in Fig. 7 can be used or not if it qualifies the test then the weights obtained can be used. While the value of CR = 0.144 means that the value is greater than 0.10 and less than 0.20 so that the weighted survey results are valid and the priority weight value can be used. The priority value of each parameter is then multiplied by the value of each alternative element to obtain the order of the scholarship recipients shown in Table 9.
Table 9 The alternative value is multiplied by the criteria weighted
Number Alternative Score
1 220 2529.933
2 33 10096.19
3 507 10096.4
222
Copyright © 2018. IJEMR. All Rights Reserved.
5 417 10103.82
804 677 252375.9
In Table 9 the number of scholarship recipients who will receive Bidikmisi scholarships is ranked based on the lowest score scores ranging from 220 students to the required quota, in which case there are 623 people to be taken.
Comparison of FCM and AHP method
Bidikmisi scholarship recipients using FCM have data suitability with Bidikmisi scholarship results as many as 489 from 804 students or about 60.69%, while the level of data compatibility using AHP is as many as 590 scholarship recipients or about 73%. This is because the AHP method is more structured than the FCM method. The AHP method can describe problems more easily understood by creating hierarchies. In addition the AHP method also takes into account the weight value of each criterion, so that decision makers can know the magnitude of the influence of criteria in decision making to consider the best alternative. The weakness of the AHP method has a dependence on the value of the comparison scale because the weights can not be used if the assessment does not meet the specified tolerance limit.
While the FCM method takes a longer time because the calculation process requires iteration calculation, where iteration will stop with error . The
higher the specified error the number of iterations gets larger and vice versa. Another disadvantage is that output from clusters tends to the value of membership so that many scholarship recipients are not expected to match expectations.
V.
CONCLUSION
Bidikmisi scholarship recipients in the period 2016/2017 Bidikmisi scholarship recipient on decision
support system with FCM obtained 623 people graduated, 177 people recommended and 4 people who did not pass. The AHP method gives results of the recipient of scholarship recipients of 623 people who graduated and 181 people who did not pass.
Bidikmisi scholarship recipients using FCM have data suitability with actual results as many as 489 from 804 students or about 60.69%, while the level of data compatibility using AHP is as many as 590 scholarship recipients or about 73%.
REFERENCES
[1] Arifin, M. (1977). Hubungan timbal balik pendidikan
agama di lingkungan sekolah dan keluarga. Jakarta:
Bulan Bintang.
[2] Kusumadew S, Hartati S, Harjoko A, & Wardoyo R. (2010). Fuzzy Multi-Atribute Decision Making (MADM). Yogyakarta (ID): Graha ilmu.
[3] Murniasih E. (2009). Buku Pintar Beasiswa. Jakarta (ID): Gagas Media.
[4] Pasaribu NP, Bukhari F, & Silalahi BP. (2017).
Aplikasi Metode Analytic Hierarchy Process (AHP) untuk Mendukung Pengambilan Keputusan dalam Seleksi
Anggota Paduan Suara. Bogor (ID): Institut Pertanian
Bogor.
[5] Rao RV. (2007). Decision Making in the
Manufacturing Environment. London, UK:
Springer-Verlag.
[6] Muhamad Ibrohim & Sumiati. (2016). Decision support system for determining the scholarship recipients using simple additive weighting. International Journal of
Computer Applications, 151(2), 10-13.
[7] Hendrayana, et. al. (2014). Motivasi belajar, kemandirian belajar dan prestasi belajar mahasiswa beasiswa bidikmisi di upbjj-ut bandung. Jurnal