∋!!)∗
+!,−−.−∋∃−
BEHAVIOUR OF ACOUSTIC WAVES IN A DUCT WITH
HELMHOLTZ
RESONATOR
IN
PRESENCE
OF
A
TEMPERATURE GRADIENT
Haydar Aygün MARTECH, Southampton Solent University, Southampton, UK
Philip Rubini School of Engineering, The University of Hull, Kingston upon Hull, UK
1. Introduction
Understanding the behaviour of one-dimensional acoustical wave propagation in ducts is very important for controlling combustion instabilities in propulsion, household burners, gas turbine combustors, rocket engines, measuring impedance of gas and oil fired systems, and designing engineering mufflers.
A simple approximate method of solving the acoustic wave equation in hard-walled ducts with an axial temperature gradient in the absence of mean flows has been presented by Cummings1. In the method of separation of variables, the axial factor in the solution was obtained as a product of two factors, one being an amplitude function and the other a phase function. A method for obtaining an exact solution that describes the behaviour of one-dimensional oscillations in a duct with an arbitrary axial temperature profile without mean flow has been outlined by Sujith et al.2. The solutions obtained for a duct with a linear mean temperature profile were used to investigate the acoustics of a quarter wave tube, and to extend the classical impedance tube technique to the determination of the admittances of combustion and other high temperature processes and systems. Karthik et al.3 described a solution of the derivation of the wave equation for the behaviour of one-dimensional oscillations in duct with a mean temperature gradient and mean flow. The analysis is valid for mean Mach numbers such that the square of the mean Mach number is much less than one. Sujith4 presented an exact, explicit solution for sound propagation in a combustion zone, taking into account the effect of an arbitrarily steep mean temperature gradient and oscillatory heat release. The analysis was not valid for large mean Mach numbers. Peat5, and Munjal and Prasad6 have developed exact solutions for ducts with small temperature gradients in the presence of air flows. Kapur et al.7 also obtained numerical solutions for sound propagation in ducts with axial temperature gradients in the absence of mean flows by integrating the wave equation using a Runge – Kutta method. Aygün and Attenborough8 have investigated the effects of the perforation of the plates on the uniformity of flow and the sound absorption in a duct in the absence of mean air flow. Aygün and Attenborough9 have investigated the acoustic wave propagation in an impedance tube made of concrete for low frequency applications.
CFD has developed over the last two decades to be able to predict the pressure drop associated with the steady flow through the mufflers and to predict the acoustic performance of the muffler. Essentially this means determining as a function of frequency how harmonically varying pressure fluctuations at the inlet of the muffler are largely attenuated before they emerge at the outlet10. The aim of this paper is to validate the numerical CFD methodology for the simulation of impedance tubes with Helmholtz resonator in presence of a temperature gradient. A full Navier-Stokes simulation is obtained through a CFD analysis of the propagation of an acoustic wave through an impedance tube with a Helmholtz resonator in the presence of a mean temperature gradient without mean air flow. The behaviour of one-dimensional oscillations in an impedance tube with an axial temperature gradient in the absence of mean flow is investigated using an analytical method. The analytical model results are compared to the data obtained from numerical simulation of the impedance tube.
2. Theory of the acoustical behaviour of sound waves in impedance
tube with a temperature gradient
t
e
x
P
t
x
P
'
(
,
)
'
(
)
j (1)where is the eigenfrequency, t is the periodic time, exponential ‘e’ is the base of natural logarithms, and
j is the square root of
1 andP
' x
(
)
is given by
T
b
Y
c
T
b
J
c
x
P
'
(
)
1 0
2 0
(2)where J0 and Y0 are the Bessel and Neumann functions of order zero respectively, c1 and c2 are complex
constants, b is a constant given by
R
m
b
2
(3)m is the temperature gradient, R is the specific gas constant and
is the heat capacity ratio.T
is the linear temperature gradient given bymx
T
T
0
(4)where T0 is the constant temperature at x = 0.
The complex constants c1 and c2 are given by
1 1 11 2 1 1 1 1 1
2
,
2
b
P
J
b
T
T
c
T
b
Y
P
b
T
c
(5)where J1 and Y1 are the first order of Bessel and Neumann functions respectively, T1 is the temperature at x = 0, and P1 is the magnitude of the acoustic pressure at x = 0.
The expression for acoustic velocity in impedance tube is given by:
T
b
Y
c
T
b
J
c
T
R
i
m
m
x
U
1 1 2 1)
(
'
(6)where
is the linear temperature dependent density of fluid in impedance tube.Figure 1: The acoustic pressure amplitude with axial distance in an impedance tube for different temperature profiles at 1000 Hz for T0 = 450 K.
Figure 2: The acoustic velocity amplitude with axial distance in an impedance tube for different
0 0.2 0.4 0.6 0.8 1
0 500 1000 1500 2000 2500
Distance (m)
A
c
o
u
s
ti
c
P
re
s
s
u
re
A
m
p
li
tu
d
e
(
P
a
)
m = - 150 m = 150
0
0.2
0.4
0.6
0.8
1
0
1
2
3
4
5
6
7
8
Distance (m)
A
c
o
u
s
ti
c
V
e
lo
c
it
y
A
m
p
li
tu
d
e
(
m
/s
)
3. CFD (Computational Fluid Dynamic) simulation of an impedance
tube in presence of mean temperature gradient.
The Navier-Stokes simulations were obtained using ANSYS Fluent V13 [20]. A circular impedance tube, of length 184.3 cm and diameter 3.75 cm was modelled as a 2D-axisymetric system with a regular mesh of 1800 x 120 cells in the axial and radial directions respectively. Solutions were obtained using the segregated pressure based solver with second order accurate discretisation in space and time. The effects of turbulence were assumed to be negligible in the absence of mean flow. A full Navier-Stokes simulation was obtained, retaining viscous terms and wall shear.
A linear temperature profile was defined as the thermal boundary condition along the outer wall of the impedance tube. An initial steady state solution was obtained to ensure a uniform varying temperature gradient through the gaseous medium, prior to imposing the acoustic pressure signal. Air in impedance tube is modelled as an ideal gas and its thermo-physical properties are given as specific heat = 1006.43 J/(kg K), thermal conductivity = 0.02424 W/(m K), and viscosity = 1.7894 x 10⁻⁵ kg/(m s). The wall of impedance tube is modelled as aluminium and its thermo-physical properties are given as density = 2719 kg/m3, specific heat = 871 J/(kg K), and thermal conductivity = 202.4 W/(m K). The end of impedance tube is a stationary wall which has zero absorption coefficients. Total reflection occurs at the end of impedance tube.
The acoustic pressure (gauge total pressure) at the inlet of the impedance tube was defined as a sinusoidal variation with initial amplitude, Ao, of 5 Pa.
)
.
.
2
sin(
)
(
t
P
0A
0f
t
P
(7)where P0 is the atmospheric pressure which is 101325 Pa, A0 is the sound pressure amplitude, f is the
frequency in Hz and t is the time in seconds.
A time accurate solution was obtained with a time step equal to 0.01 milliseconds. The resultant spatial and temporal resolution was demonstrated to accurately resolve the range of acoustic wavelengths and frequencies under consideration, with a spatial resolution of 340 cells for a wavelength at a frequency of 1000 Hz and a corresponding temporal resolution of 100 time steps per period. Time step size used for run calculation is 1x10⁻⁵ with 800 time steps. Maximum iteration per time step is 20. Profile update interval and reporting interval is 1. Total computational time is 8 milliseconds. The convergence history of acoustic-pressure for 8x10⁻³ s has been plotted for 4200 iterations.
Figure 3: (a) Surface plot of acoustic pressure amplitude and (b) surface plot of axial velocity amplitude
2
4
6
x 10-3 0.5
1 1.5
-8 -6 -4 -2 0 2 4 6 8
Time (s) Surface Plot
Distance (m)
P
re
s
s
u
re
A
m
p
lit
u
d
e
(
P
a
)
2
4
6
x 10-3
0.5 1
1.5 -0.03 -0.02 -0.01 0 0.01 0.02 0.03
Time (s) Surface Plot
Distance (m)
A
X
ia
l
V
e
lo
c
it
y
(
m
/s
)
(a)
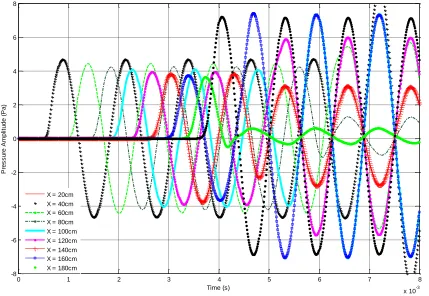
Acoustic pressure amplitudes of acoustic waves in the impedance tube varying with time have been obtained at different position for 800 Hz in the tube by using a custom field function in fluent. The results are presented in Figure 4. Constructive and destructive interferences between forward going waves and backward going waves can clearly be observed at some positions for 800 Hz.
Figure 4: CFD data of acoustic pressure amplitudes versus time at the different position in the impedance tube with temperature gradient for 800 Hz.
4. CFD (Computational Fluid Dynamic) simulation of an impedance
tube with a Helmholtz resonator attached to end in presence of
mean temperature gradient.
A process used in part 3 has been followed in here to simulate the wave propagation in the tube with a Helmholtz resonator. A circular cross section impedance tube, of length 180 cm and diameter 7.5 cm was modelled as a 2D-axisymetric system with a regular mesh of 1800 x 120 cells in the axial and radial directions respectively. The diameter of the neck of Helmholtz resonator is 2.5 cm. The Helmholtz resonator has a length of 3.5 cm and diameter of 7.5 cm.
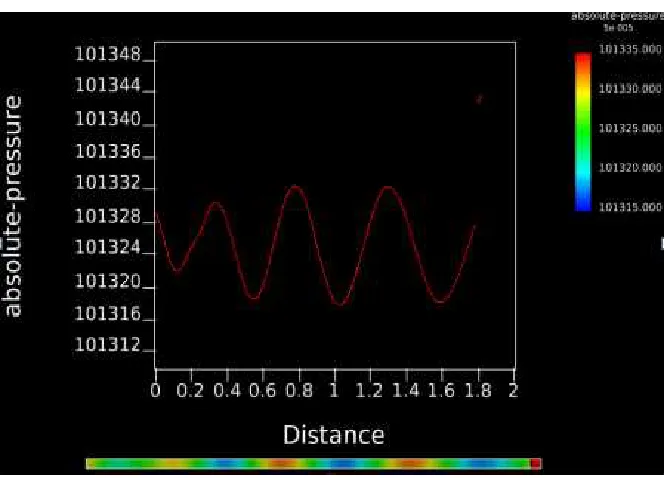
The incident and reflected waves create constructive or destructive interference according to their phase difference. This results in producing of standing waves which are interferences characterised by large changes in amplitude with position. The variation of acoustic pressure anti-nodes (higher pressure areas) and nodes (lower pressure areas) as a function of distance is shown in Figure 5. When the temperature of the air in the impedance tube increases along the length of the tube, the speed of sound in air will increase too. Therefore the corresponding wavelength in the higher temperature region of the impedance tube is greater than the wavelength observed in the cooler region at the inlet. The acoustic pressure propagating through the impedance tube and Helmholtz resonator is shown in Figure 6. Maximum acoustic pressure observed in the Helmholtz resonator after acoustic waves reflected from the end of the Helmholtz resonator is higher than one observed in the Impedance tube by almost about 10 Pa.
0 1 2 3 4 5 6 7 8
x 10-3 -8
-6 -4 -2 0 2 4 6 8
Time (s)
P
re
s
s
u
re
A
m
p
lit
u
d
e
(
P
a
)
Figure 5: Acoustic pressure as a function of length of the tube.
Figure 6: CFD simulation of acoustic-pressure as a function of axial length of the tube and Helmholtz resonator.
5. Conclusion and Further work
Computational fluid dynamics results should be used to design an impedance tube for high temperature applications (e.g. gas turbine combustors), particularly with respect to location of microphones, by positioning them at the cool end of impedance tube but relating their measurements to what is actually happening at the hot end.
6. References
1. A. Cummings, Ducts with axial temperature Gradients: an approximate solution for sound transmission and generation. Journal of Sound and Vibration 51 (1977) 55-67.
2. R. I. Sujith, G. A. Waldherr, B. T. Zinn, An exact solution for one-dimensional acoustic fields in ducts with an axial temperature gradient. Journal of Sound and Vibration 184 (1995) 389-402. 3. B. Karthik, B. M. Kumar, R. I. Sujith, Exact solutions to one-dimensional acoustic fields with
temperature gradient and mean flow. J. Acoust. Soc. Am. 108 (2000) 38-43.
4. R. I. Sujith, Exact solutions for modelling sound propagation through a combustion zone. J. Acoust. Soc. Am. 110 (2001), 1839 - 1844.
5. K. S. Peat, The transfer matrix of a uniform duct with a linear temperature gradient. Journal of Sound and Vibration 123 (1988) 43-53.
6. M. L. Munjal, M. G. Prasad, Plane-wave propagation in an uniform pipe in the presence of a mean flow and a temperature gradient. J. Acoust. Soc. Am. 80 (1986) 1501-1506.
7. A. Kapur, A. Cummings, P. Mungur, Sound propagation in a combustion can with axial temperature and density gradients. Journal of Sound and Vibration 25 (1972) 129-138.
8. H. Aygün, K. Attenborough, The insertion loss of perforated porous plates in a duct with and without mean air flow. Applied Acoustics 69 (2008) 506-513.
9. H. Aygün, K. Attenborough, Sound absorption by clamped porous elastic plates. J. Acoust. Soc. Am. 124 (2008) 1-7.
10. J. M. Middelberg, T. J. Barber, S. S. Leong, K. P. Byrne, and E. Leonardi, Computational Fluid Dynamics analysis of the acoustics performance of various simple expansion chamber mufflers. Proceedings of Acoustics. November 2004, Gold Coast, Australia.