235
Copyright © 2011-15. Vandana Publications. All Rights Reserved.
Volume-5, Issue-4, August-2015
International Journal of Engineering and Management Research
Page Number: 235-240
Performance Improvement of Solar Photovoltaic System using Cuk
Converter
Ankush Bravvo1, Gurpreet Singh2
1M. Tech( student), Department of EEE, JCDMCOE, Sirsa, Guru Jambheshwar University of Science & Technology, Hissar,
INDIA
2Assistant Professor, Department of EEE, JCDMCOE, Sirsa, Guru Jambheshwar University of Science & Technology, Hissar,
INDIA
ABSTRACT
Due to world energy crisis and growing demand for energy as the conventional energy sources have become increasingly unable to meet the world demand for the energy. This paper present the design and simulation for maximum power point tracking for photovoltaic system which include a high efficiency DC-DC Cuk converter with an Incremental Conductance algorithm. The converter is able to draw maximum power from the PV panel for a given solar isolation and temperature by adjusting the duty cycle of the converter. Converter can be operate in both buck and boost mode. Results have been calculated by operating the converter in buck mode. The modeling procedure for the circuit model was presented using MATLAB/Simulink Sim-power.
Keywords---- Cuk Converter, Maximum Power Point
(MPP), Maximum Power Point Tracking (MPPT), Incremental Conductance (IC), Photovoltaic (PV)
I.
INTRODUCTION
With world economic development and growing demand for energy, the conventional energy sources have become increasingly unable to meet the world demand for the energy. Thus, it is important to explore more and better means of an alternative energy sources like sunlight, wind and biomass. Photovoltaic energy is a source of interesting energy; it is renewable, inexhaustible and non-polluting and it is more and more intensively used as energy sources in various applications. In regard to endless importance of solar energy, it is worth saying that solar energy is a unique prospective solution for energy crisis. Meanwhile, despite all these advantages of solar energy, they do not present desirable efficiency [2] , [3] The efficiency of solar
cells depends on many factors such as temperature, isolation, spectral characteristics of sunlight, dirt, shadow, and so on. Changes in isolation on panels due to fast climatic changes such as cloudy weather can reduce the photovoltaic (PV) array output power. In other words, each PV cell produces energy pertaining to its operational and environmental conditions [3], In order to improve the poor efficiency of PV systems, some methods are proposed, among which is a new concept called “maximum power point tracking” (MPPT). All MPPT methods follow the same goal which is maximizing the PV array output power by tracking the maximum power on every operating condition.
II.
MPPT METHODS
236
Copyright © 2011-15. Vandana Publications. All Rights Reserved.
specific subjects such as fuzzy logic or neural network[3],[4] methods. MPPT fuzzy logic controllers have good performance under varying atmospheric conditions and exhibit better performance than the P&O control method however, the main disadvantage of this method is that its effectiveness is highly dependent on the technical knowledge of the engineer in computing the error and coming up with the rule-based table. It is greatly dependent on how a designer arranges the system that requires skill and experience. A similar disadvantage of the neural network method comes with its reliance on the characteristics of the PV array that change with time, implying that the neural network has to be periodically trained to guarantee accurate MPPs.
Fig 1 Maximum Power Point
Fig. 1 shows that the slope of the PV array power curve is zero at the MPP, increasing on the left of the MPP and decreasing on the right hand side of the MPP. The basic equations of
this method are as follows;
𝑑𝑑𝑑𝑑 𝑑𝑑𝑑𝑑=
𝑑𝑑(𝐼𝐼𝑑𝑑)
𝑑𝑑𝑑𝑑 =𝐼𝐼+𝑑𝑑 𝑑𝑑𝐼𝐼
𝑑𝑑𝑑𝑑 (1)
𝑑𝑑𝐼𝐼 𝑑𝑑𝑑𝑑=−
𝐼𝐼
𝑑𝑑 ,𝑎𝑎𝑎𝑎 𝑀𝑀𝑑𝑑𝑑𝑑 (2)
𝑑𝑑𝐼𝐼 𝑑𝑑𝑑𝑑>−
𝐼𝐼
𝑑𝑑 ,left of MPP (3)
𝑑𝑑𝐼𝐼
𝑑𝑑𝑑𝑑< −
𝐼𝐼
𝑑𝑑 ,right of MPP (4)
Where I and V are the PV array output current and voltage, respectively. The left-hand side of the equations represents the Inc Conductance of the PV module, and the right-hand side represents the instantaneous conductance. From (2), it is obvious that when the ratio of change in the output conductance is equal to the negative output conductance, the solar array will operate
at the MPP. In other words, by comparing the conductance at each sampling time, the MPPT will track the maximum power of the PV module.
III.
PV MODULE
The basic structural unit of a solar array is the PV cell which is shown in fig 2. A solar cell converts energy in the photons of sunlight into electricity by means of the photoelectric phenomenon found in certain types of semiconductor materials such as silicon and selenium.
Fig 2 Equivalent circuit of PV Cell
The basic equation from the theory of semiconductors that mathematically describe the I–V
characteristic of the ideal PV cell is;
where Ipv, cell is the current generated by the incident light (it is directly proportional to the Sun irradiation), Id is the Shockley diode equation, I0
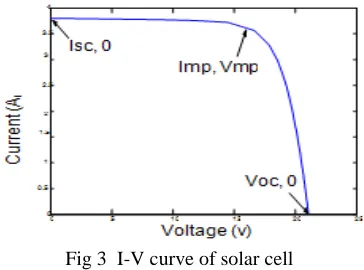
Fig 3 I-V curve of solar cell
Practical arrays are composed of several connected PV cells and the array requires the inclusion of additional parameters to the basic equation.
, cell is the reverse saturation or leakage current of the diode, q is the electron charge (1.60217646 × 10⁻¹⁹ C),k is the Boltzmann constant (1.3806503 × 10⁻²³ J/K), T (in Kelvin) is the temperature of the p–n junction, and a is the diode ideality constant. Fig. 3 shows the I–V curve originated from above equation
237
Copyright © 2011-15. Vandana Publications. All Rights Reserved.
Where Ipv and I0 are the photovoltaic (PV) andsaturation currents, respectively, of the array and Vt =
NskT/q is the thermal voltage of the array with Ns cells
connected in series. Cells connected in parallel increase the current and cells connected in series provide greater output voltages. If the array is composed of Np parallel connections of cells the PV and saturation currents may be expressed as Ipv = Ipv, cell Np, I0 = I0,cell Np. where Rs is the equivalent series resistance of the array and Rp is the equivalent parallel resistance. This equation originates the
I–V where three remarkable points are highlighted: short circuit (0, Isc), MPP (Vmp, Imp), and open circuit (Voc, 0). For simulations the Solarex-MSX60 module was chosen. The electrical parameters are tabulated TABLE I; ELECTRICAL PARAMETERS OF Solarex-MSX60 MODULE
Maximum power (Pmax) 60W Voltage @ Pmax (Vmp) 17.1V Current @ Pmax (Imp) 3.5A Short-circuit current (Isc) 3.8A Open-circuit voltage (Voc) 21.1V
Fig 4 I-V curve on different isolation
Fig 5 P-V curve on different isolation
The resultant curves are shown in Fig. 4 and 5. It shows the effect of varying isolation conditions on MPP location at I–V and P–V curves. Fig. 4 shows the current-versus-voltage curve of a PV module. It gives an idea about the significant points on each I–V curve: open-circuit voltage, short-circuit current, and the operating point where the module performs the maximum power (MPP). This point is related to a voltage and a current that are Vmpp and Impp respectively, and is highly dependent on solar irradiation and ambient temperature.
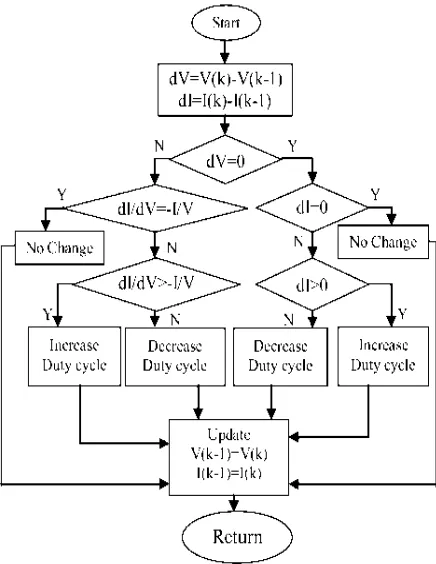
Fig 6 flow chart of Incremental Conductance
The MPP can thus be tracked by comparing the instantaneous conductance (I/V) to the incremental conductance (ΔI/ΔV ) as shown in the flowchart in Fig. 6.
Vref is the reference voltage at which the PV array is
forced to operate. At the MPP, Vref equals to VMPP. Once the MPP is reached, the operation of the PV array is maintained at this point unless a change in ΔI is noted, indicating a change in atmospheric conditions and the MPP. The algorithm decrements or increments duty cycle to track the new MPP.
IV.
CUK CONVERTER
When proposing an MPP tracker, the major job is to choose and design a highly efficient converter, which is supposed to operate as the main part of the MPPT. Among all the topologies available, CuK converter provide the
0 5 10 15 20 25
0 10 20 30 40 50 60
Voltage (v)
P
ow
er
(
w)
1000 W/m2 800 W/m2 600 W/m2 400 W/m2
0 5 10 15 20 25
0 0.5 1 1.5
2 2.5 3 3.5 4
Voltage (v)
C
ur
rent
(
A
)
238
Copyright © 2011-15. Vandana Publications. All Rights Reserved.
opportunity to have either higher or lower output voltagecompared with the input voltage.
Although the buck–boost configuration is cheaper than the Cuk one [1],[9] some disadvantages, such as discontinuous input current, high peak currents in power components, and poor transient response, make it less efficient[10]. On the other hand, the Cuk converter has low switching losses and the highest efficiency among nonisolated DC–DC converters. It can also provide a better output-current characteristic due to the inductor on the output stage. Thus, the Cuk configuration is a proper converter to be employed in designing the MPPT.
.
Fig 7 Cuk Converter
The circuit arrangement of the Cuk converter using MOSFET switch is shown in Figure.7 in case of Cuk converter the output voltage is opposite to input voltage. When the input voltage turned on and MOSFET (SW) is switched off, diode D is forward biased and capacitor C1 is charged through L1–D.
Cuk converter uses a capacitor as the main energy storage. As a result, the input current is continuous. The circuits have low switching losses and high efficiency [10]. Due to the inductor on the output stage, the Cúk converter can provide a better output current characteristic.
Here the operation of converter divided into two modes Mode-1:- When MOSFET switch is turned on. The current through L1 rises. And at the same time the voltage of C1 reverse biases diode D and turn it off. The capacitor C1 discharges its energy to the circuit C1-C2-load-L2.
Mode-2:- When MOSFET switch is turned off . The
capacitor will start to charge from input supply Vs and the energy stored in the inductor transferred to the load. The capacitor C1 is the medium for transferring energy from source to load.
The relations between output and input currents and voltages are given in the following:
The proposed Cuk converter is implemented in between a solar panel and load which is able to deliver maximum output power. The output voltage can be controlled by using the duty cycle variation. The basic
parameters of Cuk converter L1, C1, L2, C2 are chosen such that we can obtain the required output voltage and maximum output power at maximum efficiency of the circuit.
V.
SIMULATION RESULTS
Based on the Incremental Conductance algorithm, the simulation was conducted using DC–DC Cuk converter system implemented with Sim Power Systems toolbox of MATLAB/Simulink model. The simulation system consists of photovoltaic module, DC-DC Cuk converter circuit and MPPT. The Output of PV module is given to MPPT controller. Triggering pulse of MPPT controller is given to MOSFET switch. Then the output is fed to the load .The entire system has been modeled on MATLAB™ 2012a.
The simplified flow chart of IC Algorithm is given in Fig 6. The various waveforms were obtained by using the plot mechanism in MATLAB.
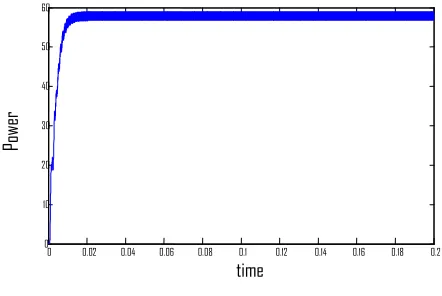
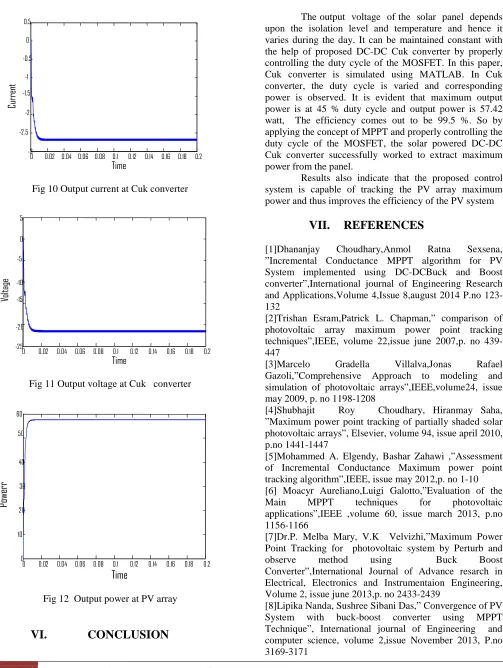
Fig 8 and Fig 9 presents the output power at Cuk converter, with and without MPPT on isolation 1000 W/m2. Fig 10 and Fig 11 presents the output current and output voltage at Cuk converter with MPPT. Fig 12 presents the output power at PV array.
Fig 8 Output power at Cuk converter with MPPT
Fig 9 Output power at Cuk converter without MPPT
0 0.02 0.04 0.06 0.08 0.1 0.12 0.14 0.16 0.18 0.2 0
2 4 6 8 10 12 14 16 18
time
P
ow
er
0 0.02 0.04 0.06 0.08 0.1 0.12 0.14 0.16 0.18 0.2
0 10 20 30 40 50 60
time
Po
239
Copyright © 2011-15. Vandana Publications. All Rights Reserved.
Fig 10 Output current at Cuk converterFig 11 Output voltage at Cuk converter
Fig 12 Output power at PV array
VI.
CONCLUSION
The output voltage of the solar panel depends upon the isolation level and temperature and hence it varies during the day. It can be maintained constant with the help of proposed DC-DC Cuk converter by properly controlling the duty cycle of the MOSFET. In this paper, Cuk converter is simulated using MATLAB. In Cuk converter, the duty cycle is varied and corresponding power is observed. It is evident that maximum output power is at 45 % duty cycle and output power is 57.42 watt, The efficiency comes out to be 99.5 %. So by applying the concept of MPPT and properly controlling the duty cycle of the MOSFET, the solar powered DC-DC Cuk converter successfully worked to extract maximum power from the panel.
Results also indicate that the proposed control system is capable of tracking the PV array maximum power and thus improves the efficiency of the PV system
VII.
REFERENCES
[1]Dhananjay Choudhary,Anmol Ratna Sexsena, ”Incremental Conductance MPPT algorithm for PV System implemented using DC-DCBuck and Boost converter”,International journal of Engineering Research and Applications,Volume 4,Issue 8,august 2014 P.no 123-132
[2]Trishan Esram,Patrick L. Chapman,” comparison of photovoltaic array maximum power point tracking techniques”,IEEE, volume 22,issue june 2007,p. no 439-447
[3]Marcelo Gradella Villalva,Jonas Rafael Gazoli,”Comprehensive Approach to modeling and simulation of photovoltaic arrays”,IEEE,volume24, issue may 2009, p. no 1198-1208
[4]Shubhajit Roy Choudhary, Hiranmay Saha, ”Maximum power point tracking of partially shaded solar photovoltaic arrays”, Elsevier, volume 94, issue april 2010, p.no 1441-1447
[5]Mohammed A. Elgendy, Bashar Zahawi ,”Assessment of Incremental Conductance Maximum power point tracking algorithm”,IEEE, issue may 2012,p. no 1-10 [6] Moacyr Aureliano,Luigi Galotto,”Evaluation of the Main MPPT techniques for photovoltaic applications”,IEEE ,volume 60, issue march 2013, p.no 1156-1166
[7]Dr.P. Melba Mary, V.K Velvizhi,”Maximum Power Point Tracking for photovoltaic system by Perturb and observe method using Buck Boost Converter”,International Journal of Advance resarch in Electrical, Electronics and Instrumentaion Engineering, Volume 2, issue june 2013,p. no 2433-2439
[8]Lipika Nanda, Sushree Sibani Das,” Convergence of PV System with buck-boost converter using MPPT Technique”, International journal of Engineering and computer science, volume 2,issue November 2013, P.no 3169-3171
0 0.02 0.04 0.06 0.08 0.1 0.12 0.14 0.16 0.18 0.2 0
10 20 30 40 50 60
Time
Po
we
rr
0 0.02 0.04 0.06 0.08 0.1 0.12 0.14 0.16 0.18 0.2 -25
-20 -15 -10 -5 0 5
Time
Vol
ta
ge
0 0.02 0.04 0.06 0.08 0.1 0.12 0.14 0.16 0.18 0.2 -3
-2.5 -2 -1.5 -1 -0.5
0 0.5
Time
Cu
rr
en
240
Copyright © 2011-15. Vandana Publications. All Rights Reserved.
[9] C.Jena, Amruta Dass, M.basu,”Modeling andsimulation of photovoltaic module with Buck boost converter”, International journal of advance engineering and nano technology, volume 1, issue february 2014,p no 18-21