Vol. 3, No. 4 (2013): 309-315 Research Article
Open Access
I
ISSSSNN:: 22332200--66881100
A Validated Stability Indicating RP-HPLC Method for
Estimation of Pitavastatin in Bulk and
Pharmaceutical Dosage Form
B. Neelima
1*, P. Ravi Kumar
1, V. Hima Bindu
2and Y. Rajendra Prasad
11
University College of Pharmaceutical Sciences, Andhra University, Visakhapatnam-530 003, (A.P.) INDIA
2
Center for Environment, Institute of Science and Technology, Jawaharlal Nehru Technical University, Hyderabad-500 085 (A. P.) INDIA
* Corresponding author: B. Neelima; e-mail: [email protected]
ABSTRACT
A new simple, selective, accurate Stability- Indicating RP-HPLC method has been developed and validated for quantitative determination of pitavastatin in bulk and pharmaceutical dosage form. The chromatographic separation was achieved with Agilent Eclipse XDB, C18, (150 x 4.6 mm, 5) column. The optimized mobile phase consisting phosphate buffer: Acetonitrile (65:35% v/v pH 3.5 adjusted with o-phosphoric acid. The flow rate was 0.9 mL/min and eluent was detected at 244nm using PDA detector. The retention time of pitavastatin was found to be 3.05. The percentage recoveries were found to be in the range of 99.00-100%. The calibration curve was constructed between peak area vs concentration and demonstrated good linear in the range of 25 -150µg/ml. Degradation studies were studied for pitavastatin under various stress conditions such as acid hydrolysis, base hydrolysis, oxidation, thermal, photochemical and UV. All the degradation peaks were resolved effectively using developed method with different retention times. The developed method was validated according to ICH guidelines. As the method could effectively separates the degradation products from active ingredient, it can be used for routine analysis of drug both in bulk and pharmaceutical dosage form.
Keywords:
HPLC; Pitavastatin; Dosage FormINTRODUCTION
Pitavastatin is a novel, synthetic3-hydroxy-3-methylglutarylcoenzyme A (HMG-CoA) reductase inhibitor [1-2], approved for the treatment of hypercholesterolemia.HMG-CoA enzyme inhibitors inhibit the synthesis of mevalonate, a rate limiting step in synthesis of cholesterol, results in the lowering of cholesterol [3]. It is a competitive inhibitor and exerts its potent pharmacological actions by strongly binding to the active sites on HMG-CoA reductase. It has more potent lipid lowering action that other statins [4]. Chemically it is, (3R, 5S)-7-(2-cyclopropyl-4-(4-fluorophenyl) quinolin-3-yl) - 3, 5-dihydroxy 6(E)-heptenoic acid [5]. Literature survey revealed that, there are few analytical methods such as spectrophotometry [6], HPLC [7], HPTLC [8-9], UPLC [10] and LC/MS [11] has been reported for estimation of pitavastain, but there is no stability indicating method by RP-HPLC was reported for pitavastatin. According to the stability test guidelines issued by ICH [12-15], in the present study the stress induced
stability studies were carried out for pitavastatin to establish its stability characteristics and also an analytical method develop by RP-HPLC and developed method was validated.
Figure 1. Chemical structure of Pitavastatin
MATERIALS AND METHODS
Chemicals and ReagentsPitavastatin was obtained as gift sample from Spectrum Pharma Research laboratory in Hyderabad and marketed formulation Pitavastatin 2mg was purchased
from local market. Acetonitrile, Water, were obtained from Merck. Mumbai and Potassium dihydrogen ortho phosphate, Ortho Phosphoric Acid obtained from RANKEM Mumbai. All solvents used in this work are HPLC grade.
Instrument and chromatographic conditions
RP-HPLC waters 2695 separation module equipped with 2996Photodiode Array Detector was employed in this method. The Empower 2 software was used for LC peak integration along with data acquisition and data processing. The column used for separation of analytes is Agilent Eclipse XDB, C18, (150 x 4.6 mm, 5). Mobile phase consisting of Phosphate Buffer: Acetonitrile in the ration of 65:35 %v/v at a flow rate of 0.9 ml/min. It was filtered through 0.45μm nylon filter and sonicated for 5 min in ultrasonic bath. Samples were analysed at 244 nm at an injection volume of 10 μL.
Preparation of Phosphate Buffer pH 3.5
Transfer 1.36gr of Potassium Dihydrogen orthophosphate (KH2PO4) in to a 1000ml beaker add about 800ml of milli-Q water and sonicate to degas and make up to final volume and then pH adjusted to 3.5 with dil. Orthophosphoric acid solution.
Standard solution Preparations
Accurately Weighed and transferred 10mg of Pitavsatin working Standards into a 10 ml clean dry volumetric flask, add 7ml of diluent , sonicated for 5 minutes and make up to the final volume with diluent (standard stock-1mg/ml). From the standard stock solution, 1ml was pipette out into a 10ml volumetric flask and makes up to the mark with the diluent.
Sample solution Preparations
5 tablets were weighed and calculate the average weight of each tablet then the weight equivalent to 5 tablets was transferred into a 10 mL volumetric flask, 7mL of diluent added and sonicated for 25 min, further the volume made up with diluent and filtered. From the filtered solution 1ml was pipette out into a 10 ml volumetric flask and made upto 10ml with diluent.
Method Validation
The validation of the method was carried out as per ICH Guidelines. The parameters assessed were specificity, linearity, precision, accuracy, stability, LOD and LOQ.
Specificity
Specificity is the ability of the analytical method to measure the analyte response in the presence of interferences including degradation products and related substances.
Accuracy
The accuracy was carried out by adding known amounts of each analyte corresponding to three concentration levels (50, 100, and 150%) of the labelled claim to the excipients. At each level, six determinations were performed and the accuracy
results were expressed as percent analyte recovered by the proposed method.
Precision
The repeatability studies were carried out by estimating response of pitavastatin six times and results are reported in terms of relative standard deviation. The intra-day and inter-day precision studies (intermediate precision) were carried out by estimating the corresponding responses three times on the same day and on three different days for three different concentrations and the results are reported in terms of relative standard deviation.
Linearity
The purpose of the test for linearity is to demonstrate that the entire analytical system (including detector and data acquisition) exhibits a linear response and is directly proportional over the relevant concentration range for the target concentration of the analyte.
Robustness
The robustness of an analytical procedure is a measure of its capacity to remain unaffected by small, but deliberate changes in method parameters. Robustness of the method was investigated under a variety of conditions including changes of composition of buffer in the mobile phase, flow rate and temperature. This deliberate change in the method has no affect on the peak tailing, peak area and theoretical plates and finally the method was found to be robust.
LOD & LOQ
The LOD can be defined as the smallest level of analyte that gives a measurable response and LOQ was determined as the lowest amount of analyte that was reproducibly quantified. These two parameters were calculated using the formula based on the standard deviation of the response and the slope. LOD and LOQ were calculated by using equations, LOD=3.3 × s/s and LOQ=10 × s/s, where s = standard deviation, S= slope of the calibration curve.
Forced Degradation studies
Stress studies are performed according to ICH guidelines under conditions of hydrolysis (acidic and alkaline), photolysis, oxidation, and thermal studies.
Oxidative Degradation
To 1 ml of Pitavastatin stock solution, 1 ml of 30% hydrogen peroxide (H2O2) was added separately. The solutions were kept for 30 min at 600c. For HPLC study, the resultant solution was diluted to obtain 100µg/ml solution and 10 µl were injected into the system and the chromatograms were recorded to assess the stability of sample.
Acid Degradation Studies
100µg/mlsolution and 10 µl solutions were injected into the system and the chromatograms were recorded to assess the stability of sample.
Alkali Degradation Studies
To 1 ml of Pitavastatin stock solution, 1 ml of 2 N sodium hydroxide was added and refluxed for 30mins at 600c.The resultant solution was diluted to obtain 100µg/ml solution and 10 µl were injected into the system and the chromatograms were recorded to assess the stability of sample.
Dry Heat Degradation Studies
The standard drug solution was placed in oven at 1050c for 6 h to study dry heat degradation. For HPLC study, the resultant solution was diluted to 100 µg/ml solution and10µl were injected into the system and the chromatograms were recorded to assess the stability of the sample.
Photo Stability studies
The photochemical stability of the drug was also studied by exposing the 100 µg/ml solution to UV Light by keeping the beaker in UV Chamber for 7days or 200 Watt hours/m2 in photo stability chamber. For HPLC study, the resultant solution was diluted to obtain 100µg/ml solutions and 10µl were injected into the system and the chromatograms were recorded to assess the stability of sample.
RESULTS AND DISCUSSION
Optimized Chromatographic conditions
The main aim for development of chromatographic method was to get reliable method for quantification of pitavastatin from bulk and pharmaceutical dosage form and which will be applicable for the degradation products also. Different chromatographic conditions
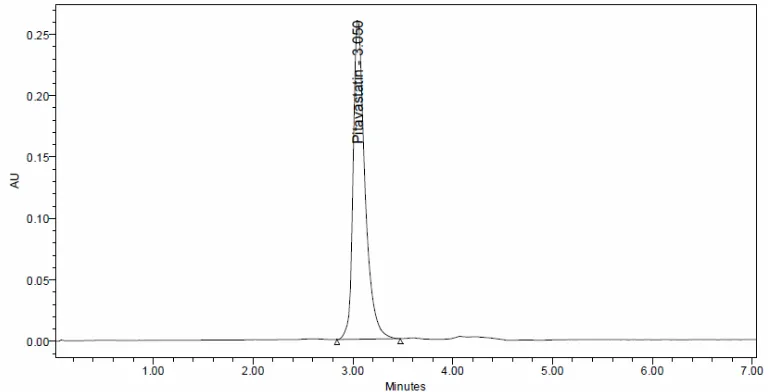
were employed for the analysis of the pitavastatin in both bulk and pharmaceutical dosage form. Finally the analysis was performed by using Phosphate Buffer: Acetonitrile in the ration of 65:35 %v/vat a flow rate 0.9 ml/min. Samples were analysed at 244 nm at an injection volume of 10 μL and separation was carried by using Agilent Eclipse XDB, C18, (150 x 4.6 mm, 5)., column. The proposed method was optimized to give a sharp peak with minimum tailing for pitavastatin calcium. (Fig. 2).
Assay of Pitavastatin in Tablet
Assay of marketed product was carried out by using the developed method. Sample solutions were prepared and injected into HPLC system. The sample solution was scanned at 244 nm. The % drug estimated was found to be 99.86. A single peak was observed with retention time 2.99. (Figure 3).
Accuracy
The accuracy of the proposed method was determined by standard addition method. The recovery studies of pitavastatin were performed at three different drug concentrations levels such as 50%, 100% & 150%.The recovery studies carried out three times over the specified concentration. Good recovery of the pitavastatin was obtained at each added concentration. The results were given in table 1.
Precision
Precision was determined by injection six replicates of the standard preparations and analysed by the proposed method. A known concentration of pitavastatin was injected six times and corresponding peaks were recorded and % RSD was calculated. The results were shown in the table 2.
Figure 3. Chromatogram of Pitavastatin Formulation
Table 1. % Recovery data of Pitavastatin
Concentration (%)
Amount added (µg/ml)
Amount found
(µg/ml)
% Recovery Mean % Recovery
±SD n=3)
% RSD
50 50
50 50
50.26 50.24 49.97
100.53 100.49 99.95
100.32±0.32 0.32
100 100
100 100
99.52 101.04 100.83
99.52 101.04 100.83
100.46±0.821 0.817
150 150
150 150
149.62 149.55 149.89
99.75 99.70 99.93
99.79±0.119 0.100
Table 2. Precision method of proposed RP-HPLC method
Sample Retention Time Area
1 3.01 2559878
2 3.01 2548084
3 3.01 2556162
4 3.02 2544014
5 3.02 2545072
6 3.02 2546766
Average 3.01 2548020
Standard Deviation 0.005 4811.64
%RSD 0.001 0.001
Linearity
Linearity of proposed method was evaluated according to ICH guidelines. It was determined by preparing five different concentration levels of test solutions from the pitavastatin stock solution. 50 µL of each solution was injected into the system and peak area was recorded. A calibration curve was plotted from peak area and concentration .The linearity results were given in table 3.
Table 3. Linearity data
S.No Concentration ((µg/ml) Area
1 25 621939
2 50 1214361
3 75 1857006
4 100 2523945
5 125 3128422
6 150 3781999
Figure 4. Linearity curve
Table 4. Linearity regression data for calibration curve (n=6)
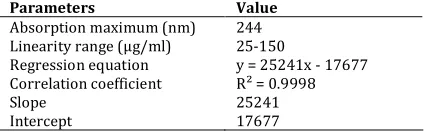
Parameters Value
Absorption maximum (nm) 244 Linearity range (µg/ml) 25-150
Regression equation y = 25241x - 17677 Correlation coefficient R² = 0.9998
Slope 25241
Robustness
The robustness was evaluated by assaying same sample by making small changes in the validation parameters such as mobile flow rate and column temperature. It was observed that the deliberate changes have no impact on the parameters. The results were given in table 4.
Table 5. Robustness Data
Forced Degradation studies
Forced degradation studies were performed to demonstrate the stability of the sample. Degradation
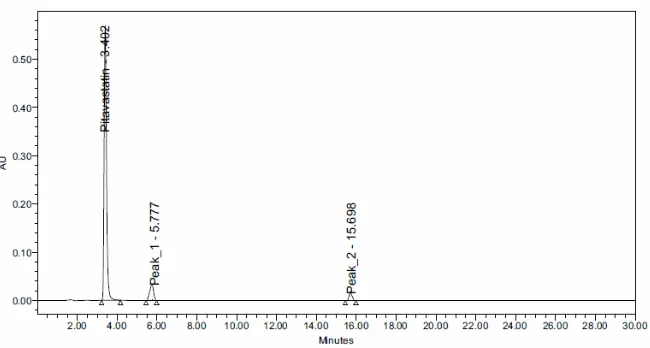
studies were carried out under conditions of hydrolysis, dry heat, oxidation, UV light and photolysis. Acid hydrolysis was performed by treating the drug with 2N HCl at room temperature for 24 hrs and it was showed degradation of pitavastatin with degraded products peak at retention time 1.04 (Fig. 2). For alkali degradation the drug was treated with 2N NaOH.
A chromatogram of base hydrolysis showed degradation of sample with degraded product peak at retention time 6.59 and 11.36(Fig. 3).Degradation studies under oxidative conditions were performed by heating the drug sample with 30% H2O2at 60 oC and degraded product peaks were observed. For the thermal degradation the powdered drug was exposed to heat at 105 o C for 6hrs. UV degradation studies were carried out for drug solutions by exposing solution in UV chamber at 100 watts for 7 days. All the degradation results were given in table 5.
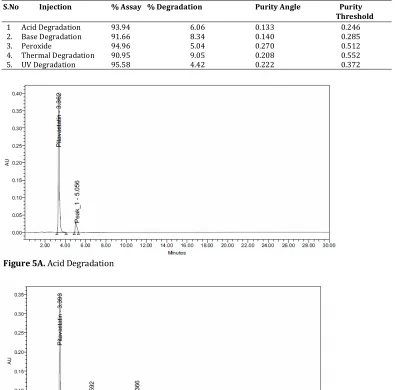
Table 5. Forced Degradation Studies
S.No Injection % Assay % Degradation Purity Angle Purity
Threshold
1 Acid Degradation 93.94 6.06 0.133 0.246
2. Base Degradation 91.66 8.34 0.140 0.285
3. Peroxide 94.96 5.04 0.270 0.512
4. Thermal Degradation 90.95 9.05 0.208 0.552
5. UV Degradation 95.58 4.42 0.222 0.372
Figure 5A. Acid Degradation
Figure 5C. Peroxide Degradation
Figure 5D. Thermal Degradation
Figure 5D. UV Degradation
CONCLUSION
The proposed study, a new stability- indicating RP-HPLC method has been developed for estimation of Pitavastatin in bulk and pharmaceutical dosage form. The developed method was validated and it was found to be simple, sensitive, precise, robust and it can be used for the routine analysis of Pitavastatin in both bulk and pharmaceutical dosage forms. The forced degradation studies were carried out in accordance
Acknowledgements
The authors are wish to thanks Spectrum Pharma Research laboratory for providing gift sample.
REFERENCES
1. K. Kajinami, N. Takekoshi and Y Saito (2003). Pitavastatin: Efficacy and Safety Profiles of a Novel Synthetic HMG CoA Reductase Inhibitor, Cardiovascular Drug Reviews, 21(3): 199-215.
2. R. Y. Mukhtar, J. Reid and J. P. Reckless (2005). Pitavastatin, International Journal of Clinical Practice, 59: 239-252. 3. H. Lennernäs and G. Fager (1997). Pharmacodynamics and
pharmacokinetics of the HMG-CoA reductase inhibitors- Similarities and differences, Clinical Pharmacokinetics, 32(5):403–425.
4. Istvan ES, Deisenhofer J(2001). Structural mechanism for statin inhibition of HMG-CoA reductase, Science. 292:1160– 1164.
5. Sweetman S.C., Martindale (2007). The complete dug reference, 5thEdition, The Pharmaceutical press: London,:1234.
6. Krishna M.V. and Sankar D.G (2007). Adaptation of Color Reactions for Spectrophotometric Determination of Pitavastatin Calcium in Bulk Drugs and in Pharmaceutical Formulations. EJ. Chem, 4:272-278.
7. Nanjappan S.K., Narayanan N., Jayabalan N et al., (2011). HPLC Determination of Pitavastatin Calcium in Pharmaceutical Dosage Form, Pharma. Ana. Acta,2: 119. 8. N. Satheesh Kumar and J. Baghyalakshmi (2007).
Determination and Quantification of Pitavastatin Calcium in
Tablet Dosage Formulation by HPTLC Method, Analytical Letters, 40(14): 2625-2632.
9. H. J. Panchal, B. N. Suhagia, N. J. Patel et al., (2008). A Simple and Sensitive HPTLC Method for Quantitative Analysis of Pitavastatin Calcium in Tablets, Journal of Planar Chromatography—Modern TLC, 21(4): 267-270.
10. Antony Raj Gomas, Pannala Raghu Ram, Nimmakayala Srinivas et al. (2010).Degradation Pathway for Pitavastatin Calcium by Validated Stability Indicating UPLC Method American Journal of Analytical Chemistry,2:83-90.
11. R. Nirogi, K. Mudigonda and V. Kandikere (2007). Chromatography–Mass Spectrometry Methods for the Quantitation of Statins in Biological Samples, Journal of Pharmaceutical and Biomedical Analysis, 44 (2):379-387. 12. ICH, “Stability Testing of New Drug Substances and Products”,
Q1A(R2), 2005.
13. ICH, “Photo stability Testing of New Drug Substances and Products,” Q1B, 2005.
14. S. W. Baertschi, K. Alsante and R. A. Reed,(2005). Pharmaceutical Stress Testing: Predicting Drug Degradation, Informa Healthcare.
15. ICH, “Validation of Analytical Procedures: Text and Methodology”, Q2(R1), 2005
*****
© 2013; AIZEON Publishers; All Rights Reserved