Estimation of Streamflow using Takagi-Sugeno Fuzzy
Rule-Based Model
Omer Burak Akgun
1, Elcin Kentel
1,
1
Middle East Technical University (METU), Civil Engineering Department,
Water Resources Laboratory, Ankara, Turkey
Corresponding author: [email protected]
Abstract
In this study, a tool is developed to estimate streamflow at Guvenc Basin, Ankara by using Takagi-Sugeno (TS) Fuzzy Rule-Based (RB) model. The model takes precipitation and runoff at time 𝑡 as predictor (input) and estimates the runoff at time 𝑡 + 1. The approach used to generate the TS RB model is based on density based clustering. Each cluster center is used to generate a fuzzy rule that represents the system behaviour. Satisfactory results are obtained especially after including the seasonal behaviour of streamflow time series into the model.
Keywords: clustering, Takagi-Sugeno Fuzzy Rule-Based model, streamflow estimation
Introduction
Sustainable and economic planning and management of water resources depend on the efficiency of forecasting and modelling of hydrological processes [1]. Due to its non-linear nature, streamflow forecasting is one of the most complicated tasks in hydrology [2]. Traditionally, streamflow is analysed using statistical approaches, which contain many uncertainties and require assumptions that make it computationally inefficient [3]. On the other hand, streamflow modelling and forecasting is carried out using physically based or conceptual models, or data-driven models [4]. The TS type rule-based model that is developed to estimate future runoff in this study is classified under data-driven models.
Due to its computational efficiency, flexibility and transparency, TS type fuzzy rule-based models have been widely used in modelling of complex systems. Having non-linear nature,
Volume 3, 2018, Pages 18–25
HIC 2018. 13th International Conference on Hydroinformatics
TS type fuzzy rule-based model is suitable for complex systems such as streamflow forecasting as well [5].
TS type rule-based models are based on the idea of clustering of input and output variables. Predictors are clustered such that each cluster center is a prototypical data point that exemplifies a characteristic behaviour of the system [7]. The output is obtained by using a linear function of the predictors for each fuzzy rule [6].
Clustering is dividing data into subgroups based on their similar features. One of the first density based clustering algorithms is suggested by Chiu [7] which is the modified form of the Mountain Method. In Chiu’s approach [7], similarities, which form clusters, are considered to be a function of distance among data points. In other words, inter-dependencies of dataset are taken into account while establishing clusters. In this method, each cluster center represents a fuzzy rule. In other words, fuzzy rules are obtained according to inter-dependencies of dataset [7]. Similar to many natural processes, influenced by both meteorological (such as temperature, precipitation) and catchment (such as soil type and land use) characteristics, streamflow is not a completely random process. Therefore, Chiu’s approach [7], which is based on inter-dependencies of data, is suitable for estimating future streamflow.
Method
In the following paragraphs, TS [6] fuzzy rule-based model and Chiu’s [7] clustering method is explained in detail. The TS fuzzy rule-based model consists of premises and consequents. Premises represent the membership functions of the fuzzy inputs. The consequents are the output of the model. For example, for two inputs, 𝑥 and 𝑦 and an output 𝑧, a fuzzy rule may look like: If 𝑥 is 𝐴
(
and 𝑦 is(
𝐵 then 𝑧 = 𝑚𝑥 + 𝑛𝑦 + 𝑐, where 𝑚, 𝑛 and 𝑐 are constants, 𝐴0 and𝐵
(
are fuzzy sets [10].In the Chiu’s approach [7], each data is treated as a potential cluster center. First, the potential of each data point is calculated using:
𝑃𝑖=
∑
𝑛 𝑒−𝛼7𝑥𝑖−𝑥𝑗72𝑗=1 (1a)
𝛼 = 4/𝑟=> (1b)
where, 𝑃𝑖 refers to the potential of 𝑖th data, 𝑟𝑎 is user defined positive constant that specifies the radius of a neighborhood and 𝑛 is the number of data points. The point which has the highest potential is set as the first cluster center. After determining the first cluster center, potentials are updated using:
𝑃𝑖← 𝑃𝑖− 𝑃1𝑒−𝛽7𝑥𝑖−𝑥𝑗72 (2a)
𝛽 = 4/𝑟B> (2b)
where, 𝑟𝑏is a user defined positive constant that specifies the neighborhood that will have measurable reductions in potential and 𝑃1is the potential of the first cluster. The procedure continues until the highest updated potential drops below a certain threshold set by the modeler.
In the TS type rule-based model, each cluster center represents a fuzzy rule. The membership functions for these rules are defined exponentially using:
𝜇𝑖𝑗 = 𝑒−𝛼7𝑥𝑖−𝑥𝑗72
(3)
where 𝜇𝑖𝑗 represents the membership of 𝑖th data for 𝑗th cluster. Each cluster center is used as the basis of a rule that represents the behaviour of the system [7]. In this study, TS type rules that are capable of representing the complex behaviour of the rainfall-runoff process are constructed and observed data is used to adjust the constants of the consequences.
While analyzing hydrological time series, cyclic behaviour and inter-dependent nature of the data set is taken into account as well. The seasonal behaviour of the time series is modelled through addition of two Fourier Harmonics into the inputs. In Fourier harmonics analysis, cyclic behaviour of time is represented as the sum of sinusoidal components [8]. The monthly harmonics used in this study are:
∑
E
𝑎𝑘𝑐𝑜𝑠I
2𝜋𝑘𝑡12
K
+ 𝑏𝑘𝑠𝑖𝑛I
2𝜋𝑘𝑡12
KL
2𝑘=1
(4)
where, 𝑡 is the time in month, 𝑎𝑘 and 𝑏𝑘
are
coefficients and 𝑘 refers to number of Fourier Harmonics. Monthly runoff values are estimated using historical rainfall and runoff as inputs through a TS type rule-based model. Satisfactory performances are obtained for both the calibration and the verification stages. Improvement in performance is observed when seasonality is considered in the TS model.Case Study
Monthly precipitation and runoff data for Guvenc Basin from October 1987 to September 1996 are used in this study. The Guvenc Basin is located at 42⁰08’10” N and 32⁰45’15” E, and has a drainage area of approximately 17 km2. Five rain gauges and a stream gauge are available within the basin as shown in Fig. 1. The precipitation values used in this study are averages of the recorded values from these five rain gauges. Data available to us consists of 120 months; however, for the last data (September 1994) runoff at time 𝑡 + 1 is not available. As a result, out of 119 input patterns that are available from October 1987 to August 1996, 100 of them are used for the calibration and remaining 19 are used for the validation purposes. Precipitation and runoff observations at time 𝑡 are used as input and runoff at time 𝑡 + 1 is used as the output to train the fuzzy rule based model. Training and validation data are randomly selected from the available dataset by considering robust nature of approach against sampling [8, 9, 11, 13].
Availability of data has vital importance on success of the hydrological model. However, commonly hydrological analysis and models have to be done with insufficient number of data. In this study, TS RB model based on density based clustering is developed and validated with a limited number of input data patterns. Because of this, certain amount of disagreement between measured and predicted data is observed. The results are still acceptable, but may be improved if longer precipitation and runoff data is used or other parameters such as temperature and snow are included in the model [4, 12].
Fig. 1. Rain gauges and the stream gage in Guvenc Basin [13]
Results and Discussion
In this study, fitness and forecasting skills of data-driven TS fuzzy rule based system based on cluster estimation for a hydrological processes is analyzed. User defined positive constant
𝑟=> and 𝑟
B> are taken as 0.5 and 3(𝑟=>) 2⁄ , respectively. Effects of seasonality and the number of fuzzy rules on the prediction ability of the model are investigated.
Analysis 1: Effect of seasonality
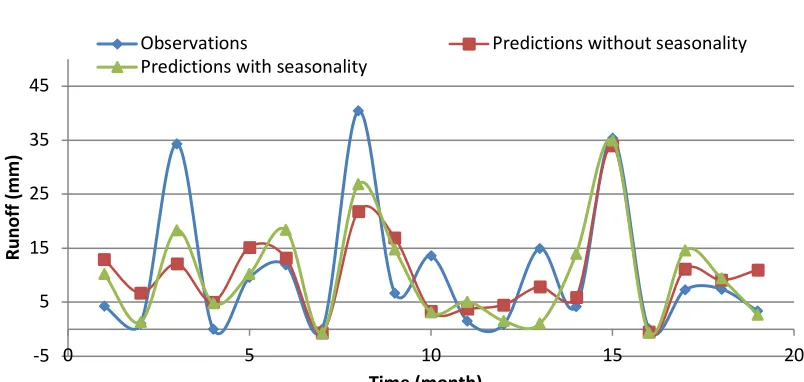
For efficient water resources management, seasonal variation of streamflow should not be neglected. The streamflow often shows cyclic behaviour per annum. Therefore, to express cyclic behaviour of streamflow, two Fourier Harmonics are used in the calculations (Eqn. 4). To demonstrate the effect of consideration of the cyclic behaviour of streamflow on model’s fitting and forecasting skills, calculations are conducted with and without seasonality and results are compared. The results obtained for training and validation stages are given in Table 1 and Fig. 2. In both models (i.e. with and without seasonality) three cluster centers;
thus, three fuzzy rules are used. Cluster centers obtained are 5.3 mm, 0.04 mm and 13.43 mm for the runoff. The results indicate that the TS fuzzy model with three rules gives acceptable estimates of future streamflow. As can be seen from Table 1, the validation performance is better than the training performance. This is mainly due to the presence of an extreme value (i.e. 45 mm runoff) in the training data set. Three cluster centers identified do not represent this extreme value appropriately.
When seasonal (cyclic) behaviour of streamflow is considered, model performance improved. The seasonality affects fitting and forecasting skills in different extents. Thus, when the seasonality is included into the model, the fitting skill of the model became better than the forecasting skill contrary to the predictions without seasonality parameter in it (see Table 1 and Fig. 2).
Table 1. The model performance and the seasonality impact on it
Training Data (Fitting Skill) Validation Data (Forecasting Skill) Prediction w/o
seasonality
Prediction w/ seasonality
Prediction w/o seasonality
Prediction w/ seasonality
Cor 0.67 0.82 0.73 0.79
R2 0.69 0.81 0.72 0.78
NS
E 0.48 0.68 0.53 0.62
Fig. 2. Forecasting skill of the model and seasonality impact on it
Analysis 2: Effect of the number of fuzzy rules
-5 5 15 25 35 45
0 5 10 15 20
Runof
f (
m
m
)
Time (month)
Observations Predictions without seasonality
Predictions with seasonality
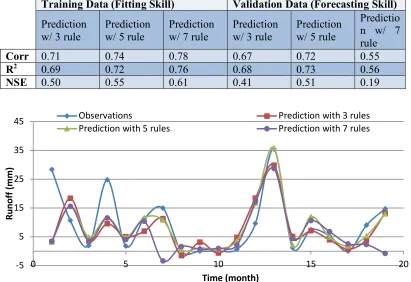
Each cluster center is a prototypical data point that exemplifies a characteristic behaviour of the system. Thus, each cluster center is translated into a fuzzy rule in this study. Yet, the question arises: How many fuzzy rule (cluster center) should be considered for streamflow modelling in this study? Although Yager and Filev [15] and Chiu [7] proposed procedures for the identification of the number of cluster centers, the selection is a problem specific challenge and requires trial-and-error runs. In the current study, three user defined number of cluster centers (fuzzy rules) is used in the TS model. Comparisons using correlation, R2 and NSE (Nash Sutcliffe Efficiency) values of predictions with 3, 5 and 7 rules are provided in Table 2 and Fig. 3. It is observable that the fitting skill of the model has improved with increasing number of rules. However, it can be noted that although the forecasting skill of the model has increased when number of clusters is increased to five the same improvement was not observed going from five to seven cluster centers. This might be due to the fact that sixth and seventh cluster centers are only applicable for a limited number of data. To conclude, based on these two analysis, the model with five cluster centers and where seasonality is represented by Fourier Harmonics resulted in the best predictions.
Table 2. The model performance and impact of the number of rules on it
Training Data (Fitting Skill) Validation Data (Forecasting Skill)
Prediction w/ 3 rule
Prediction w/ 5 rule
Prediction w/ 7 rule
Prediction w/ 3 rule
Prediction w/ 5 rule
Predictio n w/ 7 rule
Corr 0.71 0.74 0.78 0.67 0.72 0.55
R2 0.69 0.72 0.76 0.68 0.73 0.56
NSE 0.50 0.55 0.61 0.41 0.51 0.19
Fig. 3. Forecasting skill of the model and impact of the number of fuzzy rules on it
-5 5 15 25 35 45
0 5 10 15 20
Runof
f (
m
m
)
Time (month)
Observations Prediction with 3 rules
Prediction with 5 rules Prediction with 7 rules
Conclusions
In this study, TS RB model is developed to estimate streamflow at Guvenc Basin, Ankara and the effect of seasonality and the number of fuzzy rules on the model’s performance are investigated. Out of 119 total input patterns, 100 and 19 are used for training and validation, respectively. The TS RB model with three rules (i.e. three cluster centers) is constructed to estimate runoff using previous months’ runoff and precipitation data as inputs. Hence, the model has two input and one output. Since the model is completely data driven, no prior knowledge or assumptions are needed. Due to the clustering algorithm, cluster centers are not chosen close to each other. Thus, each fuzzy rule represents a different portion/behaviour of the data. Due to nonlinear nature of Fuzzy RB systems and data-driven clustering, the complex relation between runoff and precipitation is sufficiently represented with no mathematical complexities.
In order to include the seasonal behaviour of streamflow into the model, two Fourier Harmonics are used. Inclusion of harmonics enhances the results up to 15% for training and 10% for validation for all the performance measures, which is a significant improvement. Such increase demonstrates that the seasonal behaviour is represented appropriately using Fourier Harmonics.
The second analysis was carried out to observe the effect of the number of fuzzy rules on the model’s performance. To investigate the effect of the number of fuzzy rules, three different models with 3, 5 and 7 rules are constructed. As the number of the fuzzy rules increases the model estimates the streamflow better in the training stage, because each cluster center represents the values in that cluster better. However, for validation data, increasing the number of cluster centers above five do not increase the model performance. This might be due to limited number of data. Due to data limitations, some of the validation data may not be properly represented in the training set.
The TS RB system based on cluster estimation is constructed to model streamflow and precipitation relations and forecast the streamflow. Long historic data of runoff and precipitation and inclusion of other input parameters such as temperature and snow data is expected to improve these results. Although there is some disagreement between observed and predict data, the results are satisfactory based on NSE values, especially for models with three and five cluster centers.
Acknowledgement
Precipitation and runoff data for this study is provided by the Soil, Fertilizer, and Water Resources Research Institute of the Ministry of Agriculture and Rural Affairs.
References
[1] Huang, S., Chang, J., Huang, Q., & Chen, Y. (2014). Monthly streamflow prediction using modified EMD-based support vector machine. Journal of Hydrology, 511, 764-775. [2] Tongal, H., & Booij, M. J. (2016). A comparison of nonlinear stochastic self-exciting
threshold autoregressive and chaotic k-nearest neighbor models in daily streamflow forecasting. Water resources management, 30(4), 1515-1531.
[3] Kidson, R., & Richards, K. S. (2005). Flood frequency analysis: assumptions and alternatives. Progress in Physical Geography, 29(3), 392-410.
[4] Kentel, E. (2009). Estimation of river flow by artificial neural networks and identification of input vectors susceptible to producing unreliable flow estimates. Journal of hydrology, 375(3-4), 481-488.
[5] Angelov, P. (2004). An approach for fuzzy rule-base adaptation using on-line clustering. International Journal of Approximate Reasoning, 35(3), 275-289.
[6] Takagi, T., & Sugeno, M. (1985). Fuzzy identification of systems and its applications to modeling and control. IEEE transactions on systems, man, and cybernetics, (1), 116-132. [7] Chiu, S. L. (1994). Fuzzy model identification based on cluster estimation. Journal of
Intelligent & fuzzy systems, 2(3), 267-278.
[8] Bloomfield, P. (2004). Fourier analysis of time series: an introduction, John Wiley & Sons, New York, USA.
[9] Salas J. D., Delleur W., Yevjevich V., and Lane W.L. (1980). Applied modeling of
hydrologic time series, Chelsea, Michigan, U.S.A.
[10] Ross, T. J. (2004). Fuzzy logic with engineering applications. John Wiley & Sons, Chichester, West Sussex, England
[11] Turan, I.D. and Dengiz O. (2015). Cok kriterli degerlendirme ile Ankara Guvenc Havzasında erozyon risk tahminlenmesi (Risk assessment of land sliding by multi-criteria evaluation in Guvenc Basin, Ankara). Tarım Bilimleri Dergisi (Journal of Agricultural
Sciences), 23, 285-297 (in Turkish).
[12] Beven, K. J. (2011). Rainfall-runoff modelling: the primer. John Wiley & Sons, Chichester, West Sussex, UK
[13] Karas E. (2005). Kucukelmali ve Guvenc Havzalarinin su ve sediment verimlerine gore surdurulebilir yonetimi (Sustainable management of Kucukelmalı ve Guvenc Basin concerning water and sedimentation efficiency) (Doctoral dissertation). Graduate School of Natural and Applied Sciences, Ankara University, Ankara, Turkey.
[14] Baldwin, C. K., & Lall, U. (1999). Seasonality of streamflow: the upper Mississippi River. Water Resources Research, 35(4), 1143-1154.
[15] Yager, R. R., & Filev, D. P. (1994). Approximate clustering via the mountain method. IEEE Transactions on Systems, Man, and Cybernetics, 24(8), 1279-1284.
![Fig. 1. Rain gauges and the stream gage in Guvenc Basin [13]](https://thumb-us.123doks.com/thumbv2/123dok_us/8878240.1818143/4.612.104.270.232.432/fig-rain-gauges-stream-gage-guvenc-basin.webp)