Ojelade et al. / Advances in Agricultural Science 6 (2018), 04: 01-11
A R T I C L E I N F O
A B S T R A C T
Article history:
Received: March 03, 2018 Revised: June 18, 2018 Accepted: July 20, 2018 Available online: December 15, 2018
A study was conducted at Teaching and Research farm of Bayero University Kano, Nigeria, to determine the combining ability of 48 single cross hybrids of groundnut which were generated using a 6 × 8 line by tester mating design. The crosses were laid out in an 8 × 6 randomized Incomplete Block Design. Data were collected on phenological and agronomic traits. The results revealed significant variability for line, tester, and line × tester effects for some of the studied traits. Non-additive gene action was more than additive gene action in the inheritance of majority of studied traits. IGG-X 4 had the best GCA for pod weight among the set of genotype studied. The cross, ICGV-SM 07539 x ICG 3584 had highest SCA value for pod dry weight, number of pod per plant, number of seed per pod and number of matured pods. Therefore, these traits could be improved by selection of crosses with high SCA effects. Furthermore, parents with good per se performance and significant GCA effects for some traits can also be selected as testers for future breeding programs. The study indicated the importance of yield components like number of pods per plant and pod dry weight in breeding programs intended to improve yield of groundnut genotypes.
© 2018 Shaibu et al. This work is licensed under a Creative Commons Attribution-NonCommercial 4.0 International License.
Keywords:
Combining ability Gene action Groundnut Yield components
* Corresponding Author;
E. Mail:
Introduction
roundnut (Arachis hypogaea L.) also known as peanut is a member of the genus Arachis in the family leguminosae (Fabacaea) which has replaced the traditional bambara groundnut (Vigna subterranean) in many areas of the country (Ashley, 1993). It is cultivated in 108 countries on about 22.2 million hectares, of which 13.69 million ha are in Asia (India 8 million ha; China 3.84millionha), 7.39 million ha in Sub-Saharan Africa, and 0.7 million ha in Central and South America. The uses of groundnut are diverse; all parts of the plant can be used. The nut
(kernel) is a rich source of edible oil, containing 36 to 54% oil and 25 to 32% protein (Patil et al., 2017). It is part of the mainstay to livelihood of millions of small-holder farmers residing in semi-arid tropic (SAT) regions of the world. The largest producers of groundnut are China and India, followed by the USA. In Africa, Nigeria is the largest producers of groundnut (2.96 million tons, 7.67%) followed by the United Republic of Tanzania (0.65 million tons, 1.69%) (Upadhyaya etal., 2014).
There was a substantial increase in global groundnut production by about 5 m tons in 2013, taking the
G
Volume 6 (2018), Issue 04, 12-18
Journal homepage: www.aaasjournal.org
ISSN: 2588-3801
Combining Ability Analysis for Growth and Yield Components of
Groundnut (
Arachis hypogaea
L.) in Sudan Savannah
Abdulwahab Saliu Shaibu
1*, Faiza Yusuf Mustapha
1, Babu N Motagi
21 Department of Agronomy, Bayero University, Kano, Nigeria.
2 Department of Genetics and Plant Breeding, Agriculture College, University of Agricultural Science, Dharwad, India.
production to 45 m tons (Janila et al., 2016). In the last decade, 2004–2013, global groundnut production increased by 24%, which was contributed by 7% and 16% increase in groundnut area and yield, respectively. The projected global demand for groundnut and its related products is expected to increase, this therefore, necessitate the need to further increase production and productivity to meet the global demand (Janila et al., 2016). Improved groundnut varieties resulting from genetic improvement have contributed to this enhanced production and productivity, and also met the needs of the producers, processors, and consumers. The yield productivity increase varied across different growing regions. Groundnut breeding programs have extensively used different groundnut collections with accurate phenotyping tools for selecting plants/progenies with desirable traits (Janila et al., 2013).
Recently, farmers have been facing problems of low yield due to the usage of local varieties. To cope with these problems ICRISAT, Nigeria has been involved in breeding groundnut varieties that will yield a bomber harvest in terms of the pods and fodders. In order to develop high yielding varieties, there is a need to determine the combining ability of genotypes and identify transgressive segregants. The information on combining ability status of genotypes will give an indication as how well they combine with a given genotype to produce potential and productive populations and also on the nature of gene action involved. They are different methods of estimating combining ability among which line by tester (Sprague and Tatum, 1942) have been used (Patil et al., 2017). A desirable tester may be defined as the one that combines the greatest simplicity in use with the maximum information on the performance expected from the tester lines when used in other combinations or grown in other environment. Narrow genetic base tester contribute more to line x tester interaction than those of a heterogeneous one. The objectives of this research was to assess the agronomic performance of some groundnut single cross hybrids and determine their combining ability for some agronomic traits. Identified testers can be used for further breeding programs as parents for generating crosses and improving on adapted varieties.
Materials and Methods
The experiment was conducted at the Teaching and Research farm of Department of Agronomy, Bayero University Kano, (Latitude 11o58”N and Longitude
8o25”E). The experiment consist of 48 single cross
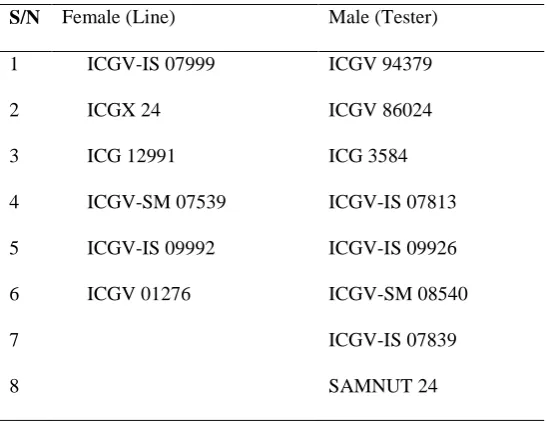
hybrids that were generated using a 6 × 8 (Table 1) line by tester mating design. The crosses were generated at the ICRISAT Kano Station in 2016 wet season using the crossing rings facilities. The testers have resistance to foliar diseases and drought while some of the lines are high yielding in the agro-ecology but susceptible to foliar diseases.
The 48 crosses were evaluated in the 2017 dry season using an 8 × 6 randomized Incomplete Block Design. The number of rows per crosses was based on the number of seeds available. Ridges was made into 75 cm apart. Seeds were sown by dibbling at the rate of one seed per hole for the male, two seeds per hole for the female and one seed each per hole for the F1 at intra-row spacing of 15 cm.
Data were recorded on some agronomic traits such as days to 50% emergence, days to 50% flowering, number of pods per plant, pod weight, number of seeds per pod and grain yield. Analyses of variance (ANOVA) were performed using SAS 9.4 (SAS Institute Inc., Cary, NC). Genotype was considered as fixed effect while replications was considered as random factors. The line × tester analysis was performed using SAS software.
Results
The mean square analysis (Table 2) shows highly significant differences among the lines for days to emergence and pod dry weight. Highly significant difference in testers was only obtained in days to emergence. There were highly significant differences for all the characters in the hybrids (line x tester) except for seeds per pod and number of matured pods per plant. The significant mean squares of line × tester indicated the importance of specific combining ability. The mean squares of testers was of a larger magnitude for days to emergence only while mean squares of lines was of larger magnitude for pod weight and number of pods per plant. Line × tester mean squares was high for days to flowering and number of matured pods.
and 12 days, respectively. For the testers, ICG 3584 took more days to emerge and the least days of emergence within the testers was recorded from ICGV-IS-07839, with average of 15 and 12 days, respectively. The days to 50 % flowering was much later in line ICGV-SM 07539 and tester ICGV 86024, whereas in line ICG 12991 and tester ICGV-IS-09926 the flowers emerged early. The highest pod weight was recorded from line IGX 24 (430.26 kg ha-1) and tester ICGV-IS 07839 (392.86 kgha -1), while line ICGV 01276 (123.33 kg ha-1) and tester
ICGV-SM 08540 (240.18 kgha-1) had the least pod
weight. Line ICG X 24 and tester ICGV-IS-07839 had the highest number of pods, however the least number of
pods was recorded from line ICGV-SM 07539 and tester ICGV-SM 08540. The number of matured pods was produced more by line ICGV-SM 07539 and tester ICG 3584, while line ICGV 01276 and tester ICGV-SM 08540 had the least number of matured pods.
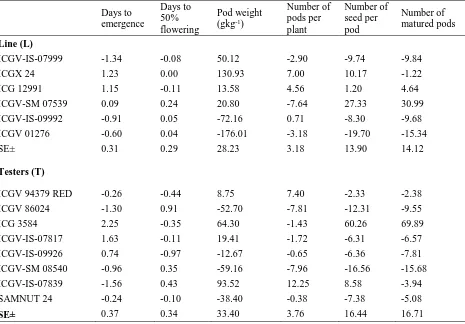
General combining ability (GCA) effects of lines x tester for growth and yield in groundnut are presented in Table 4. ICGX 24 had a high GCA for days to emergence and pod dry weight. ICGV 01276 had a negative GCA for pod dry weight and number of matured pods. ICGV-SM 07539 had the highest GCA for number of seed per pod and matured pod. ICG 3584 had a low GCA for days to
Table 1. List of genotype used for line x tester crossing design
S/N Female (Line) Male (Tester)
1 ICGV-IS 07999 ICGV 94379
2 ICGX 24 ICGV 86024
3 ICG 12991 ICG 3584
4 ICGV-SM 07539 ICGV-IS 07813
5 ICGV-IS 09992 ICGV-IS 09926
6 ICGV 01276 ICGV-SM 08540
7 ICGV-IS 07839
8 SAMNUT 24
Table 2. Analysis of variance for line x tester for yield and its component characters in groundnut
Source D.F Days to
emergence
Days to 50% flowering
Pod weight (gkg-1)
Number of pods per plant
Number of seed per pod
Number of matured pods
Rep 2 0.15 7.04 17369 678.79* 4859.01 3751.98
Line 5 19.22** 0.55 185180.77** 614.49 2100.3 1901.63
Tester 7 25.68** 3.57 35474.7 462.72 3510.36 3137.61
Line x tester 35 13.21** 7.33** 71230.60** 547.37** 6676.15 5751.37
Error 79 2.9 2.39 23111 290.74 5581.09 5808
Table 3. Mean performance for growth and yield components in groundnut
Line/tester Days to
emergence
Days to 50% flowering
Pod weight (gkg-1)
Number of pods per plant
Number of seed per pod
Number of matured pods
Lines
ICGV-IS-07999 12.00 26.00 349.46 32.00 45.00 26.00
ICGX 24 14.00 26.00 430.26 42.00 65.00 35.00
ICG 12991 14.00 26.00 312.92 40.00 56.00 41.00
ICGV-SM 07539 14.00 26.00 320.14 28.00 82.00 67.00
ICGV-IS-09992 12.00 26.00 227.17 36.00 46.00 26.00
ICGV 01276 13.00 26.00 123.33 32.00 35.00 21.00
SE± 1.70 1.55 152.02 17.05 74.71 76.21
Tester
ICGV 94379 RED 13.00 25.00 308.09 43.00 52.00 34.00
ICGV 86024 12.00 27.00 246.64 27.00 42.00 27.00
ICG 3584 15.00 26.00 363.64 34.00 115.00 106.00
ICGV-IS-07817 15.00 26.00 318.75 34.00 48.00 29.00
ICGV-IS-09926 14.00 25.00 286.67 35.00 48.00 28.00
ICGV-SM 08540 12.00 27.00 240.18 27.00 38.00 20.00
ICGV-IS-07839 12.00 26.00 392.86 48.00 63.00 32.00
SAMNUT 24 13.00 26.00 260.94 35.00 47.00 31.00
SE± 1.70 1.55 152.02 17.05 74.71 76.21
Table 4. General combining ability effects of lines and testers for growth and yield in groundnut
Days to emergence
Days to 50% flowering
Pod weight (gkg-1)
Number of pods per plant
Number of seed per pod
Number of matured pods
Line (L)
ICGV-IS-07999 -1.34 -0.08 50.12 -2.90 -9.74 -9.84
ICGX 24 1.23 0.00 130.93 7.00 10.17 -1.22
ICG 12991 1.15 -0.11 13.58 4.56 1.20 4.64
ICGV-SM 07539 0.09 0.24 20.80 -7.64 27.33 30.99
ICGV-IS-09992 -0.91 0.05 -72.16 0.71 -8.30 -9.68
ICGV 01276 -0.60 0.04 -176.01 -3.18 -19.70 -15.34
SE± 0.31 0.29 28.23 3.18 13.90 14.12
Testers (T)
ICGV 94379 RED -0.26 -0.44 8.75 7.40 -2.33 -2.38
ICGV 86024 -1.30 0.91 -52.70 -7.81 -12.31 -9.55
ICG 3584 2.25 -0.35 64.30 -1.43 60.26 69.89
ICGV-IS-07817 1.63 -0.11 19.41 -1.72 -6.31 -6.57
ICGV-IS-09926 0.74 -0.97 -12.67 -0.65 -6.36 -7.81
ICGV-SM 08540 -0.96 0.35 -59.16 -7.96 -16.56 -15.68
ICGV-IS-07839 -1.56 0.43 93.52 12.25 8.58 -3.94
SAMNUT 24 -0.24 -0.10 -38.40 -0.38 -7.38 -5.08
emergence and a high GCA for number of seed per pod and number of matured pods. ICGV-SM 08540 had a negative GCA for pod weight, number of pods per plant, number of seed per pod and number of matured pods. ICGV-IS-07839 had the highest GCA for pod dry weight and number of pods per plant.
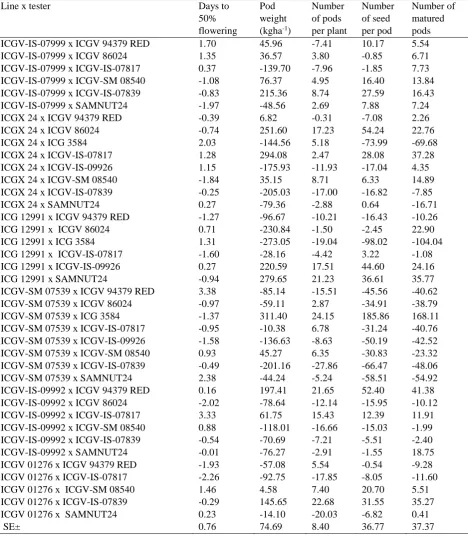
The results of specific combining ability (SCA) effects of lines x tester (Table 5) shows that ICGX 24 x ICGV-IS-07817 had high SCA and ICGX x ICGV-IS-09926 had the lowest SCA for days to emergence. ICGV-SM 07539 x ICG 3584 had the highest SCA and ICG 12991 x ICG 3584 had the lowest SCA for pod dry weight. Based on number of pods per plant, ICGV-SM 07539 x ICG 3584 recorded the highest SCA whereas ICGV-SM
Table 5. Specific combining ability effects of lines and testers for growth and yield in groundnut
Line x tester Days to
50% flowering
Pod weight (kgha-1)
Number of pods per plant
Number of seed per pod
Number of matured pods
ICGV-IS-07999 x ICGV 94379 RED 1.70 45.96 -7.41 10.17 5.54
ICGV-IS-07999 x ICGV 86024 1.35 36.57 3.80 -0.85 6.71
ICGV-IS-07999 x ICGV-IS-07817 0.37 -139.70 -7.96 -1.85 7.73
ICGV-IS-07999 x ICGV-SM 08540 -1.08 76.37 4.95 16.40 13.84
ICGV-IS-07999 x ICGV-IS-07839 -0.83 215.36 8.74 27.59 16.43
ICGV-IS-07999 x SAMNUT24 -1.97 -48.56 2.69 7.88 7.24
ICGX 24 x ICGV 94379 RED -0.39 6.82 -0.31 -7.08 2.26
ICGX 24 x ICGV 86024 -0.74 251.60 17.23 54.24 22.76
ICGX 24 x ICG 3584 2.03 -144.56 5.18 -73.99 -69.68
ICGX 24 x ICGV-IS-07817 1.28 294.08 2.47 28.08 37.28
ICGX 24 x ICGV-IS-09926 1.15 -175.93 -11.93 -17.04 4.35
ICGX 24 x ICGV-SM 08540 -1.84 35.15 8.71 6.33 14.89
ICGX 24 x ICGV-IS-07839 -0.25 -205.03 -17.00 -16.82 -7.85
ICGX 24 x SAMNUT24 0.27 -79.36 -2.88 0.64 -16.71
ICG 12991 x ICGV 94379 RED -1.27 -96.67 -10.21 -16.43 -10.26
ICG 12991 x ICGV 86024 0.71 -230.84 -1.50 -2.45 22.90
ICG 12991 x ICG 3584 1.31 -273.05 -19.04 -98.02 -104.04
ICG 12991 x ICGV-IS-07817 -1.60 -28.16 -4.42 3.22 -1.08
ICG 12991 x ICGV-IS-09926 0.27 220.59 17.51 44.60 24.16
ICG 12991 x SAMNUT24 -0.94 279.65 21.23 36.61 35.77
ICGV-SM 07539 x ICGV 94379 RED 3.38 -85.14 -15.51 -45.56 -40.62
ICGV-SM 07539 x ICGV 86024 -0.97 -59.11 2.87 -34.91 -38.79
ICGV-SM 07539 x ICG 3584 -1.37 311.40 24.15 185.86 168.11
ICGV-SM 07539 x ICGV-IS-07817 -0.95 -10.38 6.78 -31.24 -40.76
ICGV-SM 07539 x ICGV-IS-09926 -1.58 -136.63 -8.63 -50.19 -42.52
ICGV-SM 07539 x ICGV-SM 08540 0.93 45.27 6.35 -30.83 -23.32
ICGV-SM 07539 x ICGV-IS-07839 -0.49 -201.16 -27.86 -66.47 -48.06
ICGV-SM 07539 x SAMNUT24 2.38 -44.24 -5.24 -58.51 -54.92
ICGV-IS-09992 x ICGV 94379 RED 0.16 197.41 21.65 52.40 41.38
ICGV-IS-09992 x ICGV 86024 -2.02 -78.64 -12.14 -15.95 -10.12
ICGV-IS-09992 x ICGV-IS-07817 3.33 61.75 15.43 12.39 11.91
ICGV-IS-09992 x ICGV-SM 08540 0.88 -118.01 -16.66 -15.03 -1.99
ICGV-IS-09992 x ICGV-IS-07839 -0.54 -70.69 -7.21 -5.51 -2.40
ICGV-IS-09992 x SAMNUT24 -0.01 -76.27 -2.91 -1.55 18.75
ICGV 01276 x ICGV 94379 RED -1.93 -57.08 5.54 -0.54 -9.28
ICGV 01276 x ICGV-IS-07817 -2.26 -92.75 -17.85 -8.05 -11.60
ICGV 01276 x ICGV-SM 08540 1.46 4.58 7.40 20.70 5.51
ICGV 01276 x ICGV-IS-07839 -0.29 145.65 22.68 31.55 35.27
ICGV 01276 x SAMNUT24 0.23 -14.10 -20.03 -6.82 0.41
07539 x ICGV-IS-07839 had the lowest SCA. For number of seeds per pod ICGV-SM 07539 x ICG 3584 had the highest SCA and ICG 12991 x ICG 3584 recorded the lowest SCA value. The highest SCA for pod weight was observed in ICGV-SM 07539 x ICG 3584 (311) followed by ICGX 24 x ICGV-IS-07817 (294) and ICG 12991 x SAMNUT24 (279).
Discussion
The results reveal significant different for almost all the parameters tested, indicating that the performance of such breeding lines were not similar based on these parameters. The analysis of variance for combining ability showed that variance due to lines was highly significant for days to emergence and pod dry weight whereas testers showed significant differences for days to emergence. The variance due to lines × testers was highly significant for days to emergence, pod dry weight and number of pods per plant. Patil et al. (2017) reported significant variability in GCA and SCA effect for pod weight. Among lines, IGGX 24 recorded high GCA for pod weight ICGV-SM 07539 had a high and positive GCA for number of seed per pod and matured pod and ICGV-IS-07839 had a high and positive GCA for pod weight and number of pods per plant. Some genotypes such as ICGV 01276 had negative GCA for the yield related characters. Patil et al. (2017) also reported positive GCA for pod weight of groundnut. Parents having high GCA effects could be useful as, the GCA effect is due to additive gene action and is fixable. The variance due to specific combining ability was greater than the variance due to general combining ability for number of matured pods. This indicates the predominance of non - additive gene action for this trait. Hence, this trait could be improved by selection of crosses with high SCA effects. These results were in accordance with the findings of Savitramma et al. (2010) and Prabhu et al. (2014) for total number of pods. The pre-dominance of SCA variance was also reported for total number of seeds (Rose Mary Francies and Ramalingam, 1999; Rudraswamy et al., 2001) and number of matured pods Mohan et al. (2012). Vindhiya Varman (2000) and Rudraswamy et al. (2001) reported higher SCA than GCA effects for pod yield. However, in this study, the GCA effect was higher than the SCA effects. The single cross hybrid, ICGV-SM 07539 x ICG 3584 shows highest SCA value for pod weight, number
of pod per plant, number of seed per pod and number of matured pods. The nature of gene action is an important criterion to select the crosses for pedigree breeding. Crosses with additive type of gene action are desirable as this facilitates early generation selection (Prabhu et al., 2014). However, in this study, none of the crosses was found desirable simultaneously for all the characters.
Conclusion
Based on the results obtained from this study, it can be concluded that all the crosses were varied with respect to all observed traits, ICGV-SM 07539 x ICG 3584 recorded the highest pod weight, number of pod per plant, number of seed per pod, and number of matured pod. Crosses with high SCA effects can be used to improve yield related traits and are more suitable for generation advancement while lines with higher GCA effects can be selected as tester’s in future breeding program. The important criterion of selection is the GCA of parents and ICG X 24 had the highest GCA for pod weight. The parents with good per se performance and significant GCA effects for some yield related traits are considered as good general combiners for deriving desirable transgressive segregants in self-pollinated crops such as groundnut.
References
Ashley, J. 1993. Drought and Crop Adaptation, in: Dry Land Farming in Africa(Rowland, R.J. Ed). Macmillan Education Ltd, London and Basingstoke.
Francies, R.M. and Ramalingam, S.R. 1999. Combining ability in groundnut. Legume Research, 22 (4): 267-269.
Janila, P., Variath, M. T., Pandey, M. K., Desmae, H., Motagi, B. N., Okori, P., Manohar, S. S., Rathnakumar, A. L., Radhakrishnan, T., Liao, B. and Varshney, R. K., 2016. Genomic Tools in Groundnut Breeding Program: Status and Perspectives. Front. Plant Sci. 7:289. doi: 10.3389/fpls.2016.00289.
Janila, P., Venuprasad, R., Abhishek, R., Aruna U., Reddy, K.R., Waliyar, F. and Nigam S. N. 2013. Genetic analysis of resistance to late leaf spot in interspecific
groundnuts. Euphytica.
Misari, S. M., Harkness, C. and Fowler, A. M. 1980. Groundnut Production, Utilization, Research Problems and Further Research Needs in Nigeria. International Workshop on Groundnuts, Patancheru, India, 1980, pp. 264-273. ICRISAT.
Mohan, K., Vasanthi, R. P., Hari Prasad Reddy and Bhaskar Reddy, 2012. Genetic variability studies for yield attributes and resistance to foliar diseases in
groundnut. Inter. J. Appl.
Biol. Pharmaceut. Technol., 390-394.
Patil, K.S., Kenchanagoudar, P.V. and Kulmi, M.R.M. 2017. Combining Ability Studies for Yield and Its Component Traits in Groundnut (Arachis hypogaea L.). Int. J. Curr. Microbiol. App. Sci. 6(8): 336-342
Prabhu, R., Manivannan, N., Mothilal, A. and Ibrahim, S.M. 2014. Combining ability analysis for yield and its component traits in groundnut (Arachis hypogaea L.). Electronic Journal of Plant Breeding, 5(1): 30-37
Rudraswamy, P., Nehru, S.D. and Kulkarni, R.S. 2001. Combining ability studies on groundnut. Mysore J. Agric. Sci., 35(3): 193-202.
Savitramma, D. L., Rekha, D. and Soumya, H. C. 2010. Combining ability studies for growth and yield related traits in groundnut (Arachis hypogaea L). Electronic J. Pl. Breed., 1(4): 1010- 1015.
Sprague, G.F. and Tatum, L.A. 1942. General versus specific combining Ability in single crosses of Corn. Journal of the American Society of Agronomy. 34: 923-932.
Upadhyaya, H. D., Dwivedi, S. L., Vadez, V., Hamidou, F., Singh, S., Varshney, R. K., et al. 2014. Multiple resistant and nutritionally dense germplasm identified from mini core collection in peanut. Crop Science, 54, 679–693.