Amir Hossein Ghaderi1*, Mohammad Ali Nazari1, Hassan Shahrokhi2, Amir Hossein Darooneh3
Research Paper:
Functional Brain Connectivity Differences
Between Different ADHD Presentations: Impaired
Func-tional Segregation in ADHD-Combined Presentation but not
in ADHD-Inattentive Presentation
Introduction: Contrary to Diagnostic and Statistical Manual of Mental Disorders (DSM-5), fifth edition, some studies indicate that ADHD-inattentive presentation (ADHD-I) is a distinct diagnostic disorder and not an ADHD presentation.
Methods: In this study, 12 ADHD-combined presentation (ADHD-C), 10 ADHD-I, and 13 controls were enrolled and their resting state EEG recorded. Following this, a graph theoretical analysis was performed and functional integration and segregation of brain network was calculated.
Results: The results show that clustering coefficient of theta band was significantly different among three groups and significant differences were observed in theta global efficiency between controls and ADHD-C. Regarding the alpha band, a lower clustering coefficient was observed in control subjects. In the beta band, clustering coefficient was significantly different between the control and children with ADHD-C and also between ADHD-I and ADHD-C. The clustering coefficient, in the subjects with ADHD-C, demonstrated a rapid decline and was significantly lower than the subjects with ADHD-I and control.
Conclusion: Decreased clustering, in high thresholds, may be associated with hyperactivity while increased segregation in low thresholds with inattentiveness. A different functional network occurs in the ADHD-C brain that is consistent with several studies that have reported ADHD-I as a distinct disorder.
A B S T R A C T
Key Words:
ADHD presentations, Graph theory, Brain segregation, Brain integration, EEG Article info:
Received: 15 Jul. 2016
First Revision: 26 Aug. 2016
Accepted: 14 Dec. 2016
1. Cognitive Neuroscience Laboratory, Department of Psychology, University of Tabriz, Tabriz, Iran. 2. Research Center of Psychiatry and Behavioral Sciences, Tabriz University of Medical Sciences, Tabriz, Iran. 3. Department of Physics, Faculty of Sciences, University of Zanjan, Zanjan, Iran.
* Corresponding Author:
Amir Hossein Ghaderi, PhD Candidate
Address: Department of Psychology, Faculty of Education & Psychology, University of Tabriz, Tabriz, Iran. Tel:+98 (911) 7742302
E-mail: [email protected]
CrossMark
Citation: Ghaderi, A. H., Nazari, M. A., Shahrokhi, H., & Darooneh, A. H. (2017). Functional Brain Connectivity Differ
-ences Between Different ADHD Presentations: Impaired Functional Segregation in ADHD-Combined Presentation but not in ADHD-Inattentive Presentation. Basic and Clinical Neuroscience, 8(4), 267-278. https://doi.org/10.18869/nirp.bcn.8.4.267
:
: https://doi.org/10.18869/nirp.bcn.8.4.267 Use your device to scan
and read the article online
1. Introduction
ttention-Deficit Hyperactivity Disorder (ADHD) in the Diagnostic and Statistical Manual of Mental Disorders-fifth edition
(DSM-5) is characterized by a behavioral pattern present
in multiple settings, including school and home
(Ameri-can Psychiatric Association, 2013). The prevalence of ADHD is 5% to 10% in school-aged children (Scahill & Schwab-Stone, 2000). Symptoms are divided into two
categories of inattention and hyperactivity-impulsivity (American Psychiatric Association, 2013). Children
with ADHD with a predominantly inattentive presenta
-tion (ADHD-I) have difficulties in focusing their atten
-tion while children with ADHD combined presenta-tion
(ADHD-C) have two categories of symptoms: inatten
-tion and hyperactivity-impulsivity.
Despite conventional categorization of ADHD presen
-tations, some studies suggest that ADHD-I is a distinct diagnostic disorder and not a presentation of ADHD
(Milich, 2001;Barkley, 2001). Barkley suggests that ex
-ecutive function deficit (EF-hypothesis) is not common in ADHD-I (Barkley, 1997) and this model is supported by other studies (Nigg, Blaskey, Huang-Pollock & Rappley,
2002;Lockwood, Marcotte, & Stern, 2001). However,
the EF-hypothesis of ADHD-C is controversial (Geurts, Verte, Oosterlaan, Roeyers, & Sergeant, 2005; Willcutt,
Doyle, Nigg, Faraone, & Pennington, 2005). Some evi
-dence suggests that ADHD-C and ADHD-I presentations do not differ from one another and support the validity
of the DSM classification of ADHD combined and inat
-tentive presentations (Geurts et al., 2005; Willcutt et al.,
2005;Mayes, Calhoun, Chase, Mink, & Stagg, 2008).
Neurophysiological studies have shown that patho
-physiology of ADHD is associated with several abnor
-malities in cortical and subcortical regions (Cortese et al.,
2012;Tian et al., 2008;Nazari et al., 2010) and various
functional networks such as frontostriatal and frontotem
-poral circuits (Cortese et al., 2012;Tian et al., 2008;Naz
-ari et al., 2010;Konrad & Eickhoff, 2010). Functional
magnetic resistant imaging (fMRI) has shown hypo-ac
-tivity of the frontoparietal (executive functions system) and ventral attentional networks in children with ADHD compared to the controls (Cortese et al., 2012). Many electroencephalography (EEG) studies have reported that ADHD is characterized by abnormal amplitude in
brain waves; specifically in the theta and beta frequen
-cies (Arns, Conners, & Kraemer, 2012;Loo & Barkley,
2005;Lazzaro et al., 1998;Clarke, Barry, McCarthy, &
Selikowitz, 2001). There is sufficient evidence to sup
-port abnormal activity of alpha waves in children with
ADHD (Hale et al., 2010;Nazari, Wallois, Aarabi, &
Berquin, 2011). Despite various investigations into the neurophysiology of ADHD, no clear boundaries have been found between different ADHD presentations and
many studies have failed to demonstrate significant dif
-ferences (Barkley, Grodzinsky, & DuPaul, 1992;Buyck
& Wiersema, 2014;Willcutt et al., 2012; Chhabildas,
Pennington, & Willcutt, 2001). However, other studies
have been shown clear differences between presenta
-tions (Nikolas, & Nigg, 2013;Vasserman, Bender, & MacAllister, 2013).
The functional and structural connectivity of complex
networks are investigated using graph theoretical analy
-sis. Several recent studies have demonstrated that graph theoretical analysis is a reliable approach to determine functional or structural brain connectivity abnormalities
in various neurological, psychiatric, and cognitive dis
-orders (Bullmore & Sporns, 2009;Rubinov & Sporns,
2010;Papo, Buldu, Boccaletti, & Bullmore, 2014;Stam
et al., 2016;Finn er al., 2014). In 1998, Watts and Stro
-gatz introduced the concept that “small world” networks are highly clustered, like regular networks, and have small shortest path similar to random graphs. It has been suggested that models with small world coupling exhibit
increased synchronization and speed of signal-propaga
-tion (Watts & Strogatz, 1998).
Small world topology has been identified in many func
-tional and structural brain connectivity networks (Bull
-more & Sporns, 2009;Rubinov & Sporns, 2010;Papo
et al., 2014;Stam et al., 2016), and altered small world
network has been reported in several disorders such as
schizophrenia (Liu et al., 2008;Yu et al., 2011), autism
(Itahashi et al., 2014), Alzheimer (Stam, Jones, Nolte,
Breakspear, & Scheltens, 2006), and ADHD (Wang et
al., 2008;Xia, Foxe, Sroubek, Branch, & Li, 2014;Cao,
Shu, Cao, Wang, & He, 2014;Liu, Chen, Lin, & Wang,
2014). Recent studies suggest that functional connectivi
-ty in EEG sub-bands is altered during ADHD (Liu, et al.,
2014;Ahmadlou, Adeli, & Adeli, 2012;Liu, Lin, Chen,
& Wang, 2014). Decreased global efficiency, increased shortest path length and local characteristics in ADHD have been confirmed in several studies (Liu et al., 2014; Cao et al., 2013). In addition, altered connectivity of orbitofrontal-temporal and frontal-amygdala networks has been demonstrated in subjects with inattention and
hyperactivity in recent fMRI studies (Cocchi et al., 2012;
Mills et al., 2012). However, the functional difference of complex brain networks in ADHD presentations has not been investigated yet.
The current study is the first study to identify a func
-tional difference in ADHD presentations using graph
theoretical analysis. EEG coherence in different frequen
-cy bands (delta, theta, alpha, and beta) among electrode
pairs was used to determine edges and clustering coef
2. Methods
2. 1. ParticipantsThirty-five right-handed children aged between 7 and 11 years participated in the experiment 12 ADHD-C [8 boys, 4 girls; mean age: 8.42±1.78 y], 10 ADHD-I [6 boys, 4 girls; mean age: 8.60±1.42 y] and 13 controls [8 boys, 5 girls; mean age: 8.92±1.38 y]. Children with ADHD were all recruited from Hamrah Child and Adolescent Multidisciplinary Neuropsychiatric Center, Tabriz, Iran. None of the children in the study had ever been treated with methylphenidate or had a history of treatment with
neuromodulation devices such as neurofeedback or tran
-scranial direct current stimulation. Full diagnostic criteria for the ADHD combined and inattentive participants for ADHD-C and ADHD-I were implemented, respectively. The diagnosis was based on DSM-5 criteria.
For all participants, the child behavior checklist (Teh
-rani-Doost, Shahrivar, Pakbaz, Rezaie, & Ahmadi, 2011) was completed by the parents; also the Swanson, Nolan, and Pelham IV questionnaire (Hooshyari, Mohammadi, & Delavar, 2008) was filled out by both parents and teachers. Then, the diagnostic interview schedule for children was
applied. Diagnosis of the participants was also investigat
-ed independently by a child psychiatrist and a psycholo
-gist both blinded to the findings and was included in the
groups if and only if both clinicians agreed on the diagno
-sis. Furthermore, children with other confounding neuro-psychiatric disorders were excluded from the subjects.
2.2. EEG data acquisition and processing
For EEG recording, we used a Mitsar® amplifier with 21 channels and WinEEG® software. EEG was sampled at 250 Hz with a filtered online 0.1–40 Hz band pass. EEG was recorded using a 19 channel Electrocap® according
to the 10-20 international system. All electrodes were ref
-erenced to linked earlobes, and the ground was placed on AFZ. Electrode impedance was maintained below 10 kΩ.
EEG signals were recorded for 5 minutes in eye open condition and at least 90 seconds of artifact free signal was selected for processing. Visual signal selection and then automatic rejection (the amplitude threshold detection al
-gorithm in Neuro-guide® software) was used for artifact rejection. Each epoch was also visually appraised by an in
-dependent expert. EEG data were processed offline by Neu
-ro-guide software1and the EEG coherence of 5 frequency
bands; theta (4.5-7 Hz), alpha (7.5-12 Hz), beta1 (12-15
1. www.appliedneuroscience.com
Hz), beta2 (15-17.5 Hz) and beta3 (18-25 Hz) among all electrode pairs (total 171 pairs×5 bands) were obtained.
2. 3. Graph theoretical analysis
A 19×19 binary adjacent matrix was formed as a func
-tional network for each participant. Previous findings
have suggested that coherence can be used to character
-ize the pathophysiological changes in ADHD (Barry,
2002). Therefore, to identify the functional network be
-tween electrodes, the EEG spectral coherence be-tween
all electrode pairs was used (171 pairs in each frequen
-cy). Coherence was calculated by:
Coh2
ij(ω)=
E[Cij(ω)|2]
E[Cii(ω)]E[Cjj(ω)]
Where C(w) is the Fourier transform of cross correla
-tion coefficients between two electrodes (Sanei & Cham
-bers, 2007). Binary adjacency matrixes or undirected graphs were produced by applying a threshold to each element of the coherence matrixes. The networks were then investigated across a broad range of thresholds.
As a measure of functional segregation (Rubinov &
Sporns, 2010), the clustering coefficient (C) was calcu
-lated for each participant. The clustering coefficient in a
node i is obtained by counting the number of edges in the
subgraph of i neighbors. Locally, the clustering coefficient
is measured as the ratio between the number of actual edges and the maximum possible number of edges in the
subgraph of neighbors of i(Boccaletti, Latora, Moreno,
Chavez, & Hwang, 2006). Therefore, the clustering coef
-ficient reflects the extent to which neighbors of a vertex are also neighbors of each other (Watts & Strogatz, 1998).
Functional integration in the brain is measured by the
characteristic path length of the network (L) that is identi
-fied by averaging on all shortest paths. In a 19×19 binary adjacent matrix, there are 171 shortest paths between all
pairs of nodes in the network and their average is the char
-acteristic path length of the network (Rubinov & Sporns,
2010). Rapid integration of specialized information from
distributed brain regions was best seen with a small char
-acteristic path length (Rubinov & Sporns, 2010).
Clustering coefficient and global efficiency were calculat
-ed as a function of threshold using the open source Matlab
toolbox2(Rubinov & Sporns, 2010) and the results were
compared among three groups. After wards, small world
structure was investigated. Watts and Strogatz (1998) pro
posed a method by which C and L can be used for quantify
-ing the small-world properties of a network. As indicated
by Watts and Strogatz, a small-world network can be high
-ly clustered as regular graphs. In addition, the small-world network has small characteristic path lengths consistent with random networks (Watts & Strogatz, 1998). In other
words, small world graphs are simultaneously highly inte
-grated and segregated (Rubinov & Sporns, 2010).
2. 4. Statistical analysis
Statistical analysis was accomplished with IBM SPSS
19. Average clustering coefficient and average global ef
-ficiency among all electrodes in each group were com
-pared by analysis of variance (ANOVA). To investigate differences between group pairs, a post hoc analysis (Tukey) was applied. In various thresholds of frequency bands, clustering coefficient and global efficiency were
calculated and related graphs as a function of thresh
-olds were determined. In each band, the R among these graphs were obtained by Matlab software.
3. Results
3. 1. Theta band (4-7 Hz)
Regarding the theta frequency band, the clustering co
-efficient was significantly different among three groups
(Figure 1-a). In lower thresholds, both ADHD presenta
-tions displayed higher clustering values than the control group. However, in higher thresholds there was a rapid decline of clustering in the ADHD-C presentation and
significant differences were observed between the AD
-HD-C and ADHD-I presentations. At high thresholds, clustering was significantly lower in ADHD-C than that in the control subjects.
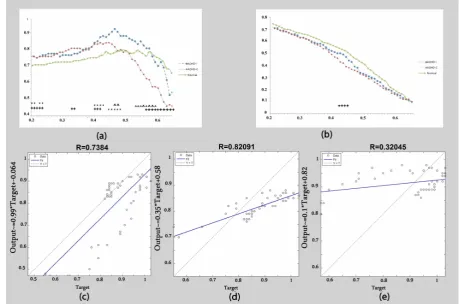
Figure 1. Theta band: (a) Clustering coefficient calculated as a function of threshold. (b) Global efficiency calculated as a func
-tion of threshold. (c) The correla-tion of clustering coefficient graphs between the ADHD-C group and ADHD-I group. (d) The correlation of clustering coefficient graphs between the control group and ADHD-I group. (e) The correlation of clustering coefficient graphs between the control group and ADHD-C group.
+ Significant difference between the control group and ADHD-C group. * Significant difference between the control group and t ADHD-I group. ^ Significant difference between the ADHD-C group and ADHD-I group. Big signs: P<0.01.
Clustering coefficients as a function of different thresh
-olds are shown in Figure 1-c. The correlation among three
graphs was determined by calculation of R and a consider
-able correlation between control subjects and the ADHD-I
group was observed (Figure 1-d and Table 1). However,
the correlation between the ADHD-C and the control
group was very weak (Figure 1-e and Table 1). Global ef
-ficiency was higher in the control group than either of the
ADHD presentations and significant differences were ob
-served between controls and ADHD-C (Figure 1-b).
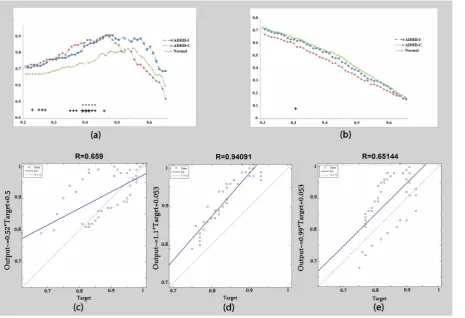
3. 2. Alpha band (8-12 Hz)
In the alpha frequency band, a lower clustering coeffi
-cient was observed in control subjects compared to either of the ADHD presentations (T<0.5). In addition, a rapid decline in ADHD-C was observed in T>0.5 (Figure 2-a).
The correlation of the clustering coefficient was con
-siderable (R=0.94) as a function of thresholds between
control and ADHD-I (Figure 2-d and Table 1). However,
there was no significant correlation between controls and
ADHD-C (Figure 2-e and Table 1). There was no signifi
-cant difference between ADHD-I and ADHD-C (Figure
2-c and Table 1). Global efficiency in the control group showed a significant difference with ADHD-C at T=0.31, where lower values of global efficiency were observed particularly in ADHD-C presentation (Figure 2-b).
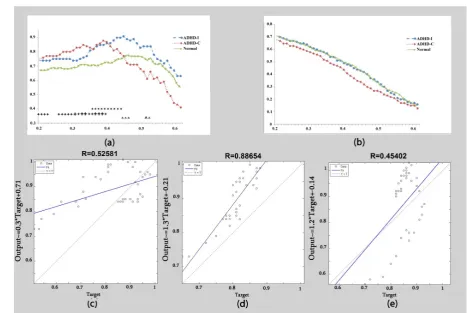
3. 3. Beta1 band (12-15 Hz)
A significant difference in the beta1 frequency band was observed between the control group and children with ADHD-C in lower thresholds (T<0.4) and between
ADHD-I and control subjects in 0.35<T<0.46. As in al
-Figure 2. Alpha band: (a) Clustering coefficient calculated as a function of threshold. (b) Global efficiency calculated as a func
-tion of threshold. (c) The correla-tion of clustering coefficient graphs between the ADHD-C group and ADHD-I group. (d) The correlation of clustering coefficient graphs between the control group and ADHD-I group. (e) The correlation of clustering coefficient graphs between the control group and ADHD-C group.
+ Significant difference between the control group and ADHD-C group. * Significant difference between the control group and ADHD-I group. ^ Significant difference between the ADHD-C group and ADHD-I group. Big signs: P<0.01.
pha and theta bands, a rapid decline in ADHD-C was
observed in T>0.4 (Figure 3-a). The R between the
clustering graphs as a function of threshold demonstrat
-ed a higher correlation between the control group and ADHD-I (R=0.89) than between the control group and
ADHD-C (R=0.45) (Figures 3-d and 3-e). Furthermore,
no remarkable correlation was observed between ADHD presentations (Figure 3-c). Both the control and ADHD-I
groups demonstrated a higher global efficiency than AD
-HD-C group in a greater number of thresholds, but these differences were not significant (Figure 3-b).
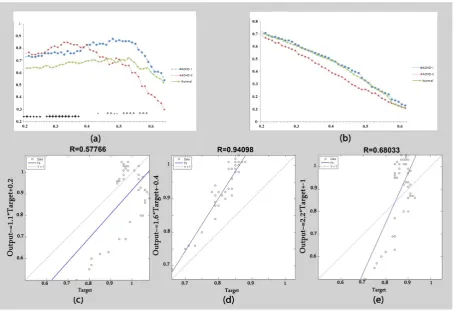
3. 4. Beta2 band (15-18 Hz)
In the beta2 frequency band clustering coefficient, a sig
-nificant difference was observed between the ADHD-C
and control groups in T<0.38 while ADHD-C had a high
-er C than both ADHD-I and control groups (Figure 4-a).
Regarding the middle thresholds (0.4<T<0.5), the AD
-HD-I group showed significantly higher values than the ADHD-C group and control subjects. At high thresholds
(T>0.5), ADHD-I showed a significantly higher clus
-tering coefficient than ADHD-C. ADHD-C displayed a rapid decline of the clustering coefficient graph at T>0.39
and there was no significant correlation between the clus
-tering graph in ADHD-C and the control group (Figure
4-e). There was no correlation between ADHD-C and
ADHD-I (Figure 4-c). However, as indicated in Figure
4-d, a significant correlation (R=0.94) was observed in
the clustering coefficient graph as a function of threshold between ADHD-I and the control group.
3. 5. Beta3 band (18-25 Hz)
In the beta3 frequency band, the clustering coefficients of ADHD-I and ADHD-C were significantly different
Figure 3. Beta1 band: (a) Clustering coefficient calculated as a function of threshold. (b) Global efficiency calculated as a func
-tion of threshold. (c) The correla-tion of clustering coefficient graphs between the ADHD-C group and ADHD-I group. (d) The correlation of clustering coefficient graphs between the control group and ADHD-I group. (e) The correlation of clustering coefficient graphs between the control group and ADHD-C group.
+ Significant difference between the control group and ADHD-C group. * Significant difference between the control group and ADHD-I group. ^ Significant difference between the ADHD-C group and ADHD-I group. Big signs: P<0.01.
from the control group at lower thresholds. In addition, there was no significant correlation between the clustering coefficient graphs (Figure 5-c, 5-d, and 5-e). Despite some
correlations in other band frequencies, a significant corre
-lation was not observed between the ADHD-I and control groups in the clustering coefficient graph as a function of threshold. The global efficacy was also not significantly different among three studied groups (Figure 5-b).
4. Discussion
The current study is the first to investigate functional con
-nectivity differences between two ADHD presentations
(ADHD-I and ADHD-C) and control subjects. We demon
-strated that the functional connectivity in ADHD presenta
-tions is different from control subjects (Figure 6 and 7).
However, children with ADHD-C exhibited more signifi
-cant differences from control subjects compared to chil
-dren with ADHD-I (Table 1). Significant differences were
also observed between the ADHD-I and ADHD-C groups.
Several studies suggest that stimulus assessment
(Brickman et al., 2005;Sammer et al., 2007) and
Long-Term Potentiation (LTP) (Sammer et al., 2007;Larson,
Wong, & Lynch, 1986) are related to EEG theta activity. Likewise, many conventional studies report that theta hyperactivity is observed in ADHD (Arns, et al., 2012;
Loo & Barkley, 2005;Lazzaro et al., 1998;Clarke, Bar
-ry, McCarthy & Selikowitz, 2001). Previous studies have
also shown that children with ADHD exhibit elevated in
-tra hemispheric coherence in the theta band. These stud
-ies have demonstrated that children with ADHD-C have greater intra hemispheric theta coherence than children with ADHD-I (Barry, 2002).
Figure 4. Beta2 band: (a) Clustering coefficient calculated as a function of threshold. (b) Global efficiency calculated as a func
-tion of threshold. (c) The correla-tion of clustering coefficient graphs between the ADHD-C group and ADHD-I group. (d) The correlation of clustering coefficient graphs between the control group and ADHD-I group. (e) The correlation of clustering coefficient graphs between the control group and ADHD-C group.
+ Significant difference between the control group and ADHD-C group. * Significant difference between the control group and ADHD-I group. ^ Significant difference between the ADHD-C group and ADHD-I group. Big signs: P<0.01.
Evidently a greater theta coherence reported in chil
-dren with ADHD may be associated with hyperactiv
-ity (Barry, 2002; Clarke et al., 2008). In agreement
with these previous findings, the present study used
complex network analysis to expose different func
-tional brain networks in children with ADHD. Spe
-cifically, at higher thresholds, a rapid decline of the clustering coefficient was observed in the ADHD-C group. Furthermore, the clustering coefficient for this group was significantly lower than the ADHD-I group and control subjects.
Figure 5. Beta 3 band: (a) Clustering coefficient calculated as a function of threshold. (b) Global efficiency calculated as a func
-tion of threshold. (c) The correla-tion of clustering coefficient graphs between the ADHD-C group and ADHD-I group. (d) The correlation of clustering coefficient graphs between the control group and ADHD-I group. (e) The correlation of clustering coefficient graphs between the control group and ADHD-C group.
+ Significant difference between the control group and ADHD-C group. * Significant difference between the control group and ADHD-I group. ^ Significant difference between the ADHD-C group and ADHD-I group. Big signs: P<0.01.
Small signs: P<0.05.
Figure 6. Theta band: Circular graph in T=31. (a) Control group. (b) ADHD-C group. (c) ADHD-I group.
Alpha waves have also been investigated in several
ADHD studies (Hale et al., 2010;Nazari et al., 2011).
These studies have demonstrated that children with ADHD had reduced intra hemispheric coherences in the alpha bands. At longer inter electrode distances,
ADHD children had lower intra hemispheric alpha co
-herence than controls (Barry, 2002). In a separate alpha analysis, increased coherence in the lower alpha (8 Hz) and decreased coherence in the upper alpha (10–11 Hz)
band was seen in the ADHD group (Murias, Swanson,
& Srinivasan, 2006). Alpha coherence has been shown to be stronger during observation of movement than
during pauses in activity (Van der Helden, Van Schie,
& Rombouts, 2010). However, reduced alpha 1 coher
-ence, increased alpha 2, and beta coherence have been
observed in anticipatory actions (Silva et al., 2012).
Our results show that the alpha clustering coefficient in ADHD presentations is higher than normal. However, at higher thresholds (T>0.45), a rapid decline was observed in ADHD-C but not in ADHD-I.
A reduced beta power has been repeatedly reported in ADHD children (Arns et al., 2012). In the present study, children with ADHD-C were shown to have increased
beta1 and beta2 clustering coefficients at low thresh
-olds and a significant difference was observed between
ADHD-C and control subjects (Figure 3-a). At higher
thresholds, as in theta and alpha bands, children with
ADHD-C show a rapid decline in the clustering coeffi
-cient and significant differences were observed between ADHD-I and ADHD-C groups. There was no significant change in global efficiency (Figure 3-b).
The presence of clusters or modules in functional net
-works denotes a segregated neural processing (Rubinov
& Sporns, 2010). The ability to rapidly combine special
-ized information from distributed brain regions requires functional integration of the brain and is correlated by
characteristic shortest path or inversely by global ef
-ficiency (Rubinov & Sporns, 2010). In low thresholds,
the functional brain network in ADHD presentations was significantly different from that in control subjects (in
theta, alpha, beta1 and beta2 bands). A high clustering co
-efficient, in ADHD presentations, was associated with in
-creased local modularity in ADHD brain. This finding is consistent with previous studies (Lin et al., 2013; Wang, Lin, & Wu, 2014) and may be related to inattention.
The small world brain function has been demonstrat
-ed in previous studies (Bullmore & Sporns, 2009; Ru
-binov & Sporns, 2010; Papo et al., 2014;Stam et al.,
2016). A small-world network is highly clustered with
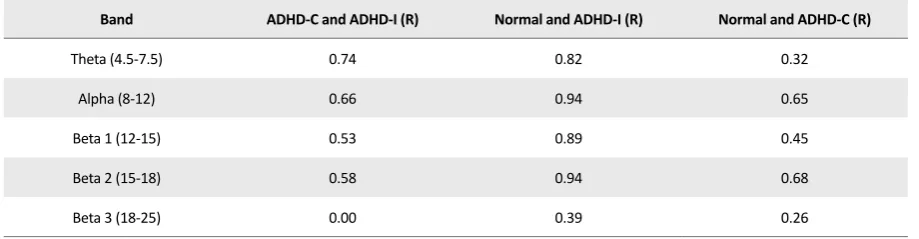
Table 1. Correlation among the clustering graphs as functions of threshold.
Band ADHD-C and ADHD-I (R) Normal and ADHD-I (R) Normal and ADHD-C (R)
Theta (4.5-7.5) 0.74 0.82 0.32
Alpha (8-12) 0.66 0.94 0.65
Beta 1 (12-15) 0.53 0.89 0.45
Beta 2 (15-18) 0.58 0.94 0.68
Beta 3 (18-25) 0.00 0.39 0.26
Figure 7. Alpha band: binary connectivity graph in T=30. (a) Control group. (b) ADHD-C group. (c) ADHD-I group
Blue: disconnected nodes; Green: connected nodes.
low characteristic path (or high global efficiency). In
-creased theta clustering coefficient and de-creased theta global efficiency in ADHD-C compared to the control group demonstrates a shift toward regular networks and this finding is in agreement with a previous fMRI study
(Wang et al., 2008). A significant difference in the clus
-tering coefficient (T>0.49) between the ADHD-I group and the ADHD-C group is in agreement with previous studies indicating that abnormal activity in the theta
band is correlated to hyperactivity (Barry, 2002;Clarke
et al., 2008). This is an important result, because there is no significant difference between the ADHD-I group and control subjects at these thresholds.
Overall, an impaired segregation in higher thresholds was observed in children with ADHD-C (in theta, alpha, beta1, and beta2 bands). This new finding indicates a brain functional change in the ADHD-C presentation that was completely different from the ADHD-I presentation. This suggests that various neuronal activities may be involved in different ADHD-presentations. The current finding is consistent with previous studies that introduce ADHD-I
as a distinct disorder (Milich, 2001; Barkley, 2001;Bark
-ley, 1997;Nigg et al., 2002;Lockwood et al., 2001).
A significant correlation of clustering coefficients at certain thresholds was observed between ADHD-I group and controls (for example in the theta band, R=0.82).
However, there was not a considerable correlation be
-tween ADHD-C and the control group (again in the theta band, R=0.32). The results demonstrated that in ADHD-C, there was a rapid reduction at high thresholds while this reduction was much slower in children with ADHD-I
and controls. Therefore, in ADHD-C, the functional seg
-regation was significantly reduced at higher thresholds which may be correlated with impairment in the neural
network (Clarke et al., 2008; Murias et al., 2006). We
suggest that this rapid reduction of theta, alpha, and beta clustering coefficients at higher thresholds may be related
to hyperactivity or impulsivity in ADHD-C but not re
-lated to the inattention presentation seen in ADHD-I.
Overall, ADHD presentations demonstrated an increased
segregation in low thresholds that were correlated to in
-creased local modularity and may be related to inattention. It shows a different functional network in the brains of
ADHD-C subjects which was consistent with several stud
-ies that introduce ADHD-I as a distinct disorder (Milich,
2001;Barkley, 2001;Barkley, 1997;Nigg et al., 2002). We
suggest that decreased clustering at high thresholds may be associated with hyperactivity. Furthermore, in the theta band, significantly increased clustering and decreased global efficiency of the ADHD-C group demonstrates that
the small-world brain network has been impaired and a shift toward regular networks was observed.
Our findings are the first to show a significant differ
-ence in functional brain networks between children with ADHD-C and ADHD-I. However, further studies with greater number of participants is required to replicate our results and assumptions.
Acknowledgements
This research did not receive any specific grant from funding agencies in the public, commercial, or not-for-profit sectors.
Conflict of Interest
The authors report no conflict of interests.
References
Ahmadlou, M., Adeli, H., & Adeli, A. (2012). Graph theo
-retical analysis of organization of functional brain networks in ADHD. Clinical EEG and Neuroscience, 43(1), 5–13. doi: 10.1177/1550059411428555
American Psychiatric Association. (2013). Diagnostic and sta-tistical manual of mental disorders (DSM-5). Washington, D.C.: American Psychiatric Association. doi: 10.1176/appi. books.9780890423349
Arns, M., Conners, C. K., & Kraemer, H. C. (2012). A decade of EEG theta/beta ratio research in ADHD. Journal of Attention Disorders, 17(5), 374–83. doi: 10.1177/1087054712460087
Barkley, R. A. (1997). Behavioral inhibition, sustained attention, and executive functions: Constructing a unifying theory of ADHD. Psychological Bulletin, 121(1), 65–94. doi: 10.1037/0033-2909.121.1.65
Barkley, R. A. (2001). The inattentive type of ADHD as a distinct disorder: What remains to be done. Clinical Psychology: Science and Practice, 8(4), 489–93. doi: 10.1093/clipsy/8.4.489
Barkley, R. A., Grodzinsky, G., & DuPaul, G. J. (1992). Frontal lobe functions in attention deficit disorder with and without hyperactivity: A review and research report. Journal of Abnor-mal Child Psychology, 20(2), 163–88. doi: 10.1007/bf00916547
Barry, R. (2002). EEG coherence in attention-deficit/hyperac
-tivity disorder: A comparative study of two DSM-IV types.
Clinical Neurophysiology, 113(4), 579–85. doi: 10.1016/s1388-2457(02)00036-6
Boccaletti, S., Latora, V., Moreno, Y., Chavez, M., & Hwang, D. (2006). Complex networks: Structure and dynamics. Physics Reports, 424(4-5), 175–308. doi: 10.1016/j.physrep.2005.10.009
across the adult lifespan: Relationship to EEG theta power. Ar-chives of Clinical Neuropsychology, 20(5), 561–73. doi: 10.1016/j. acn.2004.12.006
Bullmore, E., & Sporns, O. (2009). Complex brain networks: Graph theoretical analysis of structural and functional sys
-tems. Nature Reviews Neuroscience, 10(3), 186–98. doi: 10.1038/ nrn2575
Buyck, I., & Wiersema, J. R. (2014). Resting electroencephalo
-gram in attention deficit hyperactivity disorder: Developmen
-tal course and diagnostic value. Psychiatry Research, 216(3), 391–7. doi: 10.1016/j.psychres.2013.12.055
Cao, M., Shu, N., Cao, Q., Wang, Y., & He, Y. (2014). Imaging
functional and structural brain connectomics in
attention-deficit/hyperactivity disorder. Molecular Neurobiology, 50(3), 1111–23. doi: 10.1007/s12035-014-8685-x
Cao, Q., Shu, N., An, L., Wang, P., Sun, L., Xia, M.-R., et al. (2013). Probabilistic diffusion tractography and graph theory analysis reveal abnormal white matter structural connectivity networks in drug-naive boys with attention deficit/hyperac
-tivity disorder. Journal of Neuroscience, 33(26), 10676–87. doi: 10.1523/jneurosci.4793-12.2013
Chhabildas, N., Pennington, B. F., & Willcutt, E. G. (2001). A comparison of the neuropsychological profiles of the DSM-IV subtypes of ADHD. Journal of Abnormal Child Psychology, 29(6), 529–540. doi: 10.1023/a:1012281226028
Clarke, A. R., Barry, R. J., McCarthy, R., & Selikowitz, M. (2001). EEG-defined subtypes of children with attention-deficit/hy
-peractivity disorder. Clinical Neurophysiology, 112(11), 2098– 105. doi: 10.1016/s1388-2457(01)00668-x
Clarke, A., Barry, R., Heaven, P., Mccarthy, R., Selikowitz, M., & Byrne, M. (2008). EEG coherence in adults with atention-deficit/hyperactivity disorder. International Journal of Psycho-physiology, 67(1), 35–40. doi: 10.1016/j.ijpsycho.2007.10.001
Cocchi, L., Bramati, I. E., Zalesky, A., Furukawa, E., Fontenelle, L. F., Moll, J., et al. (2012). Altered functional brain connec
-tivity in a non-clinical sample of young adults with attention-deficit/hyperactivity disorder. Journal of Neuroscience, 32(49), 17753–61. doi: 10.1523/jneurosci.3272-12.2012
Cortese, S., Kelly, C., Chabernaud, C., Proal, E., Di Martino, A., Milham, M. P., et al. (2012). Toward systems neurosci
-ence of ADHD: A meta-analysis of 55 fMRI studies. Ameri-can Journal of Psychiatry, 169(10), 1038–55. doi: 10.1176/appi. ajp.2012.11101521
Finn, E. S., Shen, X., Holahan, J. M., Scheinost, D., Lacadie, C., Papademetris, X., et al. (2014). Disruption of functional net
-works in dyslexia: A whole-brain, data-driven analysis of con
-nectivity. Biological Psychiatry, 76(5), 397–404. doi: 10.1016/j. biopsych.2013.08.031
Geurts, H., Verte, S., Oosterlaan, J., Roeyers, H., & Sergeant, J. (2005). ADHD subtypes: Do they differ in their executive functioning profile. Archives of Clinical Neuropsychology, 20(4), 457–77. doi: 10.1016/j.acn.2004.11.001
Hale, T. S., Smalley, S. L., Dang, J., Hanada, G., Macion, J., Mc
-Cracken, J. T., et al. (2010). ADHD familial loading and ab
-normal EEG alpha asymmetry in children with ADHD.
Journal of Psychiatric Research, 44(9), 605–15. doi: 10.1016/j. jpsychires.2009.11.012
Hooshyari, Z., Mohammadi, M. R., & Delavar, A. (2008). The construction and norm-finding of a rating scale for diagnos
-ing attention deficit hyperactivity disorder in children. Iranian Journal of Psychiatry, 3(1), 9-15.
Itahashi, T., Yamada, T., Watanabe, H., Nakamura, M., Jimbo, D., Shioda, S., et al. (2014). Altered network topologies and hub organization in adults with autism: A resting-state fMRI study. PLoS ONE, 9, 94115. doi: 10.1371/journal.pone.0094115
Konrad, K., & Eickhoff, S. B. (2010). Is the ADHD brain wired differently? A review on structural and functional connectiv
-ity in attention deficit hyperactiv-ity disorder. Human Brain Mapping, 31(6), 904–16. doi: 10.1002/hbm.21058
Larson, J., Wong, D., & Lynch, G. (1986). Patterned stimulation at the theta frequency is optimal for the induction of hippocam
-pal long-term potentiation. Brain Research, 368(2), 347–50. doi: 10.1016/0006-8993(86)90579-2
Lazzaro, I., Gordon, E., Whitmont, S., Plahn, M., Li, W., Clarke, S., et al. (1998). Quantified EEG activity in adolescent attention deficit hyperactivity disorder. Clinical Electroencephalography, 29(1), 37–42. doi: 10.1177/155005949802900111
Lin, P., Sun, J., Yu, G., Wu, Y., Yang, Y., Liang, M., et al. (2013). Global and local brain network reorganization in attention-def
-icit/hyperactivity disorder. Brain Imaging and Behavior, 8(4), 558–569. doi: 10.1007/s11682-013-9279-3
Liu, T., Chen, Y., Lin, P., & Wang, J. (2014). Small-world brain functional networks in children with attention-deficit/hyper
-activity disorder revealed by EEG synchrony. Clinical EEG and Neuroscience, 46(3), 183–91. doi: 10.1177/1550059414523959
Liu, T., Lin, P., Chen, Y., & Wang, J. (2014). Electroencephalo
-gram synchronization analysis for attention deficit hyperac
-tivity disorder children. Bio-Medical Materials and Engineering, 24(1), 1035-9. doi: 10.3233/BME-130901
Liu, Y., Liang, M., Zhou, Y., He, Y., Hao, Y., Song, M., et al. (2008). Disrupted small-world networks in schizophrenia.
Brain, 131(4), 945–61. doi: 10.1093/brain/awn018
Lockwood, K. A., Marcotte, A. C., & Stern, C. (2001). Differentia
-tion of atten-tion-deficit/hyperactivity disorder subtypes: Ap
-plication of a neuropsychological model of attention. Journal of Clinical and Experimental Neuropsychology (Neuropsychology, De-velopment and Cognition: Section A), 23(3), 317–30. doi: 10.1076/ jcen.23.3.317.1179
Loo, S. K., & Barkley, R. A. (2005). Clinical utility of EEG in at
-tention deficit hyperactivity disorder. Applied Neuropsychology, 12(2), 64–76. doi: 10.1207/s15324826an1202_2
Mayes, S. D., Calhoun, S. L., Chase, G. A., Mink, D. M., & Stagg, R. E. (2008). ADHD subtypes and co-occurring anxiety, de
-pression, and oppositional-defiant disorder. Journal of Atten-tion Disorders, 12(6), 540–50. doi: 10.1177/1087054708320402
Milich, R. (2001). ADHD combined type and ADHD predomi
-nantly inattentive type are distinct and unrelated disorders.
Clinical Psychology: Science and Practice, 8(4), 463–88. doi: 10.1093/clipsy/8.4.463
Murias, M., Swanson, J. M., & Srinivasan, R. (2006). Functional connectivity of frontal cortex in healthy and ADHD children reflected in EEG coherence. Cerebral Cortex, 17(8), 1788–99. doi: 10.1093/cercor/bhl089
Nazari, M. A., Berquin, P., Missonnier, P., Aarabi, A., Debatisse, D., De Broca, A., et al. (2010). Visual sensory processing deficit in the occipital region in children with attention-deficit/hy
-peractivity disorder as revealed by event-related potentials during cued continuous performance test. Neurophysiologie Clinique/Clinical Neurophysiology, 40(3), 137–149. doi: 10.1016/j. neucli.2010.03.001
Nazari, M. A., Wallois, F., Aarabi, A., & Berquin, P. (2011). Dy
-namic changes in quantitative electroencephalogram during continuous performance test in children with attention-defi
-cit/hyperactivity disorder. International Journal of Psychophysi-ology, 81(3), 230–6. doi: 10.1016/j.ijpsycho.2011.06.016
Nigg, j. T., Blaskey, L. G., Huang-Pollock, C. L., & Rappley, M. D. (2002). Neuropsychological executive functions and DSM-IV ADHD subtypes. Journal of the American Academy of Child & Adolescent Psychiatry, 41(1), 59–66. doi: 10.1097/00004583-200201000-00012
Nikolas, M. A., & Nigg, J. T. (2013). Neuropsychological perfor
-mance and attention-deficit hyperactivity disorder subtypes and symptom dimensions. Neuropsychology, 27(1), 107–20. doi: 10.1037/a0030685
Papo, D., Buldu, J. M., Boccaletti, S., & Bullmore, E. T. (2014). Complex network theory and the brain. Philosophical Trans-actions of the Royal Society B: Biological Sciences, 369(1653), 20130520. doi: 10.1098/rstb.2013.0520
Rubinov, M., & Sporns, O. (2010). Complex network measures of brain connectivity: Uses and interpretations. NeuroImage, 52(3), 1059–69. doi: 10.1016/j.neuroimage.2009.10.003
Sammer, G., Blecker, C., Gebhardt, H., Bischoff, M., Stark, R., Morgen, K., & Vaitl, D. (2007). Relationship between regional hemodynamic activity and simultaneously recorded EEG-theta associated with mental arithmetic-induced workload.
Human Brain Mapping, 28(8), 793–803. doi: 10.1002/hbm.20309
Sanei, S., & Chambers, J. A. (2007). EEG Signal Processing. New Jersey: John Wiley & Sons. doi: 10.1002/9780470511923
Scahill, L., & Schwab-Stone, M. (2000). Epidemiology of ADHD in school-age children. Child and adolescent psychiatric clinics of North America, 9(3), 541-55. PMID: 10944656
Seidenbecher, T. (2003). Amygdalar and hippocampal theta rhythm synchronization during fear memory retrieval. Sci-ence, 301(5634), 846–50. doi: 10.1126/science.1085818
Silva, F., Arias-Carrión, O., Teixeira, S., Velasques, B., Peressutti, C., Paes, F., et al. (2012). Functional coupling of sensorimotor and associative areas during a catching ball task: A qEEG co
-herence study. International Archives of Medicine, 5(1), 9. doi: 10.1186/1755-7682-5-9
Stam, C. J., Jones, B. F., Nolte, G., Breakspear, M., & Scheltens, P. (2006). Small-world networks and functional connectivity in Alzheimer's disease. Cerebral Cortex, 17(1), 92-9. doi: 10.1093/ cercor/bhj127
Stam, C. J., van Straaten, E. C. W., Van Dellen, E., Tewarie, P., Gong, G., Hillebrand, A., et al. (2016). The relation between structural and functional connectivity patterns in complex
brain networks. International Journal of Psychophysiology, 103, 149–60. doi: 10.1016/j.ijpsycho.2015.02.011
Tehrani-Doost, M., Shahrivar, Z., Pakbaz, B., Rezaie, A., & Ah
-madi, F. (2011). Normative data and psychometric properties of the child behavior checklist and teacher rating form in an Iranian community sample. Iranian Journal of Pediatrics, 21(3), 331-42.
Tian, L., Jiang, T., Liang, M., Zang, Y., He, Y., Sui, M., et al. (2008). Enhanced resting-state brain activities in ADHD patients: A fMRI study. Brain and Development, 30(5), 342–8. doi: 10.1016/j. braindev.2007.10.005
Van der Helden, J., Van Schie, H. T., & Rombouts, C. (2010). Ob
-servational learning of new movement sequences is reflected in fronto-parietal coherence. PLoS ONE, 5, 14482. doi: 10.1371/ journal.pone.0014482
Vasserman, M., Bender, H. A., & MacAllister, W. S. (2013). Mo
-tor skills development in children with inattentive versus combined subtypes of ADHD. Applied Neuropsychology: Child, 3(2), 145–51. doi: 10.1080/21622965.2012.759466
Wang, L., Zhu, C., He, Y., Zang, Y., Cao, Q., Zhang, H., et al. (2008). Altered small-world brain functional networks in chil
-dren with attention-deficit/hyperactivity disorder. Human Brain Mapping, 30(2), 638–49. doi: 10.1002/hbm.20530
Wang, R., Lin, P., & Wu, Y. (2014). Exploring dynamic temporal-topological structure of brain network within ADHD. Advanc-es in Cognitive Neurodynamics, 93–98. doi: 10.1007/978-94-017-9548-7_13
Watts, D. J., & Strogatz, S. H. (1998). Collective dynamics of ‘small-world’networks. Nature, 393(6684), 440–2. doi: 10.1038/30918
Willcutt, E. G., Doyle, A. E., Nigg, J. T., Faraone, S. V., & Pen
-nington, B. F. (2005). Validity of the executive function theory of attention-deficit/hyperactivity disorder: A meta-analytic review. Biological Psychiatry, 57(11), 1336–46. doi: 10.1016/j. biopsych.2005.02.006
Willcutt, E. G., Nigg, J. T., Pennington, B. F., Solanto, M. V., Rohde, L. A., Tannock, R., et al. (2012). Validity of DSM-IV attention deficit/hyperactivity disorder symptom dimensions and subtypes. Journal of Abnormal Psychology, 121(4), 991–1010. doi: 10.1037/a0027347
Xia, S., Foxe, J. J., Sroubek, A. E., Branch, C., & Li, X. (2014). Top
-ological organization of the "small-world" visual attention net
-work in children with attention deficit/hyperactivity disorder (ADHD). Frontiers in Human Neuroscience, 8. doi: 10.3389/fn
-hum.2014.00162