Massachusetts Upstream
Lighting Program Net‐to‐Gross
Ratio Estimates Using Supplier
Self‐Report Methodology
March 2015Prepared for:
The Electric and Gas Program Administrators of Massachusetts
Part of the Residential Evaluation Program Area
This page left blank.
Prepared by:
Sam Harms
Christopher Dyson
DNV GL
Lynn Hoefgen
Lisa Wilson‐Wright
NMR
Bryan Ward
Doug Bruchs
Cadmus
This page left blank.
Table
of
Contents
Executive Summary ... 1 Introduction ... 13 Program Attribution ... 14 Methodology ... 14 Collecting Data ... 14
Calculating NTG Ratios from Supplier Interviews ... 16
Weighting NTG Ratios from Supplier Interviews ... 17
Threats to Validity ... 19
NTG Ratio Estimates from Supplier Interviews ... 21
Standard CFLs ... 21
Specialty CFLs ... 25
LEDs ... 29
Year‐to‐Year Comparison and Conclusions ... 31
Appendix A: Detailed Explanation of Program Tracking Data Classification ... 35
Appendix B: Interview Guide for Manufacturers and Retail Buyers Participating in the 2013 Massachusetts and Connecticut ENERGY STAR® Lighting Programs ... 37
Appendix C: Massachusetts ENERGY STAR Retail Store/Product Manager Survey Codebook ... 64
This page left blank.
Executive Summary
This report presents our estimates of net‐to‐gross (NTG) ratios for CFL and LED bulbs sold through the Massachusetts ENERGY STAR upstream lighting program in 2013 using the supplier self‐report
methodology. The first of several NTG estimates, these rely on different and complementary
methodologies the Residential Evaluation Team is developing on behalf of the Massachusetts Program Administrators (PAs) and Energy Efficiency Advisory Council (EEAC) consultants. The other three
approaches include a demand elasticity model, point‐of‐sale data analysis, and purchase estimates from comparison areas. Our evaluation team will develop an aggregated NTG ratio estimate that will be informed by these four methodologies.
We derived the NTG ratios in this report from responses to in‐depth interviews and computer‐aided telephone interview (CATI) surveys with various market actors participating in the 2013 program. We collected and synthesized NTG estimates from the following:
14 lighting manufacturers (which accounted for 86% of 2013 program bulb sales);
Four buyers of lighting products for large national or regional retailers participating in the program; and
224 managers of stores selling lighting products through the program.
The NTG estimates we collected from lighting manufacturers together accounted for 71% of program sales (in some cases respondents did not provide or were not asked to provide estimates for all of their bulb sales).1 Store managers had a higher number of NTG estimators (i.e., respondents providing an estimate) than the other market actors, but the cumulative amount of program sales represented by these estimators ranged from 11% to 19%, depending on bulb types. The four retail buyers from which we could collect NTG estimates accounted for 3% to 34% of program sales, again depending on bulb types.
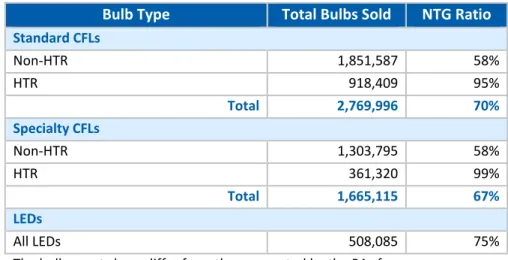
Table 1 shows NTG ratios estimated for each bulb type sold through the program. We calculated separate NTG estimates for bulbs sold through stores characterized as hard‐to‐reach (HTR) and through stores not characterized as such. HTR‐designated stores included the vast majority of stores making up the “discount” channel (such as dollar stores), ethnic grocery stores, and a few home improvement stores targeting low‐income citizens.
While we aggregated to the bulb level and store type, this report also shows bulb‐type NTG ratios broken down by retail channel.
Table 1. NTG Ratios for Each Bulb Type Sold Through 2013 Program* Bulb Type Total Bulbs Sold NTG Ratio
Standard CFLs Non‐HTR 1,851,587 58% HTR 918,409 95% Total 2,769,996 70% Specialty CFLs Non‐HTR 1,303,795 58% HTR 361,320 99% Total 1,665,115 67% LEDs All LEDs 508,085 75%
The bulb counts here differ from those reported by the PAs for reasons
discussed in Appendix A. The biggest reason for the discrepancy was that there were a large number of shipments in the program tracking data (~1.5 million bulbs) that did not identify the retailer. We dropped these observations because we need a retailer name to be able to assign the bulbs to a retail channel for use in the sales weights.
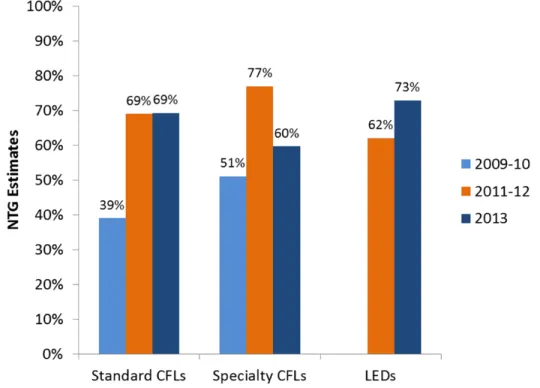
Figure 1 compares NTG ratios we calculated for 2013 program participants (with HTR and non‐HTR bulbs combined) with those we calculated for previous program years, using the same supplier self‐report methodology. While the 2009–2010 and 2013 estimates included NTG estimates from all three market actor levels (e.g., manufacturers, retail buyers, and store managers), the 2011–2012 estimates only included estimates from store managers.2
2
To allow consistent comparability across the years in this graphic, the 2013 NTG ratios here do not include the “other” category of program lighting sales (which included handouts of light bulbs at community events, schools, office buildings, malls, etc.).
Figure 1. Supplier Self‐Report Methodology: NTG Estimates
for Each Bulb Type, by Participation Year
Note: The 2013 NTG ratios in this figure are different than the ones in Table 1 because we excluded the “other” channel to allow a more consistent comparison across program years.
The chart shows much higher NTG ratios for the 2013 program year than those in the 2009–2010 program year — the last program year when NTG ratios were based on estimates from all three market actors levels of the lighting supply chain. Considering Massachusetts energy‐efficiency programs have promoted CFLs since the late 1990s, it may appear surprising that market actors still estimate CFL sales would decline by 60‐70% in the program’s absence.
Two explanations most likely address the higher NTG ratios over time:
First, as DNV GL discussed in evaluating the 2011–2012 program, EISA‐compliant halogens entered the market in recent years. These bulbs present a lower‐cost competitor to CFLs that closely resembles the incandescent bulbs many consumers remain comfortable with, but were marketed as energy‐efficient bulbs (in comparison to incandescents).
Some manufacturers selling CFLs in the Massachusetts and California residential lighting
markets have recently pointed to California as a “cautionary tale” for what would happen in the Massachusetts lighting market if the Massachusetts program eliminated or significantly reduced
absence of program discounts. DNV GL is currently conducting a new round of lighting shelf surveys in California to try to verify these claims. 3
Second, over time, the Massachusetts program has shifted greater volumes of bulb shipments from “big box” retail channels—such as large home improvement stores (e.g., Home Depot), mass merchandise (e.g., Walmart), and membership clubs (e.g., Costco)—to HTR lighting markets, such as discount and ethnic grocery retail markets.4 As the supplier self‐report method weighted the program’s overall NTG ratio based on program sales, the higher volume of bulbs sold through the HTR channels effectively increased the program’s overall NTG ratio. Within the discount channel itself, the Massachusetts program also experienced shifts in volumes towards more dollar/99 cent stores and charity store chains (e.g., Goodwill, Salvation Army), which have further increased NTG ratios within this channel.
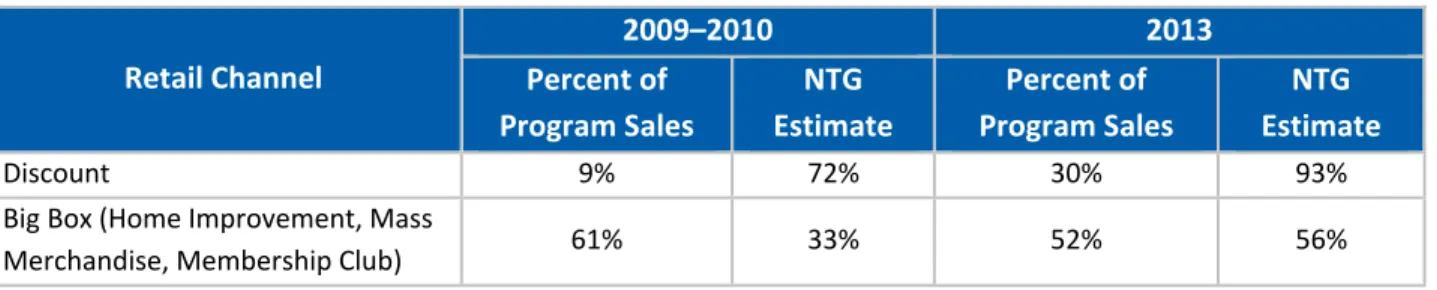
Table 2 and Table 3 show the major shifts in program shares for standard and specialty CFLs between the 2009–2010 and 2013 program years. Standard CFLs more than tripled their program shares in the discount channel over this period, while specialty CFLs about doubled their program shares in this channel. The tables also show large differences in NTG ratios between discount channels and big box channels.
3 The Massachusetts Point‐of‐Sale (POS) Modeling Research study has collected some POS data indicating that the
market share of halogen bulbs in California has increased sharply while the market share of CFLs has declined. More details on this can be found in POS Modeling Research report.
4 While the 2013 program shipped most bulbs it designated as “HTR bulbs” through the discount channel, it also
sold these bulbs through other channels. For example, the 2013 program sold the following percentages for HTR standard CFLs: 72% through the discount channel; 21% through the “other” channel (including distribution of bulbs through cultural advocacy organizations and cultural events); 7% through the grocery channel; and a very small quantity (less than 1%) through the mass merchandise channel. Stores in the grocery and mass merchandise channels may be designated as selling HTR bulbs if they predominantly serve particular ethnic or low‐income communities. Comments from the PAs on the draft version of this report also indicated that the lower percentage of program sales through Big Box stores in 2013 was also an effect of the program reducing program sales to some of its big box retail partners in order for them to participate in the market lift pilot program.
Table 2. Program Share of Standard CFLs in Discount and Big Box Channels, 2009–2010 vs. 2013 Retail Channel 2009–2010 2013 Percent of Program Sales NTG Estimate Percent of Program Sales NTG Estimate Discount 9% 72% 30% 93%
Big Box (Home Improvement, Mass
Merchandise, Membership Club) 61% 33% 52% 56% Note: The “percent of program sales” estimates exclude the “other” retail channel.
Table 3. Program Share of Specialty CFLs in Discount and Big Box Channels, 2009–2010 vs. 2013
Retail Channel 2009–2010 2013 Percent of Program Sales NTG Estimate Percent of Program Sales NTG Estimate Discount 14% 79% 27% 99%
Big Box (Home Improvement, Mass
Merchandise, Membership Club) 75% 47% 62% 41% Note: The “percent of program sales” estimates exclude the “other” retail channel.
The 2009–2010 NTG estimate did not include LED sales to compare to the 2013 NTG estimate for LED sales (and only store managers provided the 2011–2012 estimate). Comments from market actors, however, indicated that while LED prices fell somewhat, they remained high in comparison to other bulb types; therefore, program discounts remain important.
In reviewing a draft version of this report, one commenter expressed surprise that the NTG ratios for specialty CFLs in 2013 were slightly lower than those for standard CFLs. However, there are a few factors that might explain this including:
1) Standard CFLs facing competition from EISA‐compliant halogens. As mentioned above, some lighting suppliers view the program discounts as important for keeping CFLs cost competitive with EISA‐compliant halogen bulbs. Because most of the EISA‐compliant halogens being sold offer no special functionality, they are less likely to compete with specialty CFLs that offer enhanced performance features such as dimmability, three‐way capability, etc. However, they are direct competitors with standards CFLs as well as some specialty A‐lamps.
2) Demand for specialty CFLs has been shown to be more inelastic than demand for standard CFLs. A 2011 study of the 2010 Massachusetts ENERGY STAR lighting program found that consumer demand for specialty CFLs was more inelastic than it was for standard CFLs. Such inelastic demand would at least partially explain a lower NTG ratio for specialty CFLs compared to
standard CFLs since specialty CFLs customers would be less likely to change their purchasing behavior if the program discounts went away.5
3) Specialty CFLs are becoming a more familiar technology. While specialty CFLs are certainly newer than standard CFLs, they have been commonly available in retail stores long enough where most customer unfamiliarity barriers have likely been overcome.
4) The Massachusetts program sold a higher percentage of specialty CFLs through big box stores. As shown above, a higher percentage (62%) of the specialty CFLs in the 2013 Massachusetts program were sold through big box retailers compared to standard CFLs (52%). Home improvement stores account for a large percentage of these lighting sales through big box stores. One explanation for the lower NTG ratios for specialty CFLs in the home improvement channel is that home improvement stores traditionally serve as “destination stores” for lighting purchases. For example, if a customer makes a special trip to a home improvement store with the intention of buying a specialty bulb, they are unlikely to walk away from these bulbs simply due to prices being higher than they would prefer. However, higher prices would more likely deter them in other shopping environments (e.g., discount or grocery stores), where lighting purchase decisions tend to be more of an “impulse buy.”
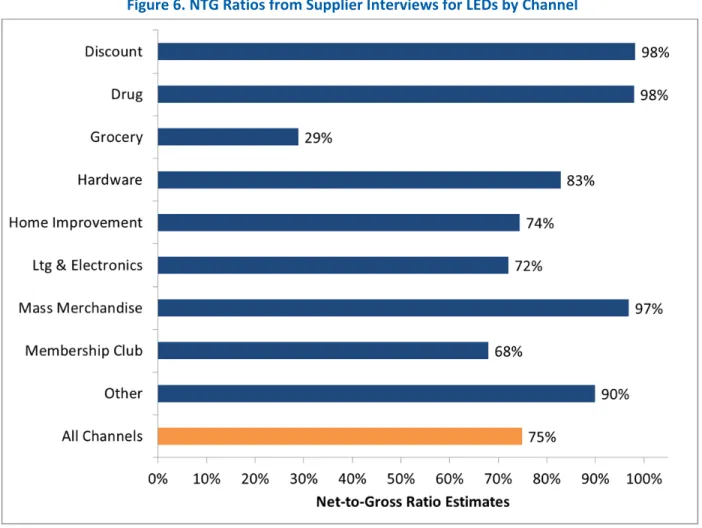
In addition to providing NTG ratios for each bulb type at the program level, we calculated NTG ratios for each program at the retail channel level. Figure 2 through Figure 6 show great variability for NTG ratios by channel for non‐HTR CFLs and LEDs, with consistently high NTG ratios among channels for HTR CFLs. This report’s detailed findings section provides more information regarding how we calculated these channel‐specific NTG ratios.
5 “One of the more unexpected conclusions from this evaluation is the fairly consistent finding that consumers
are more sensitive to the price of spiral CFLs than they are to the price of specialty CFLs. Price elasticity, realization rates, and NTG ratios are all lower for specialty CFLs than they are for spiral CFLs. Put another way, consumers appear willing to buy specialty CFLs at a fairly high price point. This situation is likely due to the early stage of the specialty CFL adoption/diffusion cycle, lack of consumer familiarity with what constitutes a ―fair‖ price for specialty CFLs, and the overall higher prices of special es compared to spirals. Earlier, we suggested that lower realization rates for specialty products may reflect retailers and manufacturers noticing the inelastic prices of specialty CFLs and retaining more of the incentive for themselves than they do for spiral CFLs.” (Massachusetts ENERGY STAR® Lighting Program: 2010 Annual Report, Volume 1; Submitted by: NMR Group, Inc., KEMA, Cadmus Group, Inc., Tetra Tech; Submitted to Energy Efficiency Advisory Council
Consultants, Cape Light Compact, NSTAR, National Grid, Unitil, Western Massachusetts Electric; June 13, 2011; p. 72).
Figure 2. NTG Ratios from Supplier Interviews for Non‐HTR Standard CFLs by Channel
Figure 3. NTG Ratios from Supplier Interviews for HTR Standard CFLs by Channel
Figure 4. NTG Ratios from Supplier Interviews for Non‐HTR Specialty CFLs by Channel
Figure 5. NTG Ratios from Supplier Interviews for HTR Specialty CFLs by Channel
Figure 6. NTG Ratios from Supplier Interviews for LEDs by Channel
In March 2015 some of the PA representatives requested that the evaluation team add some NTG ratios to the report which were calculated at the retail channel grouping level. They requested these new NTG ratio calculations to assist them in future program planning efforts. The idea was to have NTG ratios that were more granular than the program level NTG ratios but less granular than the retail channel where the sample of NTG estimates is very small for some channels. The channel groupings were as follows:
Home Improvement: This grouping included all non‐HTR standard CFLs sold in the home improvement channel
HTR: This grouping included all HTR standard CFLs plus non‐HTR standard CFLs sold through the discount channel
All Other: This grouping included all non‐HTR standard CFLs except those sold in the home improvement or discount channels
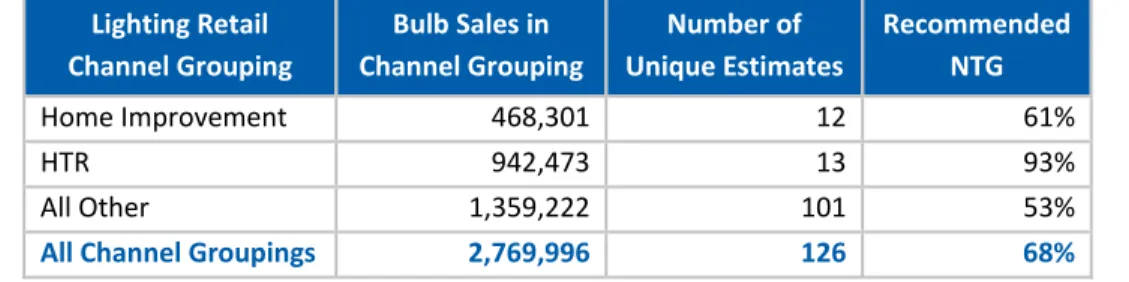
Table 4 shows the NTG ratio estimates at the channel grouping level for standard CFLs (similar tables for specialty CFLs and LEDs can be found in the main body of the report). 6
Table 4. Channel Grouping NTG Ratio Estimates for Standard CFLs Sold through the 2013 Program
Lighting Retail Channel Grouping Bulb Sales in Channel Grouping Number of Unique Estimates Recommended NTG Home Improvement 468,301 12 61% HTR 942,473 13 93% All Other 1,359,222 101 53%
All Channel Groupings 2,769,996 126 68%
As with all NTG‐estimation methodologies, the market actor self‐report methodology presents limitations, some of which concern possible biases that lighting market actors might have and which may cause them to provide NTG estimates higher or lower than what would be the case without these biases. Other limitations concern certain market actors’ possible knowledge gaps regarding the market. These threats to validity are discussed in detail below in the methodology section.
6
The NTG estimates labeled “All Channel Groupings” for standard CFLs, specialty CFLs, and LEDs are slightly different than those presented in Table 1. This is because, using the supplier self‐report methodology, aggregated NTG estimates vary based on the way that different channels (and thus individual estimates) are grouped together.
Introduction
This report presents the Residential Evaluation Team’s estimates of net‐to‐gross (NTG) ratios for CFL and LED bulbs sold through the Massachusetts ENERGY STAR upstream lighting program in 2013 using the supplier self‐report methodology. We calculated these NTG ratios using responses to in‐depth interviews and computer‐aided telephone interview (CATI) surveys, which DNV GL and its
subcontractors conducted with market actors that participated in the Massachusetts program. These market actors included the following:
14 lighting manufacturers and suppliers, which accounted for over 86% of sales by manufacturers identified in the program tracking databases;
Four high‐level lighting buyers, representing large national or regional retailers in the program, accounting for over 26% of the program sales; and
224 managers of stores selling lighting products through the program, 79 from HTR‐designated stores (explained in the next section).
We completed the in‐depth interviews with lighting manufacturers and high‐level retailer buyers from May to July 2014 and the store manager CATI surveys from June to July 2014.
Note that this supplier self‐report methodology is only one of a number of methodologies that will be used to calculate NTG ratios for the Massachusetts ENERGY STAR upstream lighting program. The other three approaches include a demand elasticity model, point‐of‐sale data analysis, and purchase estimates from comparison areas.
Program Attribution
This report discusses the findings from the lighting manufacturer/retailer interviews and store manager surveys concerning program attribution (NTG ratios) for standard CFLs, specialty CFLs, and LEDs in Massachusetts.
The interviews and surveys defined standard CFLs as: “Bulbs that have spiral shapes, are not covered, and which do not have any special features such as dimmability or three‐way capability.” We defined specialty CFLs as those: “…that do not have a spiral shape, like A‐shape or globe‐shape lamps, or CFLs with special features, such as dimmable, three‐way, or reflector CFLs.”
We calculated separate attribution estimates for bulbs sold through stores characterized as selling to a hard‐to‐reach (HTR) market and stores not characterized as such. HTR‐designated stores included the majority of stores characterized as “discount” retailers (such as dollar stores and other discount stores), ethnic grocery stores, charity/thrift stores, bulbs sold at food banks and ethic/immigrant/low‐income advocacy community centers, and a few other stores targeting low‐income citizens or certain ethnic communities.7
Methodology
This section describes our approach for collecting the data and for calculating and weighting the NTG ratios from supplier self‐reports—a methodology similar to that used for the program in 2011 and 2013.
Collecting
Data
We calculated our NTG ratio estimates based on responses to NTG questions that we collected from lighting manufacturers, retail lighting buyers, and store managers.8 For lighting manufacturers and retail buyers, we attempted to complete in‐depth interviews with a census of program participants. For store
7 When designing this study, the PAs indicated to the Team that the definition of HTR stores was simply that
they sold bulbs designated as HTR in the program data tracking system. The implementer decided which stores and bulbs were HTR. A review of the 2013 data tracking system revealed that the stores described in the text above are the only ones designated as selling HTR bulbs for that year.
8 To ensure we were reaching knowledgeable respondents among the store managers, we used retailer contact
names provided by the program implementer Lockheed Martin and also used a number of screening questions in the survey including: “I3B Who would be familiar with sales and stocking trends for lighting products in your store?”, “I4. Hello I am from Tetra Tech. I am calling on behalf of [PA Name and] the Massachusetts ENERGY STAR lighting program. According to our records, your store recently participated in this program by selling discounted CFLs or LED bulbs from <SUPPLIER>. Are you familiar with this program?”, “I5. [IF “NO” TO I4] Who would be familiar with this program?” “I6AB. About how many months or years have you been working with the sale of lighting products?”, “I7. Now I’m going to use the abbreviation “CFL” to refer to compact fluorescent lamps. Are you the primary person who decides how many discounted CFLs your store(s) receives in shipments from <SUPPLIER> as part of this Massachusetts ENERGY STAR lighting program?“ , “I8. [IF “NO” TO I7]Who is the primary decision‐maker?”
managers, we used a sample design similar to that used in past years, allowing comparability across years. We stratified the sample frame by retail channel.
The number of target completed surveys for each channel drew upon on three criteria: 1. The percentage of total bulb sales accounted for by that channel.
2. The number of unique store locations in the sample frame for that channel.
3. Whether the retail channel served HTR customers (this included an oversample as these stores proved of particular interest to the Energy Efficiency Advisory Council and Program
Administrators).
The retail channels’ in‐store manager sample frame included the following:
1. Discount stores typically selling products at prices lower than those of traditional retail outlets. 2. Drug stores selling over‐the‐counter medications (and perhaps selling paper products,
beverages, and a selection of grocery items).
3. Grocery stores typically selling perishable and non‐perishable food items and stocking a small selection of household goods.
4. Large Home Improvement stores, a class of hardware stores typically occupying warehouse‐style spaces (with many including dedicated outdoor garden centers).
5. The Lighting and Electronics channel group lighting retailers with electronics retailers. The former typically stock light fixtures, ceiling fans, and replacement lamps, while the latter sell home electronics and appliances.
6. Mass Merchandise stores typically stocking a large assortment of goods (including clothing, housewares, and sometimes food products and medications) at competitive prices.
7. Membership Clubs, typically warehouse‐style stores stocking a wide variety of grocery and household items at lower prices. Consumers typically pay an annual membership fee to access these lower prices.
8. Small Hardware stores selling a variety of home repair, maintenance, and improvement products.
Table 5 shows the original sample frame began with 763 stores, an amount adjusted downward to 623 for reasons shown in the table. Despite the reduced sample frame, we hit all targets and completed more surveys (224) than originally targeted (221). The table shows overall response rates of 29%, ranging from a 20% response rate for the mass merchandise channel to a 42% response rate for the hardware channel.
Table 5. Sampling Disposition for Store Manager CATI Surveys
1
Attempts were made to convert all soft refusals.
2
An average of 4.35 contacts per active case were made.
3
Number of completed surveys divided by Adjusted Sample Size
4
Number of completed surveys divided by Sample Size Source: Tetra Tech
Calculating
NTG
Ratios
from
Supplier
Interviews
To estimate NTG ratios, we asked manufacturers, retail lighting buyers, and store managers a series of questions about their sales of each bulb type in the program’s absence. The store manager survey included the following relevant questions (the lighting manufacturers and retail buyers interview guides used similar questions):
A3. During 2013 the Massachusetts ENERGY STAR program provided average buydown discounts of about [DISCOUNT AMOUNT] for every [BULB TYPE] bulb sold through the program. If these discounts had not been available, do you think your store(s) would have sold any of these types of [BULB TYPE] in the 2013 period?
A4. If these average buydown discounts offered by the program of [DISCOUNT AMOUNT] per [BULB TYPE] bulb were not available, do you think your sales of these bulbs would be about the same, lower, or higher?
Channel Discount Drug Grocery Hardware
Home Improvement Lighting and Electronics Mass Merchandise Membership Club Total Sample Size 292 30 192 72 60 25 60 32 763 Fax/data line 3 1 1 0 0 0 0 0 5 Bad number 10 0 7 1 0 0 1 0 19
Does not recall participation 9 3 7 0 0 0 2 0 21
Ineligible, no respondent 41 10 33 1 2 0 8 0 95
Adjusted Sample Size 229 16 144 70 58 25 49 32 623
Hard Refusal 1 0 1 1 0 0 0 0 3
Soft Refusal1 14 1 8 14 7 2 1 3 50
Incompletes (partial interviews) 9 0 9 5 6 0 7 2 38
Immediate hang‐up 0 0 0 0 0 0 0 0 0
Language barrier/non‐English 0 0 3 0 0 0 0 0 3
Referred to corporate 92 3 35 3 5 0 17 8 163 Active2 36 4 40 17 16 13 12 4 142 Completed Surveys 77 8 48 30 24 10 12 15 224 Target Completes 77 6 48 29 24 10 12 15 221 Completes Needed 0 ‐2 0 ‐1 0 0 0 0 0 Percent to Target 100% 133% 100% 103% 100% 100% 100% 100% 101% Cooperation Rate3 33.6% 50.0% 33.3% 42.9% 41.4% 40.0% 24.5% 46.9% 36.0% Response Rate4 26.4% 26.7% 25.0% 41.7% 40.0% 40.0% 20.0% 46.9% 29.4%
A5. By what percentage do you estimate your store’s sales of these [BULB TYPE] bulb would be lower during this 2013 period if the Massachusetts ENERGY STAR program discounts averaging [DISCOUNT AMOUNT] per [BULB TYPE] bulb were not available?
A6. I want to make sure I understand you correctly when you say your store’s sales of [BULB TYPE] bulbs would be [% FROM QUESTION A5] lower without the program buydown discounts. So you’re saying that if you sold 100 CFLs in a given week with the program discounts, you would have only sold [100 ‐ (% FROM QUESTION A5 * 100)] that week without the program discounts. Is this correct? If respondents responded “no” to question A3 (e.g., they would not have sold any of that bulb type in the program’s absence), they received an assigned NTG ratio of 100%, and the surveys skipped questions A4 through A6.
If, in responding to A4, they said their sales would have been higher without the program, we asked follow‐up questions similar to A5 and A6, but probed regarding the size of increased sales absent the program. Only three of 224 store managers (1%) said their sales would have increased without the program. When asked why they believed the existence of the program lowered their sales, their
responses indicated they thought the program had little effect on sales. We assigned these respondents NTG ratios of 0%.
Ratio assignments follow for each combination of responses to the questions above:
If A3 = “no”: NTG ratio = 100%
If A3 = “yes” and A4 = “same”: NTG ratio = 0%
If A3 = “yes” and A4 = “lower”: NTG ratio = % from A5
If A3 = “yes” and A4 = “higher”: NTG ratio = 0%
If A3 = “don’t know,” respondents were still asked A4. If they said “don’t know” to A4 or A5, they were marked as not being able to provide a NTG ratio.
If a given market actor sold multiple types of bulbs through the program, we asked this battery of NTG questions separately for each bulb type. Because lighting manufacturers sold bulbs through multiple retail channels, we asked the NTG questions separately for the retail channels they participated in. To limit the survey’s length, however, not all manufacturers were asked to provide an estimate for each bulb type‐channel combination they participated in. For manufacturers supplying many different retail channels, we prioritized obtaining NTG estimates from retail channels with the greatest program sales volumes.
Weighting
NTG
Ratios
from
Supplier
Interviews
In most cases, we used sales through the program that the estimates represented to weight each market actor category relative to each other. For example, if the sales‐weighted NTG estimate from manufacturers accounted for 100,000 standard CFL sales and the sales‐weighted NTG estimate from store managers accounted for 50,000 standard CFL sales, the manufacturer estimate would carry twice the weight of the store manager estimate.
In a few cases, we selected NTG ratio estimates that we thought originated from the respondents most knowledgeable about the program’s effect on that retail channel. For example, we only used
manufacturer and retail buyer NTG estimates for specialty CFLs sold through discount/HTR stores. Our rationale for doing this is based on interview responses from lighting manufacturers and retail buyers who reported that they would not be selling bulbs in these discount stores without the program discounts. In the case of the dollar stores, the dollar price limit precludes the sales of even the standard CFLs without program discounts. In past interviews we have conducted with lighting manufacturers, the lowest reported production costs for standard Energy Star CFLs have been in the $1.20‐$1.25 per bulb range. In addition, our in‐depth interviews with retail buyers of charity stores have revealed that they would also not sell these energy‐efficient bulbs in absence of the program discounts. Finally, the manufacturer who supplied the largest retailer in the discount channel that was neither a dollar store nor a charity shop also reported that all their sales through this retailer would disappear in the absence of the program.9 As we discuss in the following sections, the store managers may lack this market knowledge and still estimate that they would have sold some of these bulbs even though their suppliers and buyers indicated that these bulbs would have never arrived in the stores.
It should be noted that our decision to exclude the store manager NTG estimates for the discount channel does not mean that we should be equally skeptical about store managers NTG estimates in other retail channels. As noted, we take great effort to identify knowledgeable respondents and we assume that the store managers we survey are reasonably good observers of what their bulb sales are like when the program is in effect and when it is not, which is the foundation of this particular NTG methodology. The problem with the store manager NTG estimates in the discount channel is that the estimators likely lack the market knowledge, for example, that it cost $1.25 to manufacture a standard CFL.
Now one could argue that the discount store managers should have noticed that the bulbs disappeared when the program was not available and therefore should have provided NTG estimates close to 100%.
9
One of the commenters on the draft report was interested in knowing how many retailers in the discount channel were dollar stores or charity stores. The retailers that had “dollar” or “99 cents” or “98 cents” in their names accounted for 60% of the stores and 38% of the program CFL sales (both standard and specialty bulbs) in the discount channel. The charity stores made up 13% of the stores and 10% of the program CFL sales in the discount channel. For the remaining 27% of stores in the discount channel we could not tell from the store names whether or not they had some kind of dollar limit. However, one might reasonably assume that competitive pressures from the dollar stores and charity stores would constrain their price levels.
First the discount store manager NTG estimates were reasonably close to 100% (83%‐98% depending on bulb type). In addition, our interviews over the years with discount store suppliers, retailers, and store managers have revealed that their general product offerings (not just light bulbs) are very changeable depending on what is cheaply available at the time from manufacturers and wholesalers. Therefore some store managers who noticed CFLs disappearing from their shelves when the program was in dormancy might think this is just a normal fluctuation in product offerings and not due to inherent economic barriers.
The final weighting approach used (although infrequently) was the simple average NTG estimate, computed by weighing each market actor category equally. We used this method when an outlying NTG estimate from one manufacturer would have heavily outweighed the more moderate estimates from several store managers under a sales‐weighted approach. Throughout this report, we present recommended NTG ratios and NTG ratios resulting from a straight average of NTG ratios from the manufacturers, store managers, and retail buyers (if available).
Threats
to
Validity
As with all NTG‐estimation methodologies, the market actor self‐report methodology presents limitations, some of which concern possible biases that lighting market actors might have and which may cause them to provide NTG estimates higher or lower than what would be the case without these biases. Other limitations concerned certain market actors’ possible knowledge gaps regarding the market.
Two types of potential bias could affect the self‐report NTG methodology used:
The gaming or “don’t kill the golden goose” bias: This potential bias occurs when market actors purposely exaggerate how much their lighting product sales would decrease in the program’s absence, given their desire to continue receiving program discounts/rebates.
The green retailer bias: This potential bias occurs when market actors underestimate how much their sales would drop in the program’s absence. This may result from inflated confidence in their company’s ability to market environmentally friendly products. This bias might be considered a variation of the “social desirability bias”—a well‐known concept in program evaluation literature.
In theory, the gaming bias and green retailer bias work in opposite directions. However, the relative strengths of these biases and the degree that they offset each other remain unclear.
In the Massachusetts program, market actors with the strongest motives to engage in the gaming bias receive the greatest direct benefits of program discounts. For program bulbs receiving buydown discounts, this would be the manufacturer.10
The degree that gaming bias plays a role in the NTG estimate from supplier self‐reporting depends on market actors knowing what that “game” is (i.e., that overestimating the decline in lighting product sales in the program’s absence would increase the likelihood that the product continues to receive program rebates/discounts). Because nearly all lighting manufacturers and high‐level retail buyers interviewed participated in multiple rebate/discount programs across the country, they likely know what the “game” is, whether or not they choose to play it. Most store managers, however, likely do not know what the “game” is.
By definition, retailers would be the most likely market actors to engage in the green retailer bias. Of the two types of retailers interviewed for this evaluation (e.g., retail buyers and store managers), we
considered retail buyers more likely to engage in the green retailer bias, partly due to retail buyers’ greater knowledge (in comparison to store managers) regarding corporate environmental policies or campaigns. Additionally, some store managers represented independent stores or small chains that did not have corporate green policies.
Another potential threat to validity arose from some market actors simply lacking the broader market knowledge to competently assess what would happen to product sales in the program’s absence. We reasoned lighting manufacturers had the greatest potential to accurately predict what would happen to sales without the lighting discount program, given (as explored in more detail through multiple, similar evaluations we have conducted) manufacturers have practical reasons for making such predictions accurately.
Every year (and in some cases, even more often), lighting manufacturers submit proposals to the Upstream Lighting Program managers, indicating how many of each product they think they can sell through each retail channel. Overestimating these sales means dealing with unhappy retail partners and program managers, neither of whom like overstocks. Of course, just because lighting manufacturers can more accurately predict what their sales would be without the program does not mean they will do so (per the previous discussion of the gaming bias).
10 While we cannot know if respondents game their responses, we did conduct a sensitivity analysis where we
examined how overall NTG ratios would change if we eliminated the NTG estimates of manufacturers that estimated 100% NTG for all retail channels they served, including non‐HTR channels. Removing these estimates caused the overall (HTR and non‐HTR combined) NTG ratio for standard CFLs to move from 70% to 62%, the overall NTG ratio for specialty CFLs to move from 67% to 65%, and the overall NTG ratio for LEDs to move from 78% to 63%.
As discussed, for the CFL supply stream going to stores with a $1.00 price limit, charity shops, and other discount stores, lighting manufacturers and high‐level retail buyers for this stream said those sales would have completely ceased without the program discounts. Yet some store managers thought they would continue to sell some of those bulbs, and, in some cases, thought the program had no or virtually no effect on their sales.
To the degree possible, we tried to mitigate these threats to validity. For example, regarding discount channel NTG ratios for HTR sales, we did not use store manager estimates in the final calculations, given the market knowledge barriers cited above.
In general, however, as manufacturers’ and retailers’ biases theoretically work in opposite directions, we developed channel‐specific NTG estimates that incorporated estimates from both manufacturers and retailers. In determining recommended NTG ratios for each bulb type and channel, we also carefully paid attention to situations where a NTG estimate for a given market actor category would be heavily influenced by a few estimators producing NTG estimates very different from their fellow market actors. This especially proved true when outlier estimators represented large weights due to their high volumes of bulb sales. In such cases, we chose a different averaging method (e.g., a straight average of all NTG estimates instead of a sales‐weighted average) to mitigate these outlier effects.
NTG
Ratio
Estimates
from
Supplier
Interviews
This section presents NTG estimates for the various lighting technologies sold through the program, including ratios for all retail lighting channels. The discussion, however, addresses only the highest‐ selling channels for each bulb type.
Standard
CFLs
This subsection shows our calculated NTG ratios for standard CFL bulbs, both for HTR‐designated stores and non‐HTR stores. In 2013, the program focused slightly less on standard CFLs, with program‐
supported sales decreasing by 20% (from over 3.5 million to roughly 2.8 million bulbs) since the 2011 evaluation.
Non
‐
HTR
Standard
CFLs
Table 6 shows channel‐specific and program‐wide NTG estimates from supplier interviews for standard CFLs sold through non‐HTR stores. Sales exhibited fairly even distribution across the major retail channels, with five of the nine channels each accounting for 10% to 25% of total sales. Manufacturers, retail buyers, and store managers willing to provide NTG estimates for this bulb type accounted for, respectively, 73%, 11%, and 19% of total sales of these bulbs through the program. Table 6 presents the channel‐specific “recommended NTG” ratios, all of which were calculated using a sales‐weighted
Table 6. Channel‐Specific and Program‐Wide NTG Ratio Estimates for Non‐HTR Standard CFLs
Sold through the 2013 Program
Lighting Retail Channel Bulb Sales in Channel Number of Unique Estimates
NTG Ratio Estimates from Supplier Interviews
(Weighted by Program Sales)
Manufacturers Retail Buyers Store Managers Simple Avg. NTG Recommended NTG Discount 24,064 4 100% None 77% 88% 81% Drug 21,200 5 80% None 54% 67% 80% Grocery 177,082 36 56% None 62% 59% 57% Hardware 222,700 27 62% 18% 32% 37% 48% Home Improvement 468,301 12 65% None 39% 52% 61% Lighting and Electronics 14,437 7 93% None 57% 75% 85% Mass Merchandise 417,745 10 45% None 71% 58% 47% Membership Club 406,244 15 66% 60% 44% 57% 58%
Other 99,814 1 100% None None 100% 100%
All Channels 1,851,587 117 58%
As with other bulb types, the smallest channels in terms of total sales (generally those with 25,000 or fewer bulbs sold) had the highest overall “recommended” estimates for program attribution. Generally, using this NTG estimation methodology, manufacturers produced higher estimates than store managers, possibly due to the potential biases previously discussed. However, manufacturers produced lower estimate for the grocery and mass merchandise channels than did their store manager counterparts. Overall, a program‐wide recommended NTG estimate for non‐HTR standard CFLs of 58% resulted. For the channel with the largest volume of sales, the home improvement channel, store managers produced remarkably consistent estimates, with six of 10 estimating a NTG ratio between 20% and 40%. This range, however, proved significantly lower than the 65% estimate from two manufacturers, where a single large manufacturer dominated. This resulted in a channel‐wide recommended NTG ratio of 61%. Among channels selling the largest volume of bulbs, the mass merchandise channel produced the lowest recommended NTG estimate (45%). While the two manufacturers providing estimates remained fairly consistent, store managers presented polarized opinions, with two of eight managers providing an estimate attributing all of their sales to the program, and five of eight providing NTG estimates of 30% and lower.
In terms of the hardware channel, one of the 22 store managers accounted for the great majority of sales and provided a relatively low NTG estimate, heavy influencing the sales‐weighted store manager
estimate. Store managers in the hardware channel produced a straight average of 50%. Using this straight average estimate for store managers would have increased the recommended NTG ratio to 53% for the channel as a whole.
Grocery stores typically allocate little shelving space for lighting products; so, while many grocery stores participated in the MA lighting program (aggregate sales were the highest among all channels), average sales per store were relatively low. Market actors in general did not view the grocery channel as a “destination” for lighting purchases, but rather as a place where shoppers purchased light bulbs on impulse or in reaction to sales. Qualitative responses from many store managers were consistent with this view, and store managers overall produced relatively high NTG estimates compared to higher‐sales channels. More than half (17 of 33) of store managers providing a NTG estimate said they would not have sold standard CFLs without the program. An overall recommended NTG ratio of 57% resulted for the grocery channel.
As with other bulb types, standard CFLs sold through the “other” retail channel received a very high NTG estimate. Although this estimate derived from a single manufacturer, we feel comfortable using the result as this channel’s sales predominantly came from schools, malls, office buildings, fairs, and other events. These bulb distributions likely would not have been coordinated in the program’s absence.
HTR
Standard
CFLs
Table 7 shows channel‐specific and program‐wide NTG estimates for standard CFLs sold through HTR stores, with more than two‐thirds of those bulbs sold through the discount channel. The “other” channel (primarily consisting of cultural advocacy organizations and cultural events such as festivals) and the grocery channel (largely ethnic grocery stores) sold most of the remaining bulbs.
Table 7. Channel‐Specific and Program‐Wide NTG Ratio Estimates for HTR Standard CFLs
Sold through the 2013 Program
Lighting Retail Channel Bulb Sales in Channel Number of Unique Estimates
NTG Ratio Estimates from Supplier Interviews
(Weighted by Program Sales)
Manufacturers Retail Buyers Store Managers Simple Avg. NTG Recommended NTG Discount 659,055 6 93% 100% None 96% 93%
Grocery 59,804 1 100% None None 100% 100%
Mass
Merchandise 2,668 1 100% None None 100% 100%
Other 196,882 1 100% None None 100% 100%
Manufacturers and retail buyers represented all attribution estimates for these standard CFLs
(accounting for 74% and 5% of program sales, respectively), as we did not obtain estimates from store managers for these bulbs.11
As discussed previously, in the Massachusetts lighting program, dollar stores and charity retailers (e.g., Goodwill Industries, Salvation Army Pantry) made up roughly half of the HTR discount channel, which accounted for most HTR standard CFL sales. Many years of in‐depth interviews with lighting
manufacturers and retail buyers supplying dollar stores and charity retailers have found most of these stores will not stock such bulbs unless they receive them free (after program discounts). At most, the stores might be willing to pay $0.50 per bulb, which, for a dollar store would allow “keystone pricing” (i.e., a 100% markup over the wholesale price). As lighting manufacturers reported minimum production cost for a standard CFL of about $1.25 per bulb, these HTR stores clearly could not stock these CFLs without program discounts. Additionally, as discussed, one might reasonably assume that competitive pressures from the dollar stores and charity stores would constrain the price levels of the remainder of the discount stores selling HTR bulbs.
Yet as discussed in this report’s Methodology section, a few HTR store managers remained unaware of this economic reality and still estimated they would have sold some CFLs in the program’s absence. For this reason, our recent (2014) evaluation of the California Upstream lighting program did not include store manager NTG estimates in our recommended NTG ratio for the discount channel. We followed the same path for the Massachusetts HTR standard bulbs, although, in this case, did so out of necessity as well as choice.
All channel‐specific “recommended NTG” ratios in the table are directly derived from manufacturer estimates. At 95%, HTR stores produced a much higher overall NTG estimate than non‐HTR stores.
Aggregated
Standard
CFLs
As mentioned previously, in March 2015 some of the PA representatives requested that the evaluation team add some NTG ratios to the report which were calculated at the retail channel grouping level. These channel groupings are as follows:
11 We obtained the store manager NTG ratio for HTR standard CFLs in the 2013 Massachusetts store manager
survey (covering program years 2011–2012), resulting in 88% for the discount/HTR channel. The 2011 Massachusetts store manager survey (covering program years 2009–2010) resulted in 83%. In 2013, the program renamed tracking data for these standard CFLs sold through HTR channels as “HTR bulbs”; unfortunately, we did not change our CATI programming instructions to account for this name change. Consequently, the standard CFL NTG question battery skipped HTR store managers. We did obtain 2013 NTG ratios for specialty bulbs in the HTR channels (where the bulb name did not change). As discussed, we obtained 2013 NTG estimates for standard CFLs in non‐HTR channels.
Home Improvement: This grouping includes all non‐HTR standard CFLs sold in the home improvement channel
HTR: This grouping includes all HTR standard CFLs plus non‐HTR standard CFLs sold through the discount channel
All Other: This grouping includes all non‐HTR standard CFLs except those sold in the home improvement or discount channels
Table 8 shows the NTG ratio estimates at the channel grouping level for standard CFLs. As the table shows, twice as many bulbs were sold through the HTR channel grouping than through home
improvement stores, and the NTG ratio for these bulbs was considerably higher (93% vs. 61%). The “All Other” channel grouping consisted largely of bulbs sold through the mass merchandise and membership club channels, which had lower NTG estimates in general.
Table 8. Channel Grouping NTG Ratio Estimates for Standard CFLs Sold through the 2013 Program
Lighting Retail Channel Grouping Bulb Sales in Channel Grouping Number of Unique Estimates Recommended NTG Home Improvement 468,301 12 61% HTR 942,473 13 93% All Other 1,359,222 101 53%
All Channel Groupings 2,769,996 126 68%
Specialty
CFLs
This subsection shows calculated NTG ratios for specialty CFL bulbs, derived through HTR‐designated stores and non‐HTR stores. Specialty CFLs presented a greater program focus in 2013 than in the past, with sales increasing by 90% since the 2011 evaluation (from less than 900,000 to more than 1.6 million bulbs).
Non
‐
HTR
Specialty
CFLs
Table 9 shows channel‐specific and program‐wide NTG estimates from supplier interviews for specialty CFLs sold through non‐HTR stores. Sales of specialty CFLs distributed less evenly than standard CFLs across channels, with the home improvement and “other” channels accounting for 78% of sales.
Table 9. Channel‐Specific and Program‐Wide NTG Ratio Estimates for Non‐HTR Specialty CFLs
Sold through the 2013 Program
Lighting Retail Channel Bulb Sales in Channel Number of Unique Estimates
NTG Ratio Estimates from Supplier Interviews
(Weighted by Program Sales)
Manufacturers Retail Buyers Store Managers Simple Avg. NTG Recommended NTG Discount 4,109 6 100% None 97% 98% 98%
Drug 1,368 1 80% None None 80% 80%
Grocery 40,028 25 73% None 89% 81% 76% Hardware 88,836 24 94% 30% 45% 56% 56% Home Improvement 655,752 16 41% None 29% 35% 39% Lighting and Electronics 7,635 10 94% None 86% 90% 92% Mass Merchandise 78,521 8 38% None 66% 52% 40% Membership Club 69,447 14 66% 67% 53% 62% 63% Other 358,099 4 95% None 100% 97% 95% All Channels 1,303,795 108 58%
As with other bulb types, the smallest channels in terms of total sales (generally with 25,000 or fewer bulbs sold) had some of the highest overall “recommended” estimates for program attribution. As with standard CFLs, the manufacturers produced lower estimates for the grocery and mass merchandise channels than did their store manager counterparts. The manufacturer, retail buyer, and store manager NTG estimates accounted, respectively, for 62%, 5%, and 11% of total sales for these bulbs.
A sales‐weighted approach served as the default method used for each “recommended NTG” ratio in Table 9, with one noted exception (we used a simple average for the hardware retail channel). Overall, a program‐wide recommended NTG estimate for non‐HTR specialty CFLs of 58% resulted, the same as for non‐HTR standard CFLs.
The highest‐selling channel for specialty CFLs, the home improvement channel, saw the second‐lowest attribution estimates among all channels, especially from the 13 store managers, who attributed less than one‐third of their collective sales of specialty CFLs to the program. Home improvement store managers also reported the highest average sales per store surveyed among all the store types. One explanation for the lower NTG ratios for specialty CFLs in the home improvement channel is that home improvement stores traditionally serving as “destination stores” for lighting purchases. For example, if a customer makes a special trip to a home improvement store with the intention of buying a specialty bulb, they are unlikely to walk away from these bulbs simply due to prices being higher than
they would prefer. However, higher prices would more likely deter them in other shopping
environments (e.g., discount or grocery stores), where lighting purchase decisions tend to be more of an “impulse buy.” Shopper intercept research we have conducted in California has found lighting
purchasers in home improvement stores to be less price sensitive than purchasers in other retail channels.
Due to their higher sales volumes, they may have believed they would continue to sell those bulbs without the program (whether or not true). The home improvement channel produced significantly higher sales of specialty CFLs than standard CFLs (655,000 vs. 486,000), the only channel besides “other” in which this was the case.
Another relatively high‐volume channel, hardware, produced the least consistent estimates across different market actors. Opinions were split within the store manager estimates, with the smaller stores in terms of sales giving higher estimates (generally 60% and above) and the larger stores giving lower estimates (generally 50% and lower). Additionally, the sales‐weighted manufacturer estimate proved much larger than the retail buyer or store manager ratios—a disparity primarily caused by one relatively large manufacturer providing a 100% NTG ratio estimate. To diminish the effect of this anomalous number, we used the simple average estimate and not the sales‐weighted methodology when determining an estimate for the channel as a whole.
Among the major sellers, the grocery channel reported relatively high NTG estimates, especially from store managers. Managers from the three largest stores in terms of sales (accounting for 76% of sales from those surveyed in the grocery channel) reported 100% NTG ratios. At the same time, seven of the other 19 store managers provided NTG estimates of 25% or less. The straight average NTG ratio among store managers produced a 62% estimate, considerably lower than the sales‐weighted 89%.
Such variability in the grocery sector is not unusual as this channel contains a greater variety of store chains compared to other retail channels (in terms of store sizes and target customers). The limited shelf space for grocery stores, as noted, means store managers often prefer to sell higher‐volume sales products, such as standard CFLs rather than specialty CFLs, as reflected in the Massachusetts program’s sales volume.
As with other bulb types, specialty CFLs sold through the “other” retail channel received a very high NTG estimate. Although this estimate derived from relatively few sources (three manufacturers and one store manager), we feel comfortable using it, as the “other” channel’s sales predominantly came from schools, malls, office buildings, fairs, and other events, which would be very unlikely to distribute these bulbs in the program’s absence.
HTR
Specialty
CFLs
Table 10 shows channel‐specific and program‐wide NTG estimates for specialty CFLs sold through HTR stores. The discount channel sold roughly 90% of those bulbs. The grocery channel (mostly ethnic grocery stores) sold most of the remaining bulbs.
Table 10. Channel‐Specific and Program‐Wide NTG Ratio Estimates for HTR Specialty CFLs
Sold through the 2013 Program
Lighting Retail Channel Bulb Sales in Channel Number of Unique Estimates
NTG Ratio Estimates from Supplier Interviews
(Weighted by Program Sales)
Manufacturers Retail Buyers Store Managers Simple Avg. NTG Recommended NTG Discount 324,906 52 99% 100% 83% 94% 99% Grocery 22,100 5 100% None 67% 84% 100% Mass
Merchandise 2,750 1 100% None None 100% 100%
Other 11,564 3 100% None 100% 100% 100%
All Channels 361,320 61 99%
The manufacturer, retail buyer, and store manager estimates accounted, respectively, for 99%, 3%, and 19% of these bulbs’ total sales. We did not, however, use store manager input to calculate our
recommended NTG estimates. As discussed, store managers may not have information on their CFL wholesale costs, and therefore may not realize ENERGY STAR CFLs likely could not be supplied to them at a sufficiently low cost to resell the bulbs without program discounts.
For the “recommended NTG” ratio for the discount channel, we used a sales‐weighted average between manufacturer and retail buyer estimates. For the other channels, we simply used the manufacturer estimates. This resulted in a much higher overall NTG estimate than for non‐HTR stores: at over 99%.
Aggregated
Specialty
CFLs
As with standard CFLs, we aggregated channels into “channel groupings” and recalculated the
“recommended NTG” estimates based on these groupings. These channel groupings for specialty CFLs are the same as those for standard CFLs. As Table 11 shows, nearly twice as many bulbs were sold through the home improvement channel grouping than through HTR stores. The NTG ratio for these home improvement bulbs was much lower than for HTR (39% vs. 98%), and also considerably lower than for standard CFLs sold through home improvement stores (61%). A majority of the “All Other” channel grouping came from the “other” channel (schools, malls, office buildings, etc.), which had very high NTG estimates. This may explain why the “All Other” channel grouping for specialty CFLs was higher than for standard CFLs, which consisted primarily of bulbs sold through the mass merchandise and membership club channels.