74 IRANIAN JOURNAL OF DIABETES AND OBESITY, VOLUME 6, NUMBER 2, SUMMER 2014
Diagnosis of Diabetes Using an Intelligent Approach Based on Bi-Level
Dimensionality Reduction and Classification Algorithms
Razieh Sheikhpour1*, Mehdi Agha Sarram1
Introduction
iabetes mellitus is a group of metabolic diseases characterized by abnormal high levels of plasma
glucose or hyperglycemia in the fasting state or after administration of glucose during an oral glucose tolerance test (1). It causes by a
D
1- School of Electrical and Computer Engineering, Yazd University, Yazd, Iran.
*Correspondence:
Razieh Sheikhpour, School of Electrical and Computer Engineering, Yazd University, Yazd, Iran.
Email: [email protected] Tel: (98) 913 358 9850
Received: 14 November 2014
Accepted: 15 January 2015
Published in February 2015
Abstract
Objective: Diabetes is one of the most common metabolic diseases. Earlier diagnosis of diabetes and treatment of hyperglycemia and related metabolic abnormalities is of vital importance. Diagnosis of diabetes via proper interpretation of the diabetes data is an important classification problem. Classification systems help the clinicians to predict the risk factors that cause the diabetes or predict people who are at risk of developing diabetes.
Materials and Methods: In this study, Pima Indian diabetes dataset taken from the UCI machine learning repository was used which contains 786 samples of normal and diabetes with 8characteristics.Selection of efficient features of this dataset was analyzed using correlation criterion, information gain and CfsSubsetEval. Then diagnosis of diabetes diseases on Pima dataset was considered using proposed by-level dimensionality reduction method and classification algorithms. Classification algorithms used in this study are KNN, quadratic, Naïve Bayes, nearest mean classifier, non-parametric Gaussian and Mahalonobis kernel and linear discriminant.
Results: In all feature selection methods, plasma glucose concentration a 2-hours in an oral glucose tolerance test, body mass index and age have been selected as the top-ranked features in intelligent diagnosis of diabetes. Proposed method has achieved the accuracy of 82.09 using KNN and quadratic methods and bi-level dimensionality reduction on Pima dataset. The best performance has been achieved by performing PCA algorithm on the features, namely, number of pregnancy, plasma glucose concentration a 2 hours in an oral glucose tolerance test, body mass index, diabetes pedigree function and Age.
Conclusion: The results of this study showed that bi-level dimensionality reduction and classification algorithm scan be very helpful in assisting the physicians to diagnosis diabetes.
Key words: Diabetes, Data mining, Classification, Dimensionality reduction, Feature selection, Feature extraction.
IRANIAN JOURNAL OF DIABETES AND OBESITY, VOLUME 6, NUMBER 2, SUMMER 2014 75
combination of insulin resistance and impaired
insulin secretion by pancreatic B cells (2-3).
Diabetes increases the risks of developing kidney disease, blindness, nerve damage, blood vessel damage and it contributes to heart disease (4). Today, more than 200 million people in the world have type-2 diabetes (1). The total number of people with diabetes is expected to reach 370 million worldwide in 2030 (1). The Pima Indians of Arizona have the highest prevalence and incidence of Type-2 diabetes of any population in the world (4). Early detection of diabetes, treatment of
hyperglycemia and related metabolic
abnormalities is of vital importance (4). Evaluation of data taken from patient and decisions of experts are the most important factors in diagnosis of diabetes, but in modern medicine large amounts of data taken from patient are stored in the diabetes database and there is a widening gap between data collection and data comprehension (4-6). It is often impossible to process all of the available data and making a rational decision on basic trends. Thus, there is a great need for intelligent data analysis such as data mining to extract the useful knowledge from these data to help the experts in decision making. Data mining is the search for relationships and patterns that exist in large databases but are hidden among the vast amount of data, such as a relationship between patient data and their medical diagnosis. Data mining techniques on diabetes data help to predict the risk factors that cause the diabetes or predict people who are at risk of developing diabetes (4-9).
Classification is one of the data mining techniques which have been successfully
applied for medical diagnosis (7).
Classification systems make medical data to be examined in shorter time and more detailed. The classification derives the class of an object based on its features while prediction means
an indication in advance based on
observations, experiences, or scientific
reasons. The goal of classification is to maximize predictive accuracy; therefore, predictive accuracy is generally accepted and
widely used as the primary measure by researchers and practitioners (4).
The aim of this paper is to propose a method based on bi-level dimensionality reduction and classification algorithms to improve the
diagnostic accuracy of diabetes.
Dimensionality reduction is very crucial for
improving classification performance,
especially in the case of high-dimensional data classification (10). There are two main methods for dimensionality reduction: (i) feature selection, and (ii) feature extraction (11). Feature selection is an essential pre-processing method to remove irrelevant and redundant features (11).Feature extraction is a
process to create a new set of k features that
are combinations of the original d features.
When the original feature sets transform to a new smaller feature space, it called feature extraction. The feature transformation may be a linear or nonlinear combination of original
features (12). Bi-level dimensionality
reduction of the proposed method in this study is based on feature selection followed by feature extraction. Correlation Criterion (CC), Information Gain (IG) and CfsSubsetEval method are used for feature selection and Principal Component Analysis (PCA) is used for feature extraction.
Materials and Methods
Sample selection
In this study, Pima Indian diabetes dataset (13) taken from the UCI machine learning repository was used. This dataset was selected from a larger dataset held by the National Institutes of Diabetes and Digestive and Kidney Diseases. Since Pima Indians are the most intense population with type-2 diabetes in the world, data from this population is
widely used in diabetic studies. The
diagnostic, binary-valued variable investigated is whether the patient shows signs of diabetes according to World Health Organization criteria (i.e., if the 2 hour post-load plasma glucose was at least 200 mg/dl at any survey examination or if found during routine medical care). All patients in this dataset are
76 IRANIAN JOURNAL OF DIABETES AND OBESITY, VOLUME 6, NUMBER 2, SUMMER 2014 Indian women at least 21 years old and living
near Phoenix, Arizona, USA. The binary response variable takes the values ‘0’ or ‘1,’ where ‘1’ means a positive test for diabetes and ‘0’ is a negative test for diabetes.
The dataset has 768 instances with two class problems to test whether the patient is positive or negative for diabetes. There are 500 (65.1%) instances in class ‘0’ (normal) and 268 (34.9%) instances in class ‘1’ (Pima Indian diabetes). All instances have eight features. These features are:
• Features 1: Number of pregnancy
• Features 2:Plasma glucose
concentration after 2 hours oral glucose tolerance test
• Features 3: Diastolic blood pressure
(mm Hg)
• Features 4: Triceps skin fold thickness
(mm)
• Features 5: 2-Hours serum insulin (mu
U/ml)
• Features 6: Body mass index (weight in
kg/(height in m)^2)
• Features 7: Diabetes pedigree function
• Features 8: Age (years)
Proposed method based on bi-level
dimensionality reduction
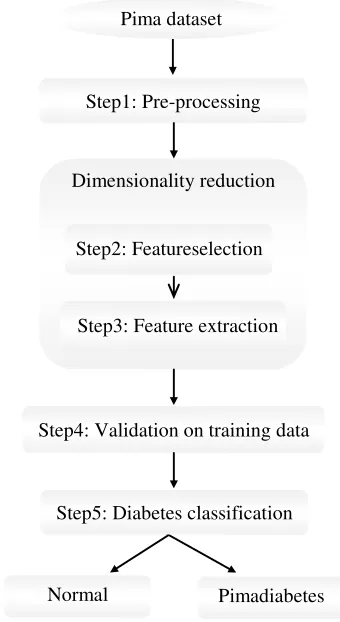
To classification of Pima Indian diabetes dataset, we randomly split the original dataset into training and test sets. The proposed method to classify instances of the Pima into two classes relies on five operational steps. The steps of proposed classification structure
are shown in Figure 1. These steps are
explained in the following subsections:
Pre-Processing step
Pre-Processing is the first step of proposed method. In this step, data are normalized between 0 and 1. Normalization is applied where data are scaled to fall within a smaller range. Normalizing the data attempts to give all features an equal weight. The data normalization has a significant impact on the performance of many learning algorithms. This can improve the accuracy and efficiency of mining algorithms involving distance measurements (14).
Dimensionality reduction
In the proposed method, dimensionality reduction consists of two steps, feature selection and feature extraction. Initially, feature selection is applied on the original feature set to reduce its dimension and determine important features and then feature extraction is applied on the reduced feature set to further reduce its dimensions. In this study, we use three combinations of feature selection and feature extraction methods:
• Feature selection based on correlation
criteria followed by PCA.
• Feature selection based on information
gain followed by PCA.
• Feature selection based on
CfsSubsetEval method followed by PCA.
Feature selection step
The objective of feature selection is to identify important features in the dataset and discard the unimportant features. Redundant features can be eliminated by feature selection without
Figure 1. Diagram of the proposed method for diabetes diagnosis
Pimadiabetes Normal
Pima dataset
Step1: Pre-processing
Dimensionality reduction
Step2: Featureselection
Step3: Feature extraction
Step4: Validation on training data
Step5: Diabetes classification
IRANIAN JOURNAL OF DIABETES AND OBESITY, VOLUME 6, NUMBER 2, SUMMER 2014 77
losing essential classificatory information (10). In this study, we perform feature selection for selecting the more relevant features prior to derivation of classification predictors. This process involves removing irrelevant features. In this step, features are ranked depending on their importance for the classification in decreasing order using the information gain (15,16) or correlation criterion (17) There by, features of less importance are ignored, and feature extraction method is applied on highest important features.
Feature extraction step
The objective of feature extraction is finding a new set of k features that are combinations of the original d features. Feature extraction is a process through which a new set of features is created (11). Principal Components Analysis (PCA) is a well-known and most widely used feature extraction method (15,18-19).PCA algorithm consists of the following main steps:
1. Compute the mean vector.
2. Subtract the mean: subtract the mean
from each of the data dimensions. This produces a dataset whose mean is zero.
3. Calculate the covariance matrix.
4. Calculate the eigenvectors (u1,u2,
…,uN) and eigenvalues (λ1,λ2 , …,λN)of the
covariance matrix.
5. Sort the eigenvectors by decreasing
eigen values.
6. Choose k eigenvectors with the largest
eigen values: We take into account the k components that explain more than, for
example, 90 percent, of the variance. When λi
are sorted in descending order, the proportion of variance explained by the k principal components is:
(1) T λλλ
λλλλ
7. Transform the samples to the new
subspace.
Validation step
In addition to the feature reduction, in some classification methods such as KNN,
non-parametric Gaussian kernel and
non-parametric Mahalonobis kernel, proper
parameters setting can improve the
classification accuracy. The values of the
parameters in these classification have to be chosen carefully in advance. For this purpose, we use 10-fold cross-validation on the training set to find out the optimal parameter values of these classification by maximizing the accuracy. Then, the classifiers were validated against the test set. Some classification algorithms may not need this validation step. In 10-fold cross validation, the training set is divided into 10subsets, and each time, one of the 10subsets is used as the test set and the other 9 subsets are put together to form a training set. Then the average error across all 10trials is computed. The advantage of this method is that it is not important how the data is divided. Every data point appears in a test set exactly once, and appears in a training set 9 times.
Classification step
In this step, the diabetes patient in the test set is predicted. The prediction of diabetes patient is done by a classifier using the features extracted in the feature extraction step and the optimal parameters of the classifier obtained in validation step. Classification algorithms used in this study are KNN, quadratic, Naïve Bayes,
nearest mean classifier, non-parametric
Gaussian and Mahalonobis kernel and linear discriminant.
Results
To evaluate the effectiveness of the proposed method, we conducted experiments on the Pima Indian diabetes dataset. The experiment is carried out via Matlab software and Weka data mining tool. We perform 10-fold cross-validation on the training set to choose the best
values of parameter K for KNN classifier from
the set {15,17,19,…,101} and the parameter h
for parametric Gaussian kernel and non-parametric Mahalonobis kernel from the set {0.1,0.2,0.5,1,1.5,2,2.5,5,10, 20,30,40,50,100} and choose the parameter with the best 10- fold cross-validation accuracy as the parameter of these classifiers.
For evaluation of the performance of proposed
method, we define and compute the
78 IRANIAN JOURNAL OF DIABETES AND OBESITY, VOLUME 6, NUMBER 2, SUMMER 2014 classification accuracy, recall, precision and
F-measure. The formulations are as follows (21):
(2)Accuracy
(3)Recall
(4)Precision
(5) !"#$#%& !"'((
!"#$#%& !"'((
TP is the number of true positives; FN, the number of false negatives; TN, the number of true negatives; and FP, the number of false positives.
For experiments, we used the following methods:
• Feature selection using Correlation
Criterion (CC) followed by feature extraction using PCA.
• Feature selection using Information
Gain (IG) followed by feature extraction using PCA.
• Feature selection using CfsSubsetEval
evaluator and Greedy Stepwise search method followed by feature extraction using PCA. In the experiments, two values {0.9, 0.8} are
considered for parameter T in PCA algorithm
and three values {0.9, 0.8, 0.7} are considered for threshold parameter in feature selection using Correlation Criterion (CC).
When the threshold parameter in feature selection using correlation criterion was set to 0.9, the features {Number of pregnancy, Plasma glucose concentration after 2 hours oral glucose tolerance test, 2-Hours serum insulin, Body mass, Diabetes pedigree function, Age} were selected as important features in the Pima Indian dataset and two features {Diastolic blood pressure, Triceps skin fold thickness} were removed. Then PCA algorithm was performed on the features
selected in this step. When parameter T in
PCA algorithm was set to 0.9, a new dataset
with 5 features was created. When parameter T
was set to 0.8, another dataset with 4 features was created.
When the threshold parameter in feature selection using correlation criterion was set to 0.8, the features {Number of pregnancy, Plasma glucose concentration after 2 hours
oral glucose tolerance test, Body mass, Diabetes pedigree function, Age} were selected as important features in the Pima Indian dataset and three features {Diastolic blood pressure, Triceps skin fold thickness, 2-Hours serum insulin} were removed. Then PCA algorithm was performed on the features
selected in this step. When parameter T in
PCA algorithm was set to 0.9 and 0.8, a new dataset with 4 features was created.
When the threshold parameter in feature selection using correlation criterion was set to 0.7, the features {Number of pregnancy, Plasma glucose concentration after 2 hours oral glucose tolerance test, Body mass, Age} were selected as important features in the Pima Indian dataset and four features {Diastolic blood pressure, Triceps skin fold thickness, 2-Hours serum insulin, Diabetes pedigree function} were removed. Then PCA algorithm was performed on the features selected in this
step. When parameter T in PCA algorithm was
set to 0.9, a new dataset with 4 features was
created. When parameter T in PCA algorithm
was set to 0.8, another dataset with 3 features was created.
We computed Information Gain (IG) for each features in Pima Indian dataset. Information gain for the features {Diastolic blood pressure, Triceps skin fold thickness, Diabetes pedigree function} was zero. In feature selection using information gain, we selected the features {Number of times pregnant, Plasma glucose concentration a 2 hours in an oral glucose tolerance test, 2-Hour serum insulin, Body mass, Age} as important features in the Pima Indian. Then we performed PCA algorithm on the features selected in this step. When
parameter T in PCA algorithm was set to 0.9, a
new dataset with 4 features was created. When
parameter T was set to 0.8, another dataset
with 3 features was created.
We also used Attribute Selection filter (package weka. filters. supervised. attribute) for feature selection. The Attribute Selection filter takes an evaluator and a search algorithm as parameter. The evaluator determines what method is used to assign a worth to each
IRANIAN JOURNAL OF DIABETES AND OBESITY, VOLUME 6, NUMBER 2, SUMMER 2014 79
subset of attributes. The search method determines what style of search is performed. In this study, we used CfsSubsetEval as evaluator and a backwards operating Greedy Step wise as search algorithm. CfsSubsetEval method selected the features {Plasma glucose concentration after 2 hours oral glucose tolerance test, Body mass index, Age} as the most important features in the Pima Indian dataset and removed remaining features. Then we performed PCA algorithm on the features
selected in this step. When parameter Tin PCA
algorithm was set to 0.9, a new dataset with 3
features was created. When parameter T was
set to 0.8, another dataset with 2 features was created.
After performing dimensionality reduction step on Pima dataset, 9 new different diabetes
datasets were created and different
classification methods were applied on new datasets in classification step.
Table 1 shows new different diabetes datasets created by proposed method. This table also indicates the number of features in new data sets and the factors which make these new
datasets such as feature selection method and
the value of parameter T in PCA algorithm.
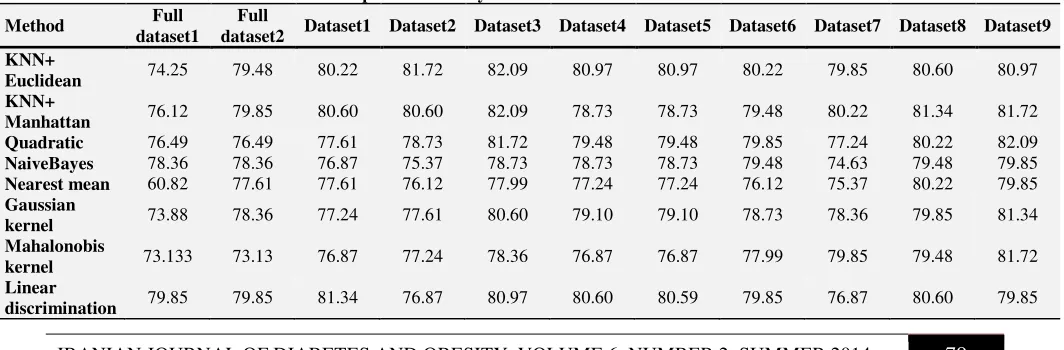
For evaluating the performance of proposed method, we compared the performance of different classifiers on the Pima dataset, normalized Pima dataset and diabetes datasets created by proposed method respect to accuracy, recall, precision and F-measure. Tables 2 to 5 show the performance of different classifiers on different diabetes datasets respect to accuracy, recall, precision and F-measure, respectively. In these tables, Full dataset1 represents Pima dataset with 8
features and full dataset2 represents
normalized Pima dataset with 8 features.
KNN+ Euclidean represents K-Nearest
Neighbor classifies based on Euclidean distance and KNN+ Manhattan represents
K-Nearest Neighbor classifier based on
Manhattan distance.
As shown in Table 2, the performance of all classifiers has been improved in terms of accuracy measure on the different datasets created by the proposed method. It can also be seen from Table 2 that in classifiers such as
Table 1. New different diabetes datasets created by proposed method
Dataset
number Feature selection method
The features selected using feature selection method
Parameter T in PCA algorithm
Final number of features in
dataset 1 Correlation Criterion ; Threshold=0.9 {1,2,5,6,7,8} 0.9 5
2 Correlation Criterion; Threshold=0.9 {1,2,5,6,7,8} 0.8 4
3 Correlation Criterion ; Threshold=0.8 {1,2,6,7,8} 0.9 or 0.8 4
4 Correlation Criterion; Threshold=0.7 {1,2,6,8} 0.9 4
5 Correlation Criterion; Threshold=0.7 {1,2,6,8} 0.8 3
6 Information Gain {1,2,5,6,8} 0.9 4
7 Information Gain {1,2,5,6,8} 0.8 3
8 CfsSubsetEval {2,6,8} 0.9 3
9 CfsSubsetEval {2,6,8} 0.8 2
Table 2. Performance of different classifier respect to accuracy measure on different diabetes datasets
Method Full
dataset1
Full
dataset2 Dataset1 Dataset2 Dataset3 Dataset4 Dataset5 Dataset6 Dataset7 Dataset8 Dataset9
KNN+
Euclidean 74.25 79.48 80.22 81.72 82.09 80.97 80.97 80.22 79.85 80.60 80.97
KNN+
Manhattan 76.12 79.85 80.60 80.60 82.09 78.73 78.73 79.48 80.22 81.34 81.72
Quadratic 76.49 76.49 77.61 78.73 81.72 79.48 79.48 79.85 77.24 80.22 82.09
NaiveBayes 78.36 78.36 76.87 75.37 78.73 78.73 78.73 79.48 74.63 79.48 79.85
Nearest mean 60.82 77.61 77.61 76.12 77.99 77.24 77.24 76.12 75.37 80.22 79.85
Gaussian
kernel 73.88 78.36 77.24 77.61 80.60 79.10 79.10 78.73 78.36 79.85 81.34
Mahalonobis
kernel 73.133 73.13 76.87 77.24 78.36 76.87 76.87 77.99 79.85 79.48 81.72
Linear
discrimination 79.85 79.85 81.34 76.87 80.97 80.60 80.59 79.85 76.87 80.60 79.85
80 IRANIAN JOURNAL OF DIABETES AND OBESITY, VOLUME 6, NUMBER 2, SUMMER 2014 quadratic, naïvebayes, nearest mean and
non-parametric Gaussian and Mahalononbis
kernels which work based on bayes theorem, feature selection using CfsSubsetEval method has the best performance in terms of accuracy
measure. The comparison results of
fulldataset1 and fulldataset2 show that data normalization in the classifiers such as KNN+ Euclidean, nearest mean and non-parametric Gaussian kernel which work based on euclidean distance significantly improves the performance of the classifiers in terms of accuracy measure.
The best performance in terms of accuracy measure has been achieved using KNN classifier and quadratic classifier on dataset3 and dataset9, respectively. Means that using KNN classifier on the features {Number of times pregnant, Plasma glucose concentration a 2 hours in an oral glucose tolerance test, Body mass index, Diabetes pedigree function, Age} and performing PCA algorithm, the best performance has been achieved in terms of accuracy measure. In addition, using quadratic classifier on the features {Plasma glucose concentration a 2 hours in an oral glucose tolerance test, Body mass index, Age} and
performing PCA algorithm, the best
performance has been achieved in terms of accuracy measure.
It is clear from Table 3 that the performance of all classifiers except naïvebayes classifier has been improved in terms of recall measure on
the different datasets created by the proposed method. As shown in Table 3, nearest mean classifier has the best performance in terms of recall measure on dataset1 and dataset3. Means that using nearest mean classifier on
the features {Number of times
pregnant, Plasma glucose concentration a 2 hours in an oral glucose tolerance test, Body mass index, Diabetes pedigree function, Age} or on the features {Number of times pregnant, Plasma glucose concentration a 2 hours in an oral glucose tolerance test, 2-Hour serum insulin, Body mass index, Diabetes pedigree function, Age} and performing PCA algorithm, the best performance has been achieved in terms of recall measure.
It can be seen from Table 4 that the performance of all classifiers in terms of precision measure has been improved on the different datasets created by the proposed method. The comparison results of fulldataset1
and fulldataset2 indicate that data
normalization in the classifiers such as KNN+ Euclidean, nearest mean and non-parametric Gaussian kernel which work based on Euclidean distance and in KNN+ Manhattan classifier which works based on Manhattan
distance significantly improves the
performance of the classifiers in terms of precision measure.
The best performance in terms of precision measure has been achieved using KNN+ Euclidean classifier on dataset3which consists
Table3. Performance of different classifiers respect to recall measure on different diabetes datasets
Method
Full dataset
1
Full dataset
2
Dataset 1
Dataset 2
Dataset 3
Dataset 4
Dataset 5
Dataset 6
Dataset 7
Dataset 8
Dataset 9
KNN+
Euclidean 50 43.02 47.67 58.14 54.65 63.95 63.95 56.98 59.30 63.95 60.47
KNN+
Manhattan 54.65 46.51 54.65 54.65 58.14 62.79 62.79 55.81 59.30 67.44 62.79
Quadratic 63.95 63.95 62.79 70.93 75.58 67.44 67.44 66.28 62.79 66.28 67.44
NaiveBayes 61.63 61.63 48.84 48.84 56.98 56.98 56.98 55.81 50 52.33 52.33
Nearest mean 43.02 77.91 80.23 76.74 80.23 77.91 77.91 75.58 74.42 77.90 76.74
Gaussian
kernel 46.51 61.63 44.19 50 53.49 60.47 60.47 53.49 54.65 61.63 60.47
Mahalonobis
kernel 25.58 25.58 48.84 48.84 51.16 41.86 41.86 51.16 58.14 62.79 61.63
Linear
discrimination 50 50 52.33 45.35 52.33 55.81 55.81 55.81 47.67 53.49 52.33
IRANIAN JOURNAL OF DIABETES AND OBESITY, VOLUME 6, NUMBER 2, SUMMER 2014 81
of performing PCA algorithm on the features
{Number of pregnancy, Plasma glucose
concentration after 2 hours oral glucose tolerance test, Body mass index, Diabetes pedigree function, Age}.
As shown in Table 5, the performance of all classifiers except naïvebayes classifier has been improved in terms of F-measure on the different datasets created by the proposed
method. The comparison results of
fuudataset1 and fulldataset2 indicate that data normalization in the classifiers such as KNN+ Euclidean, nearest mean and non-parametric Gaussian kernel which work based on Euclidean distance significantly improves the performance of the classifiers in terms of
F-measure. Quadratic classifierhas the best performance in terms of F-measure on dataset 3 compared with other classifiers.
Discussion
Nowadays huge amounts of data about diabetic patients are captured by the healthcare
information systems in healthcare
organizations. Traditional manual data
analysis isn’t able to analyze the huge amount of data. Data mining methods can be applied in medical research in order to analyze large volume of medical data and get useful clinical knowledge from medical databases. In this study, a method was proposed for diagnosis of diabetes on Pima Indian diabetes dataset
Table4. Performance of different classifiers respect to precision measure on different diabetes datasets
Method
Full dataset
1
Full dataset
2
Dataset 1
Dataset 2
Dataset 3
Dataset 4
Dataset 5
Dataset 6
Dataset 7
Dataset 8
Dataset 9
KNN+
Euclidean 62.32 86.05 83.67 79.37 83.93 73.33 73.33 75.38 72.86 72.37 75.36
KNN+
Manhattan 65.28 83.33 78.33 78.33 80.65 68.35 68.35 73.84 73.91 72.50 76.06
Quadratic 63.22 63.22 65.85 65.59 69.89 68.24 68.24 69.51 65.06 70.37 74.36
NaiveBayes 67.95 67.95 70 65.63 71.01 71.01 71.01 73.85 63.24 76.27 77.59
Nearest mean 39.75 62.04 61.61 60 62.16 61.47 61.47 60.19 59.26 66.34 66
Gaussian
kernel 62.50 67.95 74.51 71.67 79.31 70.27 70.27 73.02 71.21 71.62 76.47
Mahalonobis
kernel 73.33 73.33 70 71.19 73.33 75 75 72.13 73.53 70.13 76.81
Linear
discrimination 79.63 79.63 83.33 72.22 81.82 77.42 77.42 75 70.69 79.31 77.59
Table5. Performance of different classifiers respect to F-measure on different diabetes datasets
Method
Full dataset
1
Full dataset
2
Dataset 1
Dataset 2
Dataset 3
Dataset 4
Dataset 5
Dataset 6
Dataset 7
Dataset 8
Dataset 9
KNN+
Euclidean 62.32 86.05 83.67 79.37 83.93 73.33 73.33 75.38 72.86 72.37 75.36
KNN+
Manhattan 65.28 83.33 78.33 78.33 80.65 68.35 68.35 73.84 73.91 72.50 76.06
Quadratic 63.22 63.22 65.85 65.59 69.89 68.24 68.24 69.51 65.06 70.37 74.36
NaiveBayes 67.95 67.95 70 65.63 71.01 71.01 71.01 73.85 63.24 76.27 77.59
Nearest mean 39.75 62.04 61.61 60 62.16 61.47 61.47 60.19 59.26 66.34 66
Gaussian
kernel 62.50 67.95 74.51 71.67 79.31 70.27 70.27 73.02 71.21 71.62 76.47
Mahalonobis
kernel 73.33 73.33 70 71.19 73.33 75 75 72.13 73.53 70.13 76.81
Linear
discrimination 79.63 79.63 83.33 72.22 81.82 77.42 77.42 75 70.69 79.31 77.59
82 IRANIAN JOURNAL OF DIABETES AND OBESITY, VOLUME 6, NUMBER 2, SUMMER 2014
which used a bi-level approach for
dimensionality reduction. Different classifiers such as KNN, quadratic, naïvebayes, nearest mean classifier, non-parametric Gaussian kernel, non-parametric Mahalonobis kernel and linear discriminant were applied to classify and analyze the diabetes data. The performance of all classifier son the datasets created by the proposed method has been
significantly improved with respect to
accuracy, recall, precision and F-measure. Proposed method consists of five steps. The first step is data normalization which significantly improves the performance of the classifiers which are based on Euclidean distance in terms of different measures.
In the experiments, the correlation of each feature in the Pima dataset with the decision attribute was computed. Feature 1 (Number of times pregnant), Feature 2 (Plasma glucose concentration after 2 hours oral glucose tolerance test), Feature 6 (Body mass index) and Feature 8 (Age) were the top-ranked four features which have shown strong relevancy with the decision attribute.
In all feature selection methods used in this
study, Feature 2 (Plasma glucose
concentration after 2 hours oral glucose tolerance test), Feature 6 (Body mass index) and Feature 8 (Age) have been selected as the top-ranked features. It is suggested an important clue for the physicians to pay much more attention to these features, namely, Plasma glucose concentration after 2 hours oral glucose tolerance test, Body mass index and Age for diabetes diagnosis. We believe that the proposed method can be very helpful in assisting the physicians to make the accurate diagnosis on the patients and can show great potential in the area of clinical diagnosis. In all feature selection methods, the features, diastolic blood pressure and Triceps skin fold thickness are removed and indicated as the least important features in diagnosis of diabetes diseases.
The best performance with respect to accuracy, recall, precision and F-measure has been achieved on dataset3 which consists of
performing PCA algorithm on the features
{Number of pregnancy, Plasma glucose
concentration after 2 hours oral glucose tolerance test, Body mass index, Diabetes pedigree function, Age}.
A hybrid model was proposed by Karegowda et al. (23) that integrates Genetic Algorithm and Back Propagation network (GA-BPN) for predictions of medical data where GA is used to initialize and optimize the connection weights of BPN. GA- BPN method has achieved the accuracy of 77.707 on Pima dataset.
Balakrishnan and Narayanaswamy (8) applied a method to derive the optimal feature subset for the Pima dataset that improves the performance of the Libsvm classifier. They achieved the accuracy of 77.9948 on Pima dataset.
Rakotomamonjy et al. (24) proposed an approach for solving the multiple kernel learning problem in support vector machines. Their approach uses aweighted 2-norm regularization. This method obtained the accuracy of 75.8 ± 1.6 on Pima dataset.
A comparative study on diabetes disease diagnosis using neural networks was proposed by Temurtas et al. (4). They reported 79.62 classification accuracy using MLNN with LM (10x FC) algorithm, 78.05 classification accuracy using PNN (10x FC) algorithm and 80.21 accuracy using GRNN (conventional valid) method.
Polat and Gunes (6) reported classification accuracy between 59.5 and 77.7 on Pima datasetand Watkins and Boggess (25) reported accuracy between 73.0 and 77.7 on this dataset.
Yin and Han (26) presented classification based on predictive association rules (CPAR) which obtained 73.8 classification accuracy on Pima dataset. They also reported 75.5, 73.1, 72.9, 75.1 classification accuracy using C4.5,
Ripper, CBA and CMAR methods,
respectively.
A Classwise k-Nearest Neighbor (CKNN) method for classification of diabetes dataset has been presented by Angeline and
IRANIAN JOURNAL OF DIABETES AND OBESITY, VOLUME 6, NUMBER 2, SUMMER 2014 83
Sivaprakasam (14). CKNN obtained accuracy of 78.16 on Pima dataset. They also reported that accuracy of KNN method is 71.84, naïvebayes is 73.8 and logdisc is 77.7.
BOZKURT et al. (27) compared the performance of different neural networks on Pima dataset. They obtained accuracy between 65.97 and 73.6 on these data.
Our proposed method has achieved accuracy of 82.09on Pima dataset using KNN and
quadratic classifiers and bi-level
dimensionality reduction based on feature selection followed by PCA.
Conclusion
The results of this study showed that proposed method have achieved better performance compared with other methods (6,8,14,23-27).
Refrences
1. Sheikhpour R, Yaghmaei P. A survey on herbal medicines for hypoglycemia in diabetic patients.Iranian Journal of diabetes and obesity. 2012;4(1):40-9.
2. Sheikhpour R, Sadeghian F, Pourhosseini F, Rajabi S. Correlation between Glycated Hemoglobin, Serum Glucose and Serum Lipid Levels in Type 2 Diabetes.Iranian Journal of Diabetes & Obesity. 2013;5(1):12-5.
3. Sheikhpour R. Diabetes and Oxidative Stress: The Mechanism and Action.Iranian Journal of Diabetes & Obesity. 2013;5(1):40-5
4. Temurtas H, Yumusak N, Temurtas F. A comparative study on diabetes disease diagnosis using neural networks.Expert Systems with applications.2009;36(4):8610-5. 5. Huang Y, McCullagh P, Black N, Harper R.
Feature selection and classification model construction on type 2 diabetic patients’ data.Artificial intelligence in medicine. 2007;41(3):251-62.
6. Polat K, Güneş S. An expert system approach based on principal component analysis and adaptive neuro-fuzzy inference system to diagnosis of diabetes disease.Digital Signal Processing. 2007;17(4):702-10.
7. Hariz M, Adnan M, Husain W, Rashid NA. Data Mining for Medical Systems: A Review. International Conference on Advances in Computer and Information Technology - ACIT 2012:17-22.
8. Balakrishnan S, Narayanaswamy R. Feature selection using FCBF in type ii diabetes databases.International Journal of the Computer, the Internet and the Management. 2009:17(1),50-8.
9. Sanakal R, Jayakumari ST. Prognosis of Diabetes Using Data mining Approach-Fuzzy C Means Clustering and Support Vector
Machine. International Journal of Computer Trends and Technology. 2014;11(2):94-8. 10. Zhu M, Song J. An Embedded Backward
Feature Selection Method for MCLP Classification Algorithm. Procedia Computer Science. 2013;17:1047-54.
11. Santosa V, Datiaa N, Patoa MPM. Ensemble feature ranking applied to medical data. Conference on Electronics, Telecommunications and Computers-CETC. 2014.
12. Bamakan SMH, Gholami P. A Novel Feature Selection Method based on an Integrated Data Envelopment Analysis and Entropy Model. Procedia Computer Science. 2014;3:632-8. 13. Blake CL, Merz CJ, UJI Repository of
Machine Learning Databases. 1996;http://www.ics.uci.edu/~mlearn/MLRepo sitory.html.
14. Christobel YA, Sivaprakasam P. A New Classwise k-Nearest Neighbor (CKNN) Method for the Classification of Diabetes Dataset. International Journal of Engineering and Advanced Technology. 2013;2(3):396-400.
15. Uğuz H. A two-stage feature selection method for text categorization by using information gain, principal component analysis and genetic algorithm. Knowledge-Based Systems. 2011;24(7):1024-32.
16. Yang J, Liu Y, Liu Z, Zhu X, Zhang X. A new feature selection algorithm based on binomial hypothesis testing for spam filtering. Knowledge-Based Systems. 2011;24(6): 904-14.
17. Guyon I, Elisseeff A. An introduction to variable and feature selection.The Journal of Machine Learning Research. 2003;3:1157-82.
84 IRANIAN JOURNAL OF DIABETES AND OBESITY, VOLUME 6, NUMBER 2, SUMMER 2014 18. Alpaydin E. (2010). Introduction to machine
learning. (2th ed). London: MIT press.
19. Warmuth MK, Kuzmin D. Randomized PCA algorithms with regret bounds that are logarithmic in the dimension. In Advances in neural information processing systems. 2006:1481-8.
20. Medjahed SA, Saadi TA, Benyettou A. Breast Cancer Diagnosis by using k-Nearest Neighbor with Different Distances and Classification Rules. International Journal of Computer Applications. 2013;62(1):1-5.
21. Han J, Kamber M, Pei J. Data Mining Concepts and Techniques. (3th ed.). USA: Morgan Kaufmann, (Chapter8). 2012.
22. Guo G, Wang H, Bell D, Bi Y, Greer K. KNN model-based approach in classification. In On the Move to Meaningful Internet Systems 2003: CoopIS, DOA, and ODBASE. Springer Berlin Heidelberg. 2003:986-96.
23. Karegowda AG, Manjunath AS, Jayaram MA.
Application of genetic algorithm optimized neural network connection weights for medical
diagnosis of Pima Indians
diabetes. International Journal on Soft Computing. 2011;2(2):15-23.
24. Rakotomamonjy A, Bach F, Canu S,
Grandvalet Y. More efficiency in multiple kernel learning. In Proceedings of the 24th international conference on Machine learning. 2007;775-82.
25. Watkins A, Boggess LC. A new classifier based on resource limited artificial immune systems. In Proceedings of Congress on Evolutionary Computation, Part of the 2002 IEEE World Congress on Computational Intelligence held in Honolulu, HI, USA, May 12-17, 2002;1546-51.
26. Yin X, Han J. CPAR: Classification based on Predictive Association Rules. In SDM. 2003;3:369-76.
27. Bozkurt MR, Yurtay N, Yilmaz Z, Sertkaya C.
Comparison of different methods for
determining diabetes. Turkish Journal of Electrical Engineering & Computer Sciences. 2014;22:1044-55.