Contents lists available atwww.innovativejournal.in
Asian Journal of Computer Science and Information Technology
Journal homepage: http://www.innovativejournal.in/index.php/ajcsit
ON THE DEVELOPMENT OF NEURAL NETWORK MODELS USING DATA MINING TOOLS
Boumedyen Shannaq
1*, Devanshi Thakkar
21Department of Information Systems, CEMIS College, University of Nizwa, Sultanate of Oman
2Electronics and Communication Department, Malaviya National Institute of Technology, Jaipur, Rajasthan, India.
ARTICLE INFO ABSTRACT
Corresponding Author: Boumedyen Shannaq Department of Information Systems, CEMIS College,
University of Nizwa, Sultanate of Oman.
Key Words: Artificial Neural Networks (ANN), Multi-Layered Perceptron (MLP), Cascade Correlation Network, Data mining.
This paper consists of two models, based on the famous Artificial Neural Network (ANN) Models: Multi Layered Perceptron (MLP) model and Cascade Correlation network model developed and compared in their ability to judge the accuracy in results obtained by the diagnosis of the disease in patients. The significance of disease diagnosis by Artificial Neural techniques is not at all obscure these days. The increasing demand of Artificial Neural Networks in the field of medicine has proved to show a significantly better performance in medical decision making. These networks are used to diagnose a wide variety of diseases based on the inputs to the model. The diagnoses are made on specific models with information taken from a large number of patients as compared to a single one. These models do not depend on the assumption made by correlation of different variables. One of the proposed techniques involves the training of the Multi Layered Perceptron (MLP)to recognize a pattern for the diagnosis and prediction of the diseases. For this purpose, we have used various featured inputs on the basis of patients unique like age, sex, marital status, signs and symptoms. On the whole, the Multi Layered Perceptron (MLP) model has proved to diagnose the diseases of multiple patient outcomes more accurately than Cascade Correlation network model for the validated data. Moreover the results have also significantly demonstrated the suitability of the neural network models for specifying the disease the patient possesses.
©2012, AJCSIT, All Right Reserved.
INTRODUCTION
The artificial intelligence technique build a computer based decision support system which is something similar done by the neurons of a human brain. There are several Neural Networks developed today in different fields of medicine that have been proved as a boon for doctors in diagnosing the diseases in a much accurate way. The Neural Networks provide a pretty easy and general way of approaching and solving problems. It works in accordance with the output, it does prediction when the output is categorical and does classification in case the output is of discrete values.
This model also alerts the doctor whether the patient is in a critical condition or not. This has particularly proved to be a boon in saving the life of the patients in case of critical conditions. For this purpose, a detailed and careful analysis of patient information seeking the signs and symptoms observed in all age groups will be studied and analyzed. The consequences of this work would be, the doctors will be able to diagnose the diseases in patient more accurately thus developing and enhancing this very noble field of profession. To perform this analysis and most effective results, the Data Mining technique has been used. We hope
that this research project will not only help the doctors to diagnose the diseases better as compared to clinical domains but also help to save the precious life of every patient at an advanced stage. Further information regarding Data Mining, Multi-layer Perceptron and Cascade Correlation has been obtained from [1, 2, 3, 4, 5, and 6]. 1. REVIEW OF RELATED RESEARCH
There are numerous studies today that have applied Neural Networks in the field of medicine in order to diagnose the diseases effectively. The study [7] of a functional model of ANN aims at aiding the existing diagnosis methods. Here the ANN aims at predicting Thrombo-embolic stroke disease. The ANN here uses Multi-Layered technique incorporating Back propagation algorithm for testing the various stroke diseases. The use of Back propagation algorithm in ANN has proved to be a drastic improvement in the prediction of stroke diseases with a higher accuracy and consistency. The overall prediction accuracy obtained was 89% after training, testing and optimizing the input parameters.
2. EXPERIMENT
The experiment starts with the process of collecting the data set , preparing the data for MULTI-LAYERED PRECEPTRON AND CASCADE CORRELATION model respectively ,configure the characteristics for both models , setting the depends and the independents variables ,split the data into two parts , one for the training and the second for the test ,and then adapting and using
Artificial Neural Network tools to compare the both models , thus obtains the results
1Data Collection and preparation
This work used the data of one month of cases observed in the hospitals in different outpatient departments (OPD). The data set contains six variables, age, sex, marital status, symptoms, diagnosis and status.
Figuer1 shows sample of the dataset .
Figure1, Sample of data set
The collected data set contains 437 records ,the abbreviation ms ,m,f,u,c,and nc stands for Material status, Male, Female, Unmarried, critical and non-critical respectively .The status information critical and noncritical have been judged by expert doctor in this domain . Since most of the variables are ‘categorical’, except age variable which contains numerical values, therefore the age variable was coded to categorical,by classifying the age values into four categories ‘Child 1-9’ , ‘Young 10 -17’, ‘Adult : 18-49’ and ‘Elderly >=50 ‘ , Figure 2 describes the transformation.
Figure 2 data set after the coding process
Various signs and symptoms are observed by the doctor, irrespective of the personal information of the patient. The data used here is collected randomly from pediatric, medical and surgical outpatient department. The age of the patients ranges from 3 years to 70 years. Some disease observed here are dominant in early age, for instance, adenoids, tonsillitis, mumps, measles and jaundice. However, diseases like urinary tract infection (UTI), appendicitis, renal colic, and pilonidal sinus, fissure in anus, hydrocele, thyroid, ganglion, breast disorder and vertebral disc prolapse are common in young and middle age group. Disease involving colonic malignancy, liver malignancy, breast cancer and hernia swelling, are common in old age group. Morbidity and mortality increased with diseases occurring in old age group. Some diseases like asthma and bronchitis that occurs in early age group, continue to occur in later age also. Allpersonal data were removed and ignored for ‘privacy’ issues.
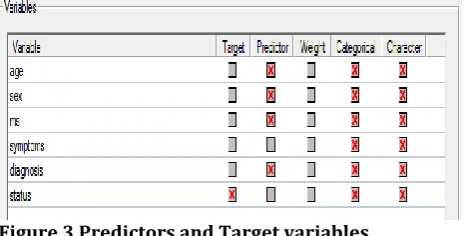
2 Selecting Variables
Figure 3 Predictors and Target variables
The SPSS was adapted to demonstrate the distribution of data as well as to display various statistical information
about the variables .Table 1 and figure 4 illustrate the obtained statistical information.
Table 1 Statistical information for the status variable
Figure 4Distribution of diagnosis variable 3 First experiment
Figure 5 and 6 demonstrate the configuration and the progress of processing the data set for the Multi Layered Perceptron (MLP).
Figure 5 Setting for MLP Figure 6 Progress of analyzing the data
Result for ‘MLP ‘
The analysis report includes various information with reference to ‘project parameters’, ’Input data’ , ‘Variables’,’Neural network parameters’ ,’Model size’,’Misclassification’,’Confusion matrix’, ‘Sensitivity and
Specificity’ , ‘Probability calibration’, ‘Probability threshold’ , ‘Left’ and ‘Gain’ .
Figure7 ‘Confusion Matrix ‘and ‘Sensitivity and Specificity’
Figure 8 Lift and Gain for the training data for the critical and noncritical value
Figure 9 Lift and Gain for the validated data for the critical and noncritical value
4 Second experiment
Figure 10 demonstrate the configuration of the data set for the ‘Cascade Correlation network ‘.
Figure 10 settingfor’Cascade Correlation network ‘
1 Result for ‘Cascade Correlation network ‘.
Figure 11 and figure 12 describe the 2 Lift and Gain values , for the training and validated data for the critical and noncritical values of the target variable .
Figure 12 Lift and Gain for the validated data for the critical and noncritical value
3. RESULTS
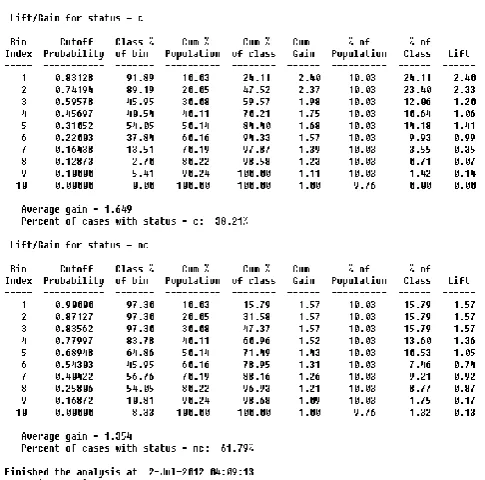
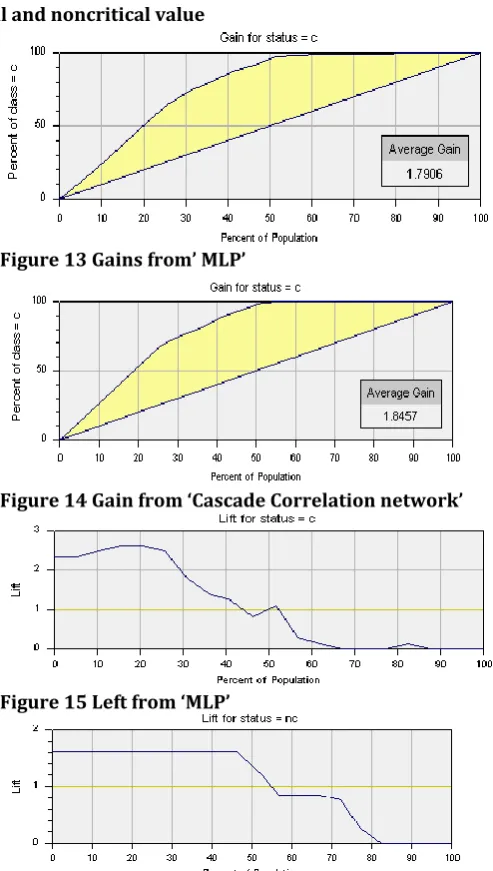
The Left and Gain factors have been used to s compare the ‘MLP’ and ‘Cascade Correlation network’ models respectively.Therefore, which model could provide an appropriate cost accurate result? The average gain obtained from ‘MLP’ for the training data for the critical value = 1.780 and the Percent of cases with status, c = 38.21%, and the Average gain for noncritical = 1.417, and the Percent of cases with status , nc= 61.79% , while the average gain obtained from ‘ Cascade Correlation network’ for the training data for the critical value = 1.829 , and the Percent of cases with status, c=38.21%, and the Average gain for noncritical Average gain = 1.430 , and the Percent of cases with status, nc= 61.79% . The above obtained results from the training data show that the average gain of the ‘Cascade Correlation network’ is superior to ‘MLP’ model for the critical and noncritical values , 0.129 for the critical value and 0.013 for the noncritical value . The average gain obtained from ‘MLP’ for the Validated data for the critical value = 1.649 and the Percent of cases with status, c= 38.21% , and the Average gain for noncritical = 1.354, and the Percent of cases with status, nc= 61.79% , while the average gain obtained from ‘ Cascade Correlation network’ for the validated data for the critical value =1.528, and the Percent of cases with status, c= 38.21%, and the Average gain for noncritical Average gain = 1.254, and the Percent of cases with status, nc= 61.79% .the obtained results from the validated data show that the average gain of the ‘MLP’ superior to ‘Cascade Correlation network’ model for the critical and noncritical values , 0.121 for the critical value and 0.1 for the noncritical value .
Figure 13 Gains from’ MLP’
Figure 14 Gain from ‘Cascade Correlation network’
Figure 15 Left from ‘MLP’
CONCLUSION
The various models are a popular method for predicting and providing good generalizations for unobserved instances, which are not directly related to the target concept. Two neural network models ‘Multi Layered Perceptron (MLP) ‘ and ‘Cascade Correlation network ‘ have been compared and analyzed . Left and Gain have been used to measure the cost as well as the accuracy of each model using the training data set and the validated data set related to medical domain. The findings in this work show that, the accuracy of the ‘Cascade Correlation network’ model is superior to Multi Layered Perceptron (MLP) for the training data, while the accuracy of Multi Layered Perceptron (MLP) is superior to the ‘Cascade Correlation network’ model for the validated data.
REFERENCES
[1] “RSES 2.2 User’s Guide, Warsaw University,” USENET: http://logic.mimuw.edu.pl/~rses[January 19, 2010]. [2]Jihoon Yang, Vasanthonavar, Lowa state University, school of Computer Science, Cascade Correlation Algorithm, 1991, pp. 21-43
[3]Sivarao, Peter Brevern, N.S.M. El-Tayeb and V.C.Vengkatesh, Multimedia university, Malaysia, Neural Network Multi-layer Perceptron Modelling for surface Quality Prediction in Laser Machining, pp 161-166
[4] D. R. Chowdhury, M. Chatterjee and R.K Samanta. “A Data Mining Model for DifferentialDiagnosis of Neonatal Disease.”International Journal of Computing.Vol. 1(2), pp. 143-150, 2011.
[5] X. Qiua, N. Taob and Y. Tana, et al. “Constructing of the Risk Classification Model of Cervical Cancer by Artificial Neural Network.Expert Systems with Applications.” An International Journal Archive.Vol. 32(4), pp. 1094-1099, 2007.
[6] Bomedyen and Kaneez ,"An analysis of work place behavior depicting ‘Work Ethics’ with data mining technique", Symposium Work Ethics Realty and Expectations By sultanate of oman Ministry of higher Education College of Applied Sciences ,2011.
[7] D. Shanthi, G. Sahoo and N. Saravanan. “Designing an Artificial Neural Network Model for the Prediction of Thrombo-embolic Stroke.”International Journals of Biometric and Bioinformatics (IJBB).vol 3(1), pp. 10-18, 2009. Dilip Roy Chowdhury, MridulaChatterjee& R. K. SamantaInternational Journal of Artificial Intelligence and Expert Systems (IJAE), Volume (2) : Issue (3), 2011 106 [8] F.Yaghouby, A. Ayatollahi and R. Soleimani, “Classification of Cardiac Abnormalities Using Reduced Features of Heart Rate Variability Signal.” World Applied Sciences Journal.Vol6.(11), pp. 1547-1554, 2009.
[9] Z. H. Zhou and Y. Jiang.“Medical Diagnosis with C4.5 Rule Preceded by Artificial Neural Network Ensemble.”IEEE Transaction on Information Technology in Biomedicine.Vol7(1), pp. 37-42, Mar. 2003.