projection
Feng Lu
*and Chengdong Wu
Abstract
Background:The accuracy of three-dimensional measurement of object surface is always affected by the nonlinear gamma of the projector. The defocusing binary projection can overcome the nonlinear gamma distortion of the projector and reduce the effect of high harmonics without gamma calibration. Although researches have already reduced the errors to get a clear sinusoidal curve, there still leave room for improvement, especially when wide stripes are applied during the measurement.
Methods:This paper presents a kind of ellipse binary pattern. By analyzing the property and spectrum, the binary pattern can produce high quality sinusoidal curve and produce smaller errors. It has a better effect to use an ellipse pattern to overcome the nonlinear gamma distortion of the projector and it is suit to be used as wide stripes. Results:Simulation and comparison experiments plus three-step phase shifted method are conducted to verify feasibility and accuracy of this binary pattern. The experimental results have indicated that this binary pattern can increase the accuracy of 3D measurement and reduce phase errors caused by the nonlinear gamma of the projector. The defocusing ellipse pattern is superior to traditional methods. In addition, the defocusing binary stripe is robust and suit to measure object with large period.
Conclusions:In this paper, an binary ellipse pattern is proposed for high-accuracy 3D measurement profilometry. It is easy to generate high-quality sinusoidal fringe pattern. Experiment results have demonstrated the feasibility and accuracy of the improved binary pattern besides it proved that the period of fringe pattern has little impact on the accuracy of measurement.
Keywords:3D shape measurement, Ellipse pattern, Binary defocusing, Fringe projection profilometry
Background
Three-dimensional (3D) profilometry measurement is very important in both scientific studies and industrial manufacture [1]. Conventionally, sinusoidal pattern is usually used in a digital fringe projection system. How-ever, the gamma distortion of the projector causes non-sine of the pattern which will lead high harmonics com-ponents and high-frequency noise. Eventually, the har-monics will affect the accuracy of 3D measurement [2– 6]. In order to solve the above problem, binary defocus-ing technology has been widely researched. The binary
defocusing techniques have been proposed recently, in-cluding (SBM) [7], SPWM [8], OPWM [9], etc.
These methods have demonstrated its potential to overcome the gamma distortion without calibration. However the technologies aforementioned are limited to narrow fringe stripes, because wide fringe stripes crease the quality of sinusoidal curve generated by de-focusing technology [10]. In order to solve this problem, Recently more improved methods has been researched. Wang Y [11] brings dithering technique into profilome-try, and shows its ability to improve the fringe quality, especially for wide fringes. However the dithering tech-niques are originally developed for global similarity. Jiang H [12] proposes to use a kind of triangle pattern to get the sinusoidal curve. It has the potential to be used * Correspondence:[email protected]
Faculty of Robot Science and Engineering, Northeastern University, Shenyang, China
as the wide stripes pattern, but the boundary of triangle is a straight line which will affect the quality of defocus-ing stripes. Xiao Y [13] proposes to combine intensity and phase to solve wide stripes. Besides the accuracy of the narrow stripes and wide stripes are compared. In order to reduce the errors caused by wide stripes, Fu Y, et al. [14] propose a non-uniform periodical binary fringe defocusing projection. Xian and Su [15] develop
the area modulation grating technique. This pattern make use of the two-dimensional information to solve the bottleneck of wide stripes. Other modified technolo-gies are also researched. Pérez O G, et al. [16] propose a two-step trapezoidal-pattern phase-shifting method for 3D shape measurements. The process of shifting is based on the two trapezoid with phase shift T/2 where T is the period of every trapezoid. Because it only need two
Fig. 1The sinusoidal curve can be presented by a series of rectangles
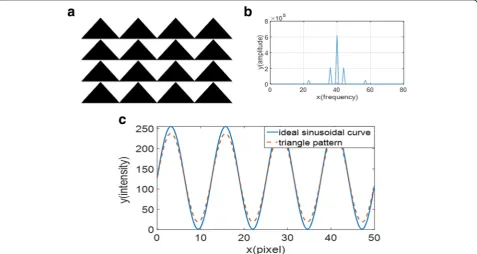
Fig. 2The triangle binary pattern.aThe triangle pattern.bThe relationship between frequency and amplitude.cThe comparison between ideal sinusoidal curve and defocusing triangle pattern
patterns, it is more applicable to be used as wide stripes. But this pattern should be combined into at least eight RGB color images. Su [17] uses the area method to gen-erate wide stripes. The advantage of this method can get high quality sinusoidal, but the process is time-costing.
In this paper, we propose an ellipse binary pattern to solve this problem caused by large period. By using de-focusing technology, the harmonics and high frequency noise can be effectively suppressed. With the increasing of defocusing amounts, a similar sinusoidal pattern can be gradually obtained from the improved pattern, be-sides the phase errors can be reduced rapidly until the phase error is close to zero. Simulations and experimen-tal results demonstrate the proposed pattern can get more accurate results compared with other methods be-sides it is robust to different periods.
Methods
Phase-shifted algorithm
In this paper, three-step phase-shifted algorithm with a phase shift 2π/3 is applied, because it need the least for-mulas for its simplicity and speed. The sinusoidal light intensity can be described as:
I1ðx;yÞ ¼A xð ;yÞ þB xð ;yÞcos½φðx;yÞ ð1Þ
I2ðx;yÞ ¼A x;ð yÞ þB x;ð yÞcos½φðx;yÞ þπ=3 ð2Þ
I3ðx;yÞ ¼A x;ð yÞ þB x;ð yÞcos½φðx;yÞ þ2π=3 ð3Þ
Where A(x,y) is the average intensity, B(x,y) is the in-tensity modulation, andφ(x,y) is the phase needed to be calculated. Based on the Eqs. (1)-(3), the φ(x,y) can be gotten.
φðx;yÞ ¼ tan−1 pffiffiffi3ðI1−I3Þ=ð2I2−I1−I3Þ
h i
ð4Þ
Φðx;yÞ ¼φðx;yÞ þk x;ð yÞ 2π ð5Þ
Equations (4)-(5) show the relationship between the wrapped phase and the absolute phase. Where k(x,y) is the order of wrapped phase.
The theory of improved ellipse binary pattern
In order to explain the principle and advantage of ellipse binary pattern, firstly the theory about sinusoidal curve will be illustrated. The sinusoidal curve distribution can be presented as:
c xð Þ ¼0:5þ0:5 cos 2π p x
ð6Þ
Wherec(x) ranges from 0 to 1,pis the period of every sinusoidal curve. It can be divided into a series of parts with the same pixels along x direction. As shown in Fig. 1, assuming there are Nx equal parts in a period. The sinusoidal curve can be presented by a series of rectangles approximately. Because the input image is discrete, it can be presented as:
c−ð Þ ¼n 1
ω
Z ðnþ1Þω
nω c xð Þ
½ dx¼0:5þ0:5 sinc π Nx cos
2nþ1 Nx π
ð7Þ
Where ω=p/Nx which is the width of every part, and sinc(x) = sinx/x.
Based on the theory of reference [17], the meaning of Eq. (7) is that the intensity of sinusoidal curve can be presented by performing integral of area. The width of rectangle is set to havew pixels and the height is set to havehpixels. The area of every part isS = w*h.The area
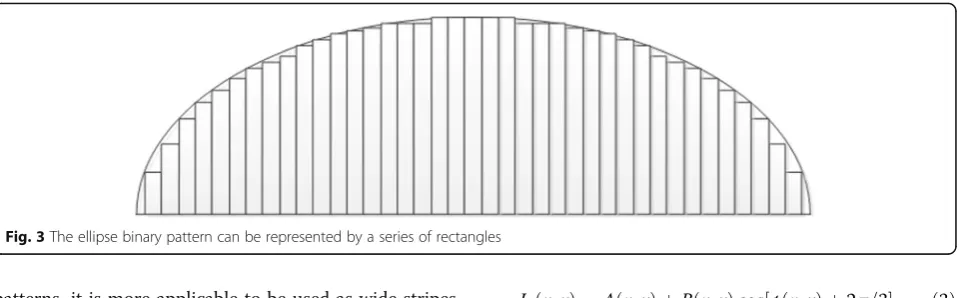
Fig. 3The ellipse binary pattern can be represented by a series of rectangles
of every rectangle is set to Si (i∈(0, 1, 2 ..…)), then the intensity can be can calculated as Eq. (8):
Iout¼Si=S ð8Þ
When the wide stripes are used, a binary pattern is de-signed to get the ideal sinusoidal curve which consists of the binary ellipse pattern. This pattern is an improved technology of binary triangle fringe pattern which have proved that it has the ability to generate sinusoidal pat-tern [12]. Because the boundary of triangle is a straight line, the integral value is approximate linear relation. From the Fig. 2, we can find that triangle can not get perfect sinusoidal curve. Figure 2a is the triangle binary pattern, Fig. 2b is the relationship between frequency and amplitude. Figure 2c is the comparison between ideal sinusoidal curve and defocusing triangle pattern.
The process of defocusing makes the intensity suffer from attenuation especially at the crest and trough.
The binary pattern is a unit which will be transformed into a sinusoidal pattern when the edge is defocused. Every unit can be expressed as Iunit(x,y), herexand y represent the image coordinate in the projector. As shown in Fig. 3, the ellipse binary pattern consists of a series of rectangles. In a unit, the width of every rectangle is set to have W pixels and the height is set to have H pixels. Because every pixel value is discrete, the area of this part is S = W*H. If there are N1 pixels with zero intensity, the output intensity can be described by the ratio between the N1 and S. In order to get accurate intensity, we use every column as an area which means the ratio between the number of pixels in the ellipse and all the pixels in the same column can be used to present the intensity in this column.
The edge of binary unitIunit(x,y) is blurred alongxory direction in the high frequency. The length of every unit
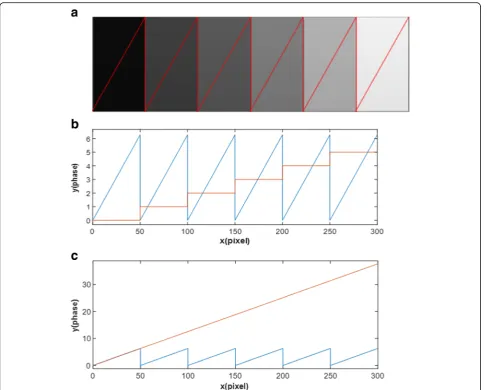
Fig. 5aThe intensity corresponding to wrapped phase;bThe order of stair and wrapped phase;cThe relationship between wrapped phase and absolute phase
should be blurred based on the height of binary pattern to get an ideal sinusoidal curve. A smooth gray intensity can be gotten by defocusing technology or filter effect of bin-ary ellipse pattern. The defocusing of ellipse alongx direc-tion can be expressed as Eq. (8):
Iblurð Þ ¼x
Z b
0
Iunitðx;yÞdy ð9Þ
Here x and y are the coordination of the image in the projector, b represents the length of semi-minor axis of every ellipse unit. A similar approach can be used to get the dithering pattern along y direction, as shown in Eq. 9.
Iblurð Þ ¼y
Z a
−a
Iunitðx;yÞdx ð10Þ
Similarly,xandyare the coordination of the image in the projector andarepresents the length of semi-major axis. In order to express the property by using formula, a special unit is analyzed, the semi-major axis is set toxdirection and the width of this unit isa, similarly the semi-minor axis is set to ydirection and the height of it is set tob, as shown in Fig. 4.
Based on the mathematical theory, the gray intensity of every pixel in the unit can be expressed as follows:
I¼
1 x
2
a2þ
y2
b2>1
0 x
2
a2þ
y2
b2≤1
8 > > > > < > > > > :
ð11Þ
Here x∈[−a,a],y∈[0,b], when the improved pattern is blured horizontally, the gray intensity in each column would be the same, which can be derived using polar co-ordinates as follows:
Iblurð Þ ¼x
x¼acosð Þθ y¼bsinð Þθ
ð12Þ
θis the polar angle, the range is from 0 toπ. In every column, the gray intensity in the vertical direction is de-termined as shown in Eq. (12):
I0blurð Þ ¼x 1 b
Zb
0
Nunitðx;yÞdy ð13Þ
Because the pixels are discrete quantity, the intensity can be described by the ratio between areas. The inten-sity can be indicated as discrete equation, as shown in Eq. (13):
Fig. 6aThe improved binary pattern;bThe 2D Fourier transformation results;cThe results generated by using 2-D Gaussian smoothing filter
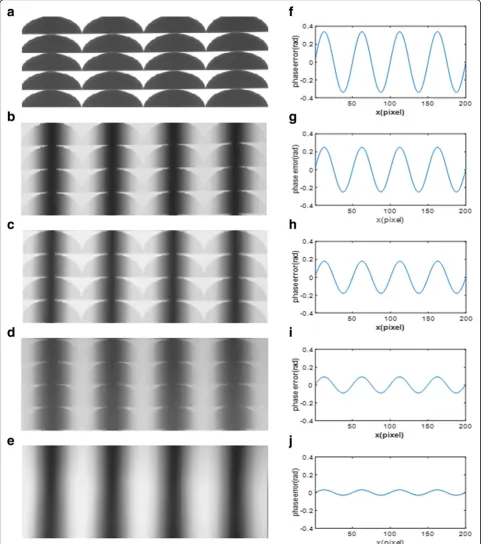
Fig. 8Sinusoidal fringe generation from sightly defocusing to significant defocusing. The left columna-eshow binary pattern under different defocusing levels. The right columnf-jshow the 100th cross section phase errors
I0blurð Þ ¼x 1 b
Zb
0
Nunitðx;yÞdy
¼1
b
X
bsinθ
0
Nunitðx;yÞ
ð14Þ To provide a concrete fringe pattern, here the semi--major axis and semi-minor axis are seta= 6 andb= 4 re-spectively, then the range of x direction isx∈[−6, 6] and the range of y direction isy∈[0, 4].
The process of defocusing is similar to a lens system with a 2D Gaussian function which can be represented as Eq. (15).
G x;ð yÞ ¼ 1 2πσ2e
−ððx−x−Þ2þðy−y−Þ2Þ=2σ2
ð15Þ
Where σ is the standard deviation, it determines the width of Gaussian function. For extensive defocusing, this parameter is large so that the size of filter is narrow. Based
Fig. 10Experimental results comparison by using different binary defocusing pattern.aThe measurement result based on SBM.bThe measurement result based on SPWM.cThe measurement result based on OPWM.dThe measurement result based on the proposed method
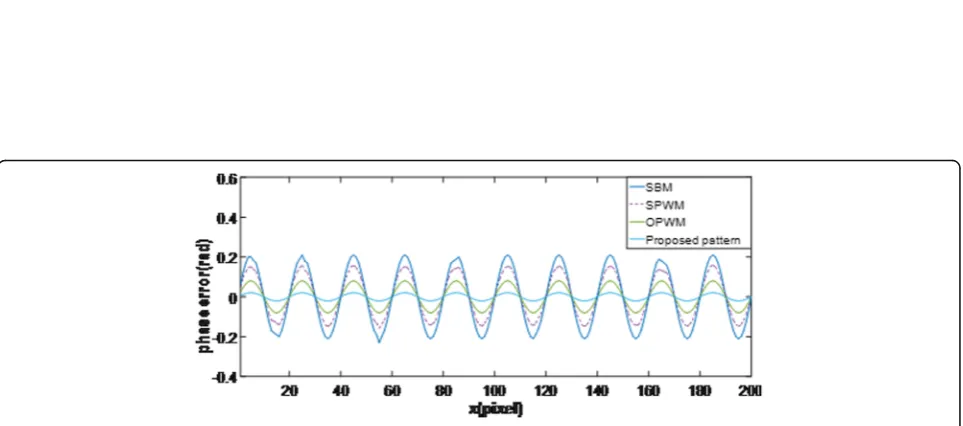
Fig. 11Phase errors comparison among different binary patterns
on the Eqs. (1)-(3), the output intensity can be gotten by convolution between the input image and the Gaussian function, the process can be represented as:
Icðx;yÞ ¼I0blurðx;yÞ
g xð ;yÞ ð16Þ
WhereIc(x,y) is the output image,g(x,y) is the Gaussian function, because Gaussian filter is isotropic, so theIc(x,y) can be gotten by convolution along xaxis and yaxis, re-spectively. In this paper, we use the 2D Gaussian function, so the output intensity can be calculated as:
Ic¼ I0blurðx;yÞ
g xð Þ
g yð Þ ð17Þ
Equation (17) shows the blurred fringe pattern after the defocusing technology. The process of convolution can be presented in frequency domain. The projected sinusoidal fringes in Eqs. (1)-(3) can be presented in time domain as:
IPðx;yÞ ¼IaþImcosðω0tþΔφÞ ð18Þ
Where Ia is the average intensity, Im is the modula-tion intensity. ω0= 2π/Tand T is the period of fringe
pattern, Δφ is the shifted phase value. The fringe pat-tern can be described in frequency domain, as shown in Eqs. (19)-(21):
F
Ipðx;yÞ
¼Ia2πδ ωð Þ þIm
π δ ω½ ð −ω0Þ þδ ωð þω0Þ
expðjωΔφÞ ð19Þ
F g x;f ð yÞg ¼ exp −σ
2ω2
2
¼F jð Þ ¼ω Fð−jωÞ ð20Þ
F Ipðx;yÞ
F g xf ð ;yÞg ¼Ia2πδ ωð Þexp −σ
2ω2
2
0 @
1 A
þImπ δ ω½ ð −ω0Þ þδ ωð þω0Þexp jωΔφ−σ 2ω2
2
0 @
1 A
ð21Þ
By using inverse Fourier transform, the output inten-sity can be calculate as Eq. (22):
Ipðx;yÞ ¼Iaþexp −σ 2ω2
2
þImcosðω0tþΔφÞ ð22Þ
In this paper, the proposed pattern need extensive de-focusing but the projector can still be modeled as a 2D Gaussian function, the defocusing process is also suit to ellipse binary pattern.
Phase unwrapping
In Methods section, Eq. (4) calculates wrapped phase with the range of (−π,π). The traditional method is based on temporal phase unwrapping algorithm or spatial phase unwrapping algorithm. The aim of unwrap-ping phase is to get the order of every wrapped phase. We use a stair intensity image, and the period of differ-ent intensity is perfectly aligned with the period of wrapped phase.
Figure 5 demonstrates the principle. A stair image can be generated as:
Isðx;yÞ ¼floor x½ð þP=2Þ=P S ð23Þ
Where P represents the period of every wrapped phase. floor keeps the integral part. S is the intensity level for each stair. In order to overcome the albedo, it is necessary to normalize the intensity. The normalization process need the maximum and minimum intensity for each pixel which can be calculated as:
Iminðx;yÞ ¼A xð ;yÞ−B xð ;yÞ ð24Þ
Imaxðx;yÞ ¼A x;ð yÞ þB x;ð yÞ ð25Þ
Where A(x,y) andB(x,y) can be gotten from Eqs. (1)-(3), so the stair pattern can be normalized using the fol-lowing equation:
Isnðx;yÞ ¼ Isðx;yÞ−Iminðx;yÞ Imaxðx;yÞ−Iminðx;yÞ
ð26Þ
The order of every wrapped phase can be gotten: k x;ð yÞ ¼Insðx;yÞ R
S ð27Þ
In the formula,Ris the intensity captured by the cam-era andSis the intensity level of each stair.
Results and discussion
Simulation
The process of defocusing can be modeled as a 2D Gaussian smoothing filter. Based on the Eq. (15), the process of simulation are shown in Fig. 6. Figure 6a shows the original ellipse binary pattern. The 2D Fourier transformation of the original pattern is shown in Fig. 6b. After using Gaussian smoothing filter and inverse Fou-rier transformation, a clear sinusoidal curve can be gen-erated, as shown in Fig. 6c. From the results, we can find high-frequency harmonics are almost completely suppressed besides there is little difference between them.
Moreover, different defocusing levels (the filter sizes are set 4, 12, 20) are stimulated by using Gaussian filter. The simulation results are shown in Fig. 7a-c. From left to right, the amount of defocusing increases and corre-sponding phase errors are shown in Fig. 7d. From the simulation results, we can find that the phase error re-duces when the amount of defocusing increases, but the distinction is not large. This means that the proposed technique can be used to generate clear sinusoidal curve besides it is robust to the change of different defocusing levels.
Experiment 1. Generating sinusoidal curve
The phase error caused by different amounts of defocus-ing are experimented first. Based on the theory of im-proved pattern, an ellipse binary pattern are projected under different defocusing amounts. As shown in Fig. 8, when the defocusing level increases, the binary pattern gradually becomes a sinusoidal pattern. Because the in-fluence of defocusing is similar to using Gaussian filter, the edge of binary pattern can be blurred along y direc-tion. The first row of Fig. 8 shows the different defocus-ing amounts of binary pattern, the second row of Fig. 8 shows the phase errors. From the results, we can find that when the projector is in focus, we can get the bin-ary pattern, but there is the largest the phase error. With the increasing of defocusing amounts, a similar sinus-oidal pattern can be gradually obtained from the im-proved pattern, besides the phase errors can be reduced, until the phase error is close to zero. The projector was adjusted from slightly defocusing to extensively defocusing.
Experiment 2. Comparison between the improved method and traditional methods
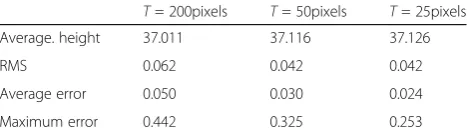
In order to verify the feasibility and accuracy of im-proved binary pattern in this experiment, a white house is measured. Based on the experimental results from Ex-periment 1, a clear modulated sinusoidal fringe pattern can be gotten. For all the measurements, the projector and the camera are fixed. To test the proposed pattern, Table 1The measurement comparison of Experiment 3 under
different periods. (Units: mm)
T= 200pixels T= 50pixels T= 25pixels Average. height 37.011 37.116 37.126
RMS 0.062 0.042 0.042
Average error 0.050 0.030 0.024
Maximum error 0.442 0.325 0.253
results are shown in Fig. 10, which is based on the SBM, SPWM, OPWM and the proposed pattern, respectively. From the measurement results, we can find that the measurement accuracy using the improved technology is better than that of traditional methods. There is little noise for the proposed method.
To evaluate the measurement accuracy, phase errors are also measured to compare the accuracy of different binary patterns. Two absolute phase maps are needed. One absolute phase is based on the projector calibration and the other is based on the binary defocusing technol-ogy. The difference between these two absolute phase were calculated as measurement errors. The final experi-mental results about the absolute phase errors are plot-ted in Fig. 11.
By analyzing phase errors, we can find when the de-focusing binary patterns are at the same dede-focusing level and they have the same period, the range of the phase error agrees well with the simulation analysis. The aver-age phase errors proved that OPWM performs better than SBM and SPWM, whose maximum phase error is
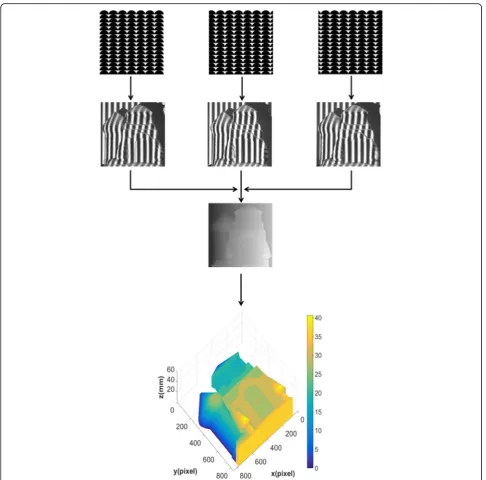
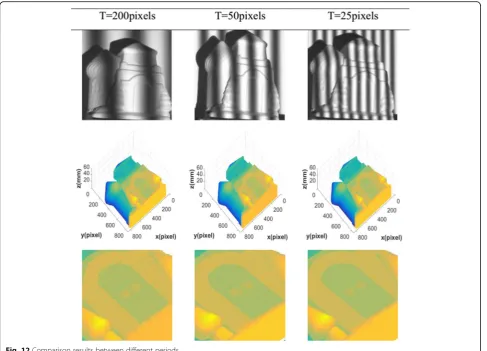
pattern while the camera captures the defocusing modu-lation stripes. After the absolute phase is calculated, the phase-height mapping relationship is used to get the 3D point clouds. The fringe number is set to 2,4,8 where the fringe periods are 200 pixels, 50 pixels, and 25 pixels re-spectively. As shown in Fig. 12.
The comparison measurement experiment in different periods are captured respectively, as shown in the first row of Fig. 12. The corresponding 3D reconstruction re-sults are shown in the second row of Fig. 12. In order to give a specified comparison, the enlarged view of recon-struction results are shown in the third row of Fig. 12. From the results, we can find that the accuracy of meas-urement increases as the period becomes smaller and the surface become more smooth, but the difference is very small.
The measurement comparison with different periods are listed in Table 1, which includes average height, root-mean-square (RMS), average error and maximum error. When the fringe periods are 200 pixels, 50 pixels, and 25 pixels, the RMS is 0.062 mm, 0.042 mm
0.042 mm, respectively. We also find that the average error range changes from 0.050 mm to 0.024 mm when the period decreases from 200 pixels to 25 pixels. It indi-cates that the proposed method can successfully recon-struct the 3D point cloud and the accuracy of our proposed method is robust and suit to large period of fringe pattern.
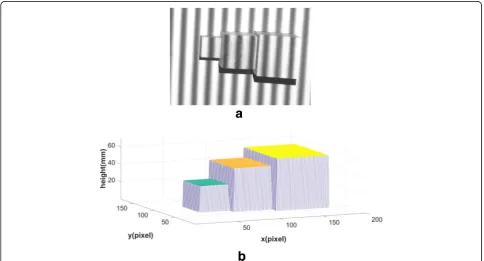
We aim to further to testify its ability to measure the step block, the step-height is about 60 mm, 50 mm, 30 mm respectively and compare it with the ideal sinusoidal curve with projector’s nonlinear gamma correction. The experimental results are shown in Fig. 13. Figure 13a shows the object with modulation information. Figure 13b shows the meas-urement result. Table 2 lists the ideal height, mea-sured height, absolute error and RMS error for different measuring height. From this table, we can find that the absolute error is 0.078 mm, 0.051 mm, 0.031 mm, moreover RMS is 0.025 mm, 0.018 mm, 0.011 mm, respectively. We can find the difference between measured results and the ideal sinusoidal re-sults is very small. This further verify the success of the proposed pattern.
Based on the experiments, we can find high frequency can cause severe phase errors. The experimental results verify the simulation analysis. This means when the har-monics are suppressed, the phase errors are eliminated well. The proposed pattern can get better measurement results. The improved defocusing ellipse pattern do not require to calibrate the nonlinear gamma of the pro-jector because the binary pattern only need two gray-scale values. It can suppressed the high-order harmonics effectively by defocusing and the high-frequency noise are eliminated because of the low-pass filtering effects of defocusing. From the comparison results, we can find that when the projector is in a significantly defocusing, the ellipse pattern performs better compared with trad-itional methods. Moreover, The accuracy of the meas-urement will not be affected by the large period of stripes which are robust and suit to high-accuracy meas-urement. However, there are the following disadvan-tages. Because this improved binary pattern uses three steps phase-shifted to obtain one three-dimensional shape and therefore its measurement speed is low as well as the accuracy of sinusoidal fringe determine the
precise of measurement. Any error in the measurement system and calibration parameters will add phase error into the final results. Therefore, better hardware is needed to get high quality sinusoidal curve.
Conclusions
In this paper, an improvement binary ellipse pattern is proposed for high-accuracy 3D measurement profilome-try. By explaining the defocusing theory combining the phase-shifting technique, it is easy to generate high-quality sinusoidal fringe pattern, besides the process is similar to the low-pass filtering which eliminated the high harmonics and high-frequency noise. By analyzing the property of proposed pattern, the simulation results are given. Experiment results have demonstrated the feasibility and accuracy of the improved binary pattern besides it proved that the period of fringe pattern has lit-tle impact on the accuracy of measurement.
Abbreviations
3D:Three-dimensional; OPWM: Optimum pulse width modulation; SBM: Squared binary defocusing technique; SPWM: Sinusoidal pulse width modulation
Acknowledgements
This work was supported by the Fundamental Research Funds for the Central Universities (N150403009) and the Fundamental Research Funds for the Central Universities (N162610004).
Funding
Faculty of Robot and Engineering of Northeastern University provides the funding for this research.
Availability of data and materials Details data has been provided in this paper.
Authors’contributions
Both authors contributed equally in all the sections of this work. Both authors read and approved the final manuscript.
Authors’information
Feng Lu, a doctor of Faculty of Robot Science and Engineering, Northeastern University, Shenyang, China. His interest includes Structured light, Robot and image processing.
Consent for publication Not applicable.
Competing interests
The authors declare that they have no competing interests.
Publisher’s Note
Springer Nature remains neutral with regard to jurisdictional claims in published maps and institutional affiliations.
Received: 20 July 2017 Accepted: 5 October 2017
References
1. Chen, W, Su, X, Cao, Y, et al.: Method for eliminating zero spectrum in Fourier transform profilometry. Opt. Lasers Eng.43(11), 1267–1276 (2005) 2. Geng, J: Structured-light 3D surface imaging: a tutorial. Adv. Opt.
Photo-Dermatology.3(2), 128–160 (2011)
3. Su, X, Chen, W: Fourier transform profilometry: a review. Opt. Lasers Eng.
35(5), 263–284 (2001) Table 2Measured average step height of Experiment 4 at 60,
50, 30 (unit: mm)
Number 1 2 3
Ideal height 60 50 30
Measured height 60.078 49.949 30.031
Absolute error 0.078 0.051 0.031
RMS error 0.025 0.018 0.011
(2010)
9. Wang, Y, Zhang, S: Optimum pulse width modulation for 3-D shape measurement with projector defocusing. Opt. Lett.35, 4121–4123 (2010) 10. Zuo, C, Chen, Q, Gu, G, et al.: High-speed three-dimensional shape
measurement for dynamic scenes using bi-frequency tripolar pulse-width-modulation fringe projection. Opt. Lasers Eng.51(8), 953–960 (2013) 11. Wang, Y, Zhang, S: Three-dimensional shape measurement with binary
dithered patterns. Appl. Opt.51(27), 6631–6636 (2012)
12. Jiang, H, Zhao, H, Diao, X, et al.: High-speed triangular pattern phase-shifting 3D measurement based on the motion blur method. Opt. Express.25(8), 9171 (2017)
13. Xiao, Y, Li, Y: High-quality binary fringe generation via joint optimization on intensity and phase. Opt. Lasers Eng.97, 19–26 (2017)
14. Fu, Y, Wang, Z, Yang, J, et al.: Period correction method for binary fringe defocusing projection. Optik–Int. J. Light Electron. Opt.125(22), 6722–6726 (2014)
15. Xian, T, Su, X: Area modulation grating for sinusoidal structure illumination on phase-measuring profilometry. Appl. Opt.40(8), 1201–1206 (2001) 16. Pérez, OG, Flores, JL, García-Torales, G, et al.: Gray coded trapezoidal fringes
for 3-D surface-shapemeasurement[C]//Infrared Remote Sensing and Instrumentation XXII. Int. Soc. Opt. Photon.9219, 92190M (2014)