World Maritime University
The Maritime Commons: Digital Repository of the World
Maritime University
World Maritime University Dissertations Dissertations
2000
Feasibility study for the establishment of port waste
reception facility in context of ports in South Asian
countries
Abu Hena Mohammad Mamun World Maritime University
Follow this and additional works at:http://commons.wmu.se/all_dissertations Part of theInfrastructure Commons
This Dissertation is brought to you courtesy of Maritime Commons. Open Access items may be downloaded for non-commercial, fair use academic Recommended Citation
Mamun, Abu Hena Mohammad, "Feasibility study for the establishment of port waste reception facility in context of ports in South Asian countries" (2000).World Maritime University Dissertations. 304.
WORLD MARITIME UNIVERSITY
Malmö, SwedenFEASIBILITY STUDY FOR THE
ESTABLISHMENT OF PORT WASTE
RECEPTION FACILITY
In context of Ports in South Asian Countries
By
ABU HENA MOHAMMAD MAMUN
Bangladesh
A dissertation submitted to the World Maritime University in partial fulfilment of the requirements for the award of the degree of
MASTER OF SCIENCE
in
SHIPPING MANAGEMENT
DECLARATION
I certify that all the material in this dissertation that is not my own work has been identified, and that no material is induced for which a degree has previously been conferred on me.
The contents of this dissertation reflect my own personal views, and are not necessarily endorsed by the university.
……… (Signature)
……… (Date)
Supervised by: Captain Jan Horck
Lecturer, Shipping Management World Maritime University
Assessor:
Professor Bernard Francou
Associate Professor, Port Management World Maritime University
Co-assessor: Per H. Olson
Dedicated to
My parents
Acknowledgement
I would like to express my sincere gratitude to all those who have contributed to get this work done. First of all I would like to thank the Bangladesh Shipping Corporation Authority for nominating me for this study and the Tokyo Foundation of Japan to provide me the fellowship.
My gratitude to Mr. Kristian R. Fuglesang of INTERTANKO, Oslo, for suggesting the topic and Mr. Tim Wilkins of INTERTANKO, London, to guide me to begin the study. During the study I received help from a good number of people and organisations virtually all around the world. I can not avoid mentioning few names to convey my words of gratitude for extending their kind help to accomplish this study.
Norwegian Maritime Directorate and The Maritime and Coastguard Agency (MCA) of UK for their assistance in providing materials and information.
I would also like to convey my thanks to port authorities, those who have replied the questionnaire on port waste reception facilities in their ports. I also like to thank Mr. Sajid Hossain of Chittagong Marine Academy, and Mr. A. F. M. Sirajul Islam of Bangladesh Mercantile Marine Department for helping me with valuable information from Bangladesh.
Few words of gratitude to my university authority, professors and stuffs, especially to Professor Shuo Ma, Professor Donner, Professor Francou, Lecturer Captain Horck for their valuable advice, guidance, and supervision. Also special thanks to our library stuffs MR. David Moulder, Susan Wangeci-Eklow, and Cecilia Denne for their relentless effort to provide me the assistance in getting the right material. Also thanks to my fellow colleagues in WMU from Bangladesh, India, and Sri Lanka for helping me in getting clarification of few enquiries.
Finally thanks to my wife for her encouragement in this study and to show deep patience along with my two children to except my absence from being with them during the busy days of my studies.
Abstract
0.1 Statement of problem
Protection of environment is a growing concern all over the world. The concern is no more limited to national boundary due to the fact that environmental pollution is a transboundary problem. Oceans and air are the two most important media for this transboundary nature of pollution. Among various sources of ocean pollution, about 12 % is contributed by shipping. One of the highest priorities on IMO's agenda is the control of pollution caused by shipping. Although not possible to eliminate totally, but at least reducing of waste disposal from ships is the aim of the MARPOL 73/78 Convention. Waste reception facilities in ports are in fact the sine qua non for ships to prevent disposal of ship generated wastes at sea. From this point of view it is a prerequisite element to ensure the implementation of the MARPOL Convention.
The necessity of waste reception facilities in ports is established beyond any doubt. But unfortunately many ports around the world have failed to ensure an adequate waste reception facility. The problem is world wide, but more acute for impoverished countries those who are unable to solve the environmental degradation problems even within their own country. On one side the mounting pressure for the compliance with international regulations and on the other side unavoidable practical hindrances have created a dilemma for these countries.
0.2 Study objectives
0.3 Study parameters
The geographical parameter for this study is limited to the major seaports in South Asian countries, namely, Bangladesh, India, Maldives, Pakistan, and Sri Lanka. The vessel categories covered in this study are mainly all types of dry cargo vessels and liquid tankers except chemical tankers. However, the chemical tankers are not very exceptional from the requirement point of view other than the speciality of the cargo waste generated on board those vessels. Types of wastes covered are mainly the MARPOL 73/78 Annex I and V wastes.
0.4 Methodology
Published information on ship's wastes and waste reception facilities, interview and correspondence with experts, specialists and professionals working in this field as well as with organisations related to the subject matter, along with the author's view from personal experience and analysis were the main source of material for this feasibility study. Published information on overall economic condition of the region was also referred as to ascertain the feasibility in this context. A questionnaire was also prepared in addition and sent to 18 major seaports in South Asia to take into account the views of ports in question. However, only 6 questionnaires were returned within the time frame of this study.
0.5 Findings and recommendations
The findings of this study reveal that a co-operative effort is the best way of solving this problem. Co-operation can be among countries and ports in the same region as well as among different entities within the country. Recommendations alone can not help to change the situation if there is no strong political will.
different perspective. It is a common attitude to blame the ships for pollution and generally a ship means the personnel onboard, not the shipowner, because they remain out of the scene. But, like everyone on land, ship personnel also like to sea a clean sea, but sometimes they are compelled to cause an act of pollution. The reason behind this is that the shore-based facilities are not enough and the shipowners do not like to spend lot of money "just" for waste disposal.
A reflection of this feeling may be seen in this study which possibly made the recommendations little different from usual.
Key words: South Asian Region, Marine pollution, MARPOL 73/78 Convention,
Table of contents
Declaration ii
Acknowledgement iv
Abstract vi
Table of contents ix
List of tables xiv
List of figures xvi
List of abbreviations xvii
1. Introduction 1
1.1 General 1
1.2 Background 1
1.2.1 History 2
1.2.2 International Maritime Organisation 3
1.3 Reception facility 3
2. Ship generated wastes 5
2.1 General 5
2.2 Waste from ships 5
2.3 Types of ship-generated wastes 6
2.4 Impact of ships' waste discharge into the sea 7
2.4.1 Environmental impact caused by oil or oily substances 8
2.4.2 Environmental damage caused by solid wastes 9
3. Legislation and regulations 12
3.1 General 12
3.2 International conventions 12
3.2.1 Regional agreements and co-operation 13
3.2.2 Global conventions and commitments 15
3.2.2.1The London Dumping Convention 15
3.2.2.2The MARPOL Convention 16
3.2.2.3The Law of the Sea III 17
3.2.2.4Agenda 21 18
3.2.3 National legislation 18
4. Studies on quantity and type of shipboard wastes 23
4.1 Annexes of the MARPOL 73/78 Convention 23
4.2 Waste quantities onboard ships 25
4.2.1 Oil and oily wastes 26
4.2.2 Solid wastes (garbage) 31
5. The region: South Asia 35
5.1 General 35
5.2 Population and general economic condition 35
5.3 Shipping in South Asia 36
5.4 Ports in South Asia 37
5.4.1 Bangladesh 38
5.4.2 India 38
5.4.3 Maldives 40
5.4.4 Pakistan 40
5.4.5 Sri Lanka 41
6. Conceptual plans on establishment of waste reception facilities:
Port of Mumbai and Port of Chittagong 44
6.1 General 44
6.2 Assessment of waste quantities 44
6.2.1 Port of Mumbai 45
6.2.2 Port of Chittagong 53
6.2.3 Oily ballast water 60
6.3 Selection of site 61
6.4 Collection of waste 61
6.5 Economic feasibility 62
6.5.1 Optimal level of marine pollution 62
6.5.2 Division of external costs 63
6.5.3 Measurement of benefit and external cost 64
6.5.4 Economic feasibility for technical choice 65
6.6 Recovery of costs 66
6.6.1 The direct charge system 67
6.6.2 The no-special fee system 67
6.6.3 The free of charge system 67
7. Waste reduction and management 68
7.1 General 68
7.2 Reduction of waste quantities 68
7.2.1 Waste reduction onboard tankers 69
7.2.1.1Load on top 69
7.2.1.2Segregated ballast tank 70
7.2.1.3Crude oil washing 70
7.2.2 Shipboard waste processing equipment 70
7.2.2.1Oil Filtering Equipment 71
7.2.2.2Incinerators 71
7.2.2.3Sewage treatment plants 72
7.2.3 IMO guidelines on waste reduction 73
7.3 Waste management 73
7.3.1 Shipboard waste management plan 74
7.3.2 Waste management at port 76
7.3.2.1Incineration 76
7.3.2.2Landfarming 77
7.3.2.3Controlled storage or landfill 77
7.4 Disposal options for ships' wastes 77
7.5 Waste management in South Asian ports 77
8. Potential barriers 79
8.1 General 79
8.2 Analysis of potential barriers 79
8.2.1 Lack of awareness 79
8.2.2 Financial limitation 80
8.2.3 Legislative or regulatory vacuum 81
8.2.4 Customs regulations 81
8.2.5 Relative competitiveness of ports and cost recovery 82
8.2.6 Lack of technology and trained personnel 82
8.2.7 Other factors 83
8.3 Public awareness 83
9. Recommendations and conclusions 84
9.1 General 84
9.2 Recommendations 84
9.2.1 Removal of barriers at national level 85
9.2.2 To enhance regional co-operation 87
9.2.3 To set up appropriate policies on implementation 89
9.2.4 To augment technical co-operation for self-dependency 91
9.3 Conclusion 93
References 95
Appendix A 99
Appendix B 104
Appendix C 108
List of Tables
Table 1.1 Percentage share of the means of transports in some
important areas 1
Table 2.1 Time required for decomposition of different materials
at sea 10
Table 3.1 Global Agreements/Action Plan on environment protection
and marine pollution prevention applicable for the present study 15 Table 3.2: The annexes of the MARPOL 73/78 Convention 17 Table 3.3: Status of relevant International Conventions concerning
Marine Pollution for the countries in South Asian Region 19 Table 4.1 Solid oily wastes produced on board different types and sizes
of ships 27
Table 4.2 Oil sludge produced onboard different types and sizes of ships 28 Table 4.3 Waste oil produced onboard different types and sizes of ships 29 Table 4.4 Oily bilge water produced onboard different types and sizes
of ships 30
Table 4.5 Solid wastes (garbage) produced onboard different types and
sizes of ships 32
Table 4.6 Numbers of crew and passengers distributed on gross register
tonnage for different types of ships 33
Table 6.1 Ship calls by type & size of vessels at Port of Mumbai for the year 1996-97 and expected quantity of waste generated onboard
per day 45
Table 6.2 Overseas traffic (Imports 1996-97) to Port of Mumbai
by commodities and by area/country of their origin 47 Table 6.3 Logical distribution of vessels according to origin and type of
cargo arrived at the Port of Mumbai in the Year 1996-97 48 Table 6.4(a) Total voyage days performed by different types of ships
in different routes 49
Table 6.4(b) Total voyage days performed by container ships in
Colombo and Gulf routes 50
Table 6.5 Amount of wastes produced on board different types of ships
en route to Port of Mumbai in the year 1996-97 50 Table 6.6 Amount of wastes produced onboard different types of vessel
during port stay at Mumbai in the year 1996-97 52 Table 6.7 Quantity of wastes to be delivered by all ships (overseas traffic)
to port reception facilities at Port of Mumbai based on ship traffic
of 1996-97 53
Table 6.8 Ship calls by type and average size at port of Chittagong for the year 1998-99 and quantity of wastes expected produced onboard 54 Table 6.9 Geographical distribution of imports from 1995-96 to 97-98
as % of total 55
Table 6.10 Commodity-wise import cargo as % of total import for the
years 1993-94 to 96-97 and possible type of ship for sea transport and geographical origin with percentage share of cargo 56 Table 6.11 Voyage days performed by different types of vessels in
different routes 58
Table 6.12 Total quantity of wastes under MARPOL Annex I and V to be received from overseas traffic at Chittagong port based
List of figures
Fig. 5.1 Number of ship calls in port of Karachi 41
Fig. 6.1 Optimum level of marine pollution 63
Fig. 7.1 Disposal options for oily wastes 74
Fig. 7.2 Organisation of shipboard waste handling and
List of abbreviations
COW Crude oil washing (a tank washing method)
dwt dead weight tonnage (ship's capacity)
GDP Gross Domestic Production
GNP Gross National Production
grt gross registered tonnage (ship's size)
gt gross tonnage (ship's size)
HELCOM Helsinki Commission
IMCO Inter-governmental Maritime Consultative
Organisation (previous name of IMO)
IMO International Maritime Organisation
LDC London Dumping Convention
LOSC (also UNCLOS) Law of the Sea Convention
LASH Lighter aboard ship (a barge-carrying ship)
lo-lo lifton- lift off
MB Marginal Benefit
MEC Marginal External Cost
POL Petroleum, oil, lubricants
ppm parts per million
ppp purchasing power parity
ro-ro roll-on roll-off (ship type)
SACEP South Asian Co-operative Environment Programme
SBT Segregated Ballast Tank
SPBM Single Point Buoy Mooring
UNCED United Nations Conference on Environment and Development
UNCHE United Nations Conference on Human Environment
UNCLOS United Nations Convention on the Law of the Sea
UNEP United Nations Environment Program
VLCC Very Large Crude Carrier
WTA Willingness to accept
1.
Introduction
1.1 General
Almost all modes of transport create some sort of environmental disorder. Shipping being an important mode of transport is no exception to that. Although, considering different parameters of pollution shipping is the most environmental friendly and safe mode of transport (table 1.1), but the intensity of pollution is some time much higher due to the large size of ships and the density of traffic in some confined ocean transport routes. Another reason for which the pollution caused by ocean shipping is getting more attention is the international nature of this transport. As a result, with increasing global awareness for environment protection, prevention of ocean pollution has become a priority.
Table 1.1 Percentage share of the means of transports in some important areas
Parameters Air Rail Shipping Road
Noise 26% 10% 0% 64%
Use of land 1% 7% 1% 91%
Infrastructure 2% 37% 5% 56%
Accidents 1% 1% 0% 98%
Source: Figures from the Danish group of scientists <Group 2000> and the Association of Danish ports. From the report <Transport in a fast Changing Europe>
1.2 Background
is caused by human behaviour rather than operation of ships. However, the approach to control these pollution types is different. The prevention of the former is primarily done by safer navigation and enhancing the safety standards of vessels. However, steps are also taken by international conventions to limit the effect and extent of any accidental pollution caused by shipping, like the International Convention on Oil Pollution Preparedness, Response and Co-operation (OPRC), 1990. Operational pollution is tried to be minimised by improved operational procedures with a view to reduce the amount of pollutants and by finding alternative solutions for waste disposal. International conventions are also adopted for this purpose. The establishment of port reception facilities for ship generated wastes is one important requirement under international conventions to reduce the operational pollution from shipping. The difficult part of control is the unscrupulous act of discharge of wastes at sea. This is considered as a crime and most of the countries have adopted the policy to stop it by taking criminal actions against the polluters, like the Oil pollution Act 1990 (OPA 90) of the United States. However, wide establishment of adequate reception facilities at ports will also help to change this attitude considerably.
1.2.1 History
The first ever step towards the protection of marine environment from pollution caused by international shipping was initiated by the United Kingdom (UK) in 1926 when they convened an international conference which was attended by 13 countries. The conference theme was to limit the discharge of oil and oily substances from ships in coastal waters. Unfortunately the conference could not succeed due to poor response from many maritime nations.
convention. The convention resulted in restricted discharge of oil and oily mixtures in certain specified areas at sea. It also required the States to establish reception facilities in their ports to receive oil slops from both tankers and non-tanker vessels. The authority of this convention was taken over by the International Maritime Organisation (the then IMCO) when it came into being in 1958. This convention entered into force on 26 July the same year.
1.2.2 International Maritime Organisation (IMO)
The resolution for the establishment of a specialised United Nations (UN) agency on maritime affairs was adopted in 1948, but it finally emerged in 1958 under the name Intergovernmental Maritime Consultative Organisation (IMCO). Later in 1982 IMCO was renamed International Maritime Organisation (IMO). However, following the emergence of IMO the first priority became safety at sea and the second became pollution prevention. Despite a few amendments, OILPOL 54 was found insufficient to cope with the marine pollution problems. As a result a totally new convention was adopted fully under the auspices of IMO in 1973, which was amended in 1978 by a protocol, and the combined instrument became known as MARPOL 73/78. This convention took into consideration all possible substances that may cause operational pollution by ocean transport. Like OILPOL, under this convention also the State parties have the implied responsibility to establish reception facilities for different types of ship wastes in their ports.
1.3 Reception Facilities
Convention and differ from place to place. According to Dr. Heath Cote (2000) reception facility "is the quid pro quo for prohibiting ships from discharging these substances at sea."
In practice a well established port reception facility should be able to receive wastes from all sorts of vessels, such as from different types of ocean going vessels, cruise ships, coastal trade vessels, ferries, fishing vessels, pleasure crafts etc. However, since the quantity of wastes produced onboard sea going vessels are comparatively large in quantity and more diverse in nature, and also since the international regulations are most stringent on these vessels, the focus of the present study will concentrate on these type of vessels.
The facilities must be sufficient enough to receive almost all kinds of wastes usually generated onboard different types of vessels normally calling that particular port and vessels should not suffer much inconvenience to deliver their wastes. Port authorities are not necessarily required to provide the service themselves, but they must ensure that vessels can use the facilities without causing any undue delay to them. In addition, ports should also ensure a safe and environmental friendly final disposal of wastes received from ships.
2.
Ship generated wastes
2.1 General
'Wastes' are defined in the Oxford English dictionary as the "materials that are not wanted" and "the unusable remains or by-products of something." Both definitions seem to fit for wastes generated onboard ships. But no general definition for shipboard wastes has been provided in the MARPOL 73/78 Convention.
According to the definition provided in art. 2(1) of the Basel Convention on the
Control of Transboundary Movements of Hazardous Wastes and their Disposal (a
United Nations convention), "Wastes" are substances or objects, which are disposed of or are to be disposed of or are required to be disposed of by the provisions of national law. However, for the purpose of port reception facilities we consider 'wastes' as solid and liquid substances or objects, which a ship intends to dispose of and is not allowed to discharge at sea under the amended MARPOL convention.
2.2 Wastes from ships
These classifications could be oily and non-oily; solid, liquid, or even gaseous; hazardous and non-hazardous; combustible and non-combustible; and so forth.
Discharge of wastes from ships depend greatly on these classifications, and hence the grouping is of significant importance both for the purpose of discharge to sea and on board processing or retention for onward delivery ashore.
2.3 Types of ship-generated wastes
As it appears from the previous paragraph the classification of ship-generated wastes can vary in many ways, it is important to have a particular categorisation to create a harmonised system and to establish identical port reception facilities all over the world. This classification has been done under the MARPOL 73/78 Convention. So far six annexes have been formulated to this regulation based on six different types of wastes generated on board ships. This will be discussed further in chapter 3.
territorial waters. However, it is better to establish a port reception facility for sewage also. In case it is not incorporated now, provision should be there to include the same whenever necessary.
Reception facilities for oily wastes and garbage are the two most essential elements for the purpose of this present study. Shipboard liquid oily waste is the most common form of waste generated on board all types of ships. The first and foremost essentiality of port reception facilities is to receive this type of waste from ships. However, port reception facilities for garbage, which includes solid wastes, like most domestic wastes and other solid wastes such as oily rags, are equally important. To establish reception facilities for the latter is comparatively easier than to create reception facilities for the former.
The most common form of liquid oily wastes include engine room bilge and sludge from oil separators and fuel tanks which are generated in all ships irrespective of size and type. Used lubricating oil is another type of oily waste generated onboard almost all ships. Other oily wastes include slops and residues in oil tankers, oil-water mixture resulting from tank washings and also oily ballast water when ballast water is carried in cargo oil tanks.
Garbage includes a variety of solid wastes, like galley and food wastes, papers, plastics, tins and cans, oily rags from machinery space, and even expired medicines and medical wastes. These wastes are produced on board all ships, but the quantity of different types of waste may vary on ship types and sizes. Further discussion on this will be in chapter 4.
2.4 Impact of ships' waste discharge into the sea
ambient temperature becomes a factor to determine the degree of damage caused by pollution, because non-gaseous pollutants are more soluble in warm water than in cold water. These pollutants like oil and human wastes consume oxygen when dissolved in water. On the other hand solubility of gases that do not react with seawater, like air or oxygen, is less in warm water. Each litre of seawater with 33 % salinity when saturated with air will normally contain 6.56ml of oxygen at 8 degrees Celcius and only 4.32ml at 30 degrees Celcius (Abeysekera, 1991). Moreover, some of the organic pollutants consume oxygen when dissolved in seawater, consequently reducing the quantity of oxygen further in seawater. This three-fold action multiplies the effect of pollution in warm water more than in cold water. The whole South Asian region is in the tropical area where the average seawater temperature is 30 degrees Celcius.
In general, vessel sourced pollution may damage fishing stocks and other forms of sea lives. However, the affect of noxious liquid substance is much more severe. Besides that the huge amount of ballast water carried from one part of the world to the other part by ships introduces alien marine species, which create danger for the indigenous species and causes an imbalance in the marine ecosystem of that area. Marine pollution also affects the tourism industry in countries where tourism is particularly based on sea and coastal resources. Since the two most common pollutants generated from ships are oil and garbage, some of the specific effects of these two are considered below.
2.4.1 Environmental impact caused by oil or oily substances
Apart from accidental oil pollution from ships, operational discharges also take place despite restrictions under the MARPOL Convention. The characteristics of these oils vary on their chemical composition and so the pollution effects.
for the body resistant to water and wind. Beneath this layer lies a heat insulating layer. Even a small coating of a few centimetres in diameter on a bird's feathers will lower its water-resistant characteristics and cause water to penetrate into the next layer and damage the heat-insulating capability. Thus drenched feathers cannot provide proper insulation and they suffer from hypothermia. In this situation they require to feed twice or thrice as much as they eat normally, which is obviously not possible due to body weakness caused by cold and by poisoning of blood cells from oil intake while cleaning feathers. Scarcity of food in contaminated water is another factor, again eating of contaminated pray causes stomach disorders. All these result in premature death for almost all the birds in the vicinity (Lützen, et al, 1996).
The effect of oil contaminants on other marine lives is less severe than on marine birds, because oils normally spread over and some are evaporated into the atmosphere. But repeated pollution in the same place affects badly on marine fauna. They might escape death from toxicity caused by pollution, but their nutritive and reproductive behaviour change considerably. Some organisms are too sensitive and just a trace of oil will cause severe damage, especially at the early stage of their lives as eggs and larvae.
The respiratory system of fish is also damaged by clogging of the gills or by changes in the gill tissues, which reduce the oxygen carrying capacity. Prolonged pollution in a particular sea area demolishes the food chain and thus brings destabilisation in the ecological balance (Alavi, 1992). Tainting effect on marine animals as well as marine plants is another impact caused by regular oil pollution. Even 0.5 microgram of oil in one kilogram of fish will be enough to change the taste of meat (Miljostyrelsen, 1982).
2.4.2 Environmental damages caused by solid wastes
garbage when not containing any toxic element is comparatively less harmful. Even then the damaging effects can not be ignored.
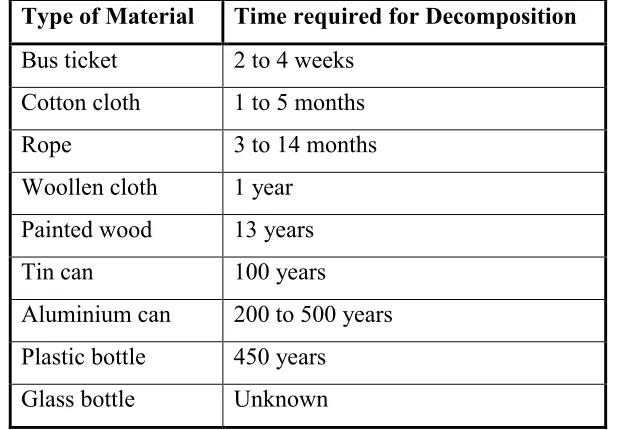
Solid waste or garbage is composed of different materials, such as paper products, food waste, glass, metal, plastic, wood, textiles, etc. According to the American National Academy of Sciences, nearly 6.6 million tons of domestic waste is discharged every year in the sea by the world merchant fleet. The rates of decomposition for different materials in marine environment are given below in table 2.1. Some of these materials can take decades, even centuries to decompose.
Table 2.1 Time required for decomposition of different materials at sea
Type of Material Time required for Decomposition
Bus ticket 2 to 4 weeks
Cotton cloth 1 to 5 months
Rope 3 to 14 months
Woollen cloth 1 year
Painted wood 13 years
Tin can 100 years
Aluminium can 200 to 500 years
Plastic bottle 450 years
Glass bottle Unknown
Source: HELMEPA (1997).
Plastic is possibly the worst material in garbage. Plastic when floating in water is mistaken by marine animals as food. The swallowed plastics make the animals sick or even can cause their death. In several instances it has been found that birds are entangled in plastic rings from beer or soft drink cans. Also fishes and other animals are found trapped in plastic objects and starve to death.
The MARPOL Convention does not particularly mention to differentiate various types of oily wastes and garbage for the purpose of delivery to reception facilities, but it is indeed necessary and advisable to separate these wastes further for various reasons. Some refineries are reluctant to receive slops which are mixed with sludge because of the problem they face to fractionate such residues. Food wastes, which are disposed at port and not incinerated ashore, may cause health hazards in the locality and hence, should be taken special care of when collecting and disposing.
Port reception facilities, which incorporate incineration plants, prefer solid wastes to be separated into combustible and non-combustible wastes. On the other hand there is a lot of waste, which may be recycled, such as papers, plastics, glasses, aluminium and tins, and hence should be separated as far as possible, because, some ports where such segregation would be too expensive will prefer to receive wastes separated from each other. Apart from situations mentioned above, under all circumstances hazardous materials should be delivered separately to port reception facilities with a specific note to the receiving party.
Onboard segregation of wastes can lower the cost of waste delivery in some ports. Sometimes delivery charges for wastes differ on type of waste. Besides segregation will encourage recycling of wastes, which is rather more environmental friendly due to the conservation of scarce materials. This is very important for the countries in the area of study due to their underprivileged socio-economic structure.
3.
Legislation and regulations
3.1 General
Waste disposal from ships has long been attempted to be regulated by both national legislation and international agreements, though the result was not at all satisfactory. In 1922 the United Kingdom took the first initiative to pass an act in the parliament called "The oil in navigable waters Act," by which the British ships were restricted to discharge oil along the coast and within the port limits. But being a transboundary problem, international agreements have got much more significant roles to play. In many cases national legislation just gives effect to the international agreement. To a great extent the effect of international agreements depends not only on whether the countries are party to the said convention but also whether they are committed to implement the regulations.
In addition to the binding international conventions, there are some non-binding instruments also addressing the prevention of marine pollution. For the purpose of the establishment of a port reception facility it is of great importance to focus on the relevant international regulations, and thereby the obligations on State parties under those regulations.
3.2 International conventions
this field. The United Nations Conference on Human Environment (UNCHE) held in 1972 in Stockholm is possibly the first comprehensive international effort towards global environment protection. The 26 point Stockholm declaration specifically urges in point 7 to protect the marine environment:
States shall take all possible steps to prevent pollution of the seas by substances that are liable to create hazards to human health, to harm living resources and marine life, damage amenities or to interfere with other legitimate uses of the sea.
3.2.1 Regional agreements and co-operation
Regional agreements for the protection of seas from pollution are obviously applicable for a particular region only, generally among the countries bordering a particular sea or sea area. A handful of such agreements exist among the countries in Northwest Europe, especially in the Nordic area. Although all agreements are aimed to keep the seas pollution free, they address the issue differently as the sources of ocean pollution are diverse.
Besides these the European Union (EU) has issued some directives related to marine pollution control including establishment of port reception facilities. Also four North Sea Conferences, held in 1984, 1987, 1990 and 1995, took several decisions to tighten up and enhance the pollution control efforts in Northwest European waters.
Such regional activities have been initiated in other areas also under the "Regional Seas Programme" by the United Nations Environment Programme (UNEP). The programme began in 1974 and so far thirteen regions have been brought under this programme of which eight have already got legally binding conventions. Under this programme the Mediterranean Action Plan is the oldest and possibly the most matured component. The member States used this platform under the Genoa Declaration (1985) to establish waste reception facilities in the ports of the Mediterranean. A study by the United Nations University's programme revealed that although the adequacy in most of the ports was not enough, fifty ports were able to establish reception facilities.
The "South Asian Seas" region, comprising Bangladesh, India, Maldives, Pakistan, and Sri Lanka, is one of the thirteen regions under the regional seas programme, but it has not yet adopted any convention or protocol. Besides other aims and objectives, the Regional Seas Programme for South Asian Seas may as well serve the purpose of co-operation for setting up port reception facilities in this region. One important aspect of the regional agreements is that they help to enhance co-operation among countries in the region. Therefore, a regional understanding in this area for the protection of marine environment can assist to boost the pollution control efforts.
intra-regional technology transfer, training on environmental management and institutional development, management of mountain ecosystems, watersheds, and coastal resources (Global environment outlook-1, 1997). Therefore, SACEP can also be a good base for creating a harmonised system of port reception facilities in the region to protect the marine environment from pollution caused by shipping activities.
3.2.2 Global conventions and commitments
Global conventions and commitments applicable to marine pollution prevention are administered either by the United Nations (UN) itself, or by its affiliated bodies. The most significant among those is the International Maritime Organisation (IMO). The United Nations Environment Programme (UNEP) is the other principal organisation to administer such conventions and commitments. Important global conventions and action plans on the prevention of marine pollution applicable for this study are shown in Table 3.1.
Table 3.1 Global Agreements/Action Plan on environment protection and marine pollution prevention applicable for the present study
• The London Convention: Convention on the Prevention of Marine Pollution by dumping of Wastes and Other Matter, 1972, as amended
• The MARPOL Convention 73/78: International Convention for the Prevention of Pollution from Ships, 1973, as modified by the Protocol of 1978, as
amended
• The Law of the Sea Convention (LOSC) 1982
• Agenda 21 (1992)
3.2.2.1 The London Dumping Convention
since the convention deals with the regulation of waste dumping at sea, it is important to note for the purpose of treated waste disposal to sea from the reception facilities. The Convention entered into force in August 1975.
3.2.2.2 The MARPOL Convention
The MARPOL 73/78 Convention, or the International Convention for the Prevention of Pollution from ships, 1973, as modified by the protocol of 1978, has replaced the former convention called the International Convention for the Prevention of Pollution of the Sea by Oil, 1954 (OILPOL 54). The MARPOL 73/78 is the most significant and directly applicable convention for the prevention of operational pollution from ships. At the time the OILPOL convention was adopted, oil was considered as the only pollutant. The MARPOL 73/78 convention took a wider view and addressed five different kinds of marine pollutants and adopted separate provisions for each category, which were annexed to the main convention. A new protocol was adopted in September 1997 in an international conference of parties to the MARPOL 73/78 Convention to amend the Convention. The protocol is on prevention of air pollution from ships and is annexed to the Convention as Annex VI.
not harm the environment. The annexes and types of wastes with date of enforcement are mentioned in Table 3.2.
Table 3.2: The annexes of the MARPOL 73/78 Convention
Annex Type of Waste Global Enforcement Remarks
I Oil 2nd October 1983
II Liquid chemicals in bulk 6th April 1987
112 Contracting States till 31 July 2000, with 94.23 % of world tonnage
III Harmful substances in packaged form
1st July 1992 94 Contracting States till 31 July 2000, with 79.39 % of world tonnage
IV Sewage Not in force yet 78 Contracting
States till 31 July 2000, with 43.44 % of world tonnage. Enforced in the Baltic area
V Garbage and solid wastes 31st December 1988 98 Contracting States till 31 July 2000, with 85.98 % of world tonnage
VI Air pollution Not in force yet Only 2 Contracting States till 31 July 2000, with 4.86 % of world tonnage. Adopted on 26th September 1997
Source: International Maritime Organisation (2000)
All State parties to the MARPOL 73/78 Convention are obliged to set up adequate port reception facilities for Annexes I, II, IV, and V. Details of these annexes will be discussed in chapter 4.
3.2.2.3 The Law of the Sea Convention III, 1982
convention, entered into force on 14th November 1994, which obliges the State parties of this convention by art. 194(1) and art. 211(1) to take all necessary measures in order to prevent, reduce and control pollution of the marine environment from any source including ships. It insists on States in art. 237(2) to implement specific tasks imposed by other international conventions adopted with respect to prevention, reduction, and control of marine pollution. Thus the convention puts an implied responsibility on State parties to establish adequate reception facilities in their ports.
3.2.2.4 Agenda 21
Agenda 21 is a comprehensive action plan adopted by more than 178 governments in the United Nations Conference on Environment and Development (UNCED) or the Earth Summit held in Rio de Janeiro in June 1992. chapter 17 of section II of this action plan focuses on protection of oceans, seas and coastal areas. Part B of this chapter is dedicated to marine environment protection where it reiterates the obligation of the State parties to resist degradation of the marine environment by "wider ratification and implementation of relevant shipping conventions and protocols."
3.2.3 National Legislation
In the wake of global environmental awareness specially in the last two/three decades the countries of the area of study, namely Bangladesh, India, Maldives, Pakistan, and Sri Lanka, have more or less developed some sort of national legislation and regulations concerning environment protection and pollution control in general. But these are quite incomprehensive, particularly when it comes to the point of marine pollution. Specifically for port reception facilities it is hard to find any regulatory framework in any of these countries.
other UN bodies, and committed themselves to take necessary steps to implement all conventions and declarations for the protection of world environment as a whole, but in practice they fall far behind. As far as maritime regulations are concerned all these countries in the region basically inherited the same Acts and regulations on merchant shipping and ports enacted by the British government under colonial rule. Very little has been revised or replaced since then. These laws and regulations hardly mentioned anything on environment protection. However, recent development on environment consciousness has brought some changes, but yet to gain a full momentum. In the following table 3.3 the present status of relevant international conventions concerning maritime pollution control for the countries concerned are given.
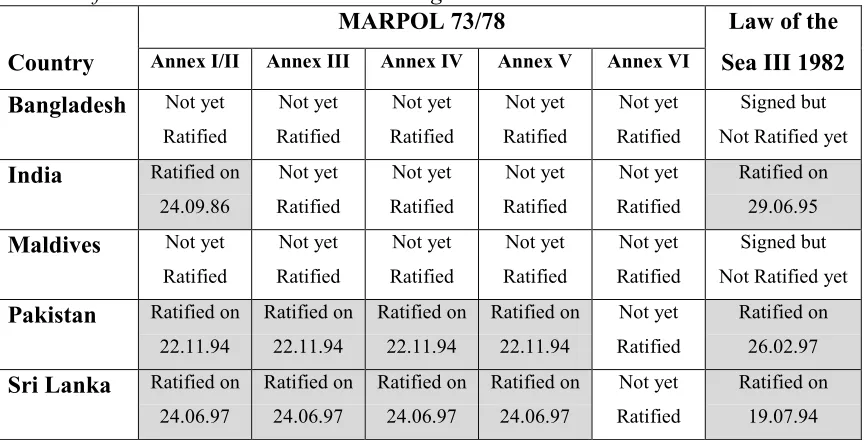
Table 3.3: Status of relevant International Conventions concerning Marine Pollution for the countries in South Asian Region
MARPOL 73/78
Country Annex I/II Annex III Annex IV Annex V Annex VI
Law of the Sea III 1982
Bangladesh Not yet
Ratified Not yet Ratified Not yet Ratified Not yet Ratified Not yet Ratified Signed but Not Ratified yet
India Ratified on
24.09.86 Not yet Ratified Not yet Ratified Not yet Ratified Not yet Ratified Ratified on 29.06.95
Maldives Not yet
Ratified Not yet Ratified Not yet Ratified Not yet Ratified Not yet Ratified Signed but Not Ratified yet
Pakistan Ratified on
22.11.94 Ratified on 22.11.94 Ratified on 22.11.94 Ratified on 22.11.94 Not yet Ratified Ratified on 26.02.97
Sri Lanka Ratified on
24.06.97 Ratified on 24.06.97 Ratified on 24.06.97 Ratified on 24.06.97 Not yet Ratified Ratified on 19.07.94
Source: International Maritime Organisation and UN Division for Ocean Affairs and the Law of the Sea, (2000)
Bangladesh: National Environment Policy was adopted in May 1992 which has set
• Maintenance of the ecological balance
• Protection against natural disasters
• Identification and regulation of activities causing pollution and environmental degradation
• Sustainable use of natural resources
• Active participation in international environmental initiatives.
Bangladesh has adopted a new act on environment in February, 1995, called the Environment preservation, development, and pollution control and prevention Act (Act 1 of 1995, 16/02/95), which gives a general guidelines for over all environment protection.
Despite the commitment in their environmental policy to uphold international environmental activities, Bangladesh has not yet ratified any of the annexes of the MARPOL 73/78 convention. However, a draft policy on oceans and marine environment protection is presently under active consideration.
India: India has approved the mandatory part, that is Annex I and II of
MARPOL 73/78, but has not yet enacted any national legislation on the basis of the MARPOL convention.
The environment (Protection) Act, 1986, was approved by the government in May 1986 in light of the Stockholm Declaration, adopted at the United Nations Conference on the Human Environment in 1972, and a set of rules called Environment (Protection) Rules, 1986, were also enacted in November of the same year.
have been adopted. Among those following notifications can be relevant for waste reception facilities:
• Hazardous Wastes (Management and Handling) Rules, 1989
• Municipal Solid Wastes (Management and Handling) Rules, 1999.
However, wastes from ships beyond five nautical miles of the coast are excluded under the Hazardous Wastes (Management and Handling) Rules of 1989. Ships' wastes are covered by the Merchant Shipping Act, 1958, and rules made thereunder. No specific rules have been made yet for handling of ships' wastes and for port reception facilities.
Maldives: Maldives has also not ratified any part of the MARPOL 73/78
Convention. They have also not enacted any national policy on environment protection as yet. Possibly they are the least developed in the region so far on legislative issues. However, the Ministry of Environment has been authorised to enact any law concerning environment protection.
Pakistan: Pakistan has ratified all five annexes of the MARPOL 73/78
Convention, except annex VI, which was supplemented to the MARPOL Convention in July 1998 only. Pakistan is also the lone country so far from South Asia to ratify the London Dumping Convention (ratified on 9th March 1995).
Sri Lanka: Probably Sri Lanka is the leading nation in this region to formulate environmental legislation, especially on marine environment protection. Their parliament have passed the Marine Pollution Prevention Act, No. 59 of 1981, before they have ratified the MARPOL 73/78 convention. However, under the authority given to the concerned minister under this Act to ratify different international conventions on marine pollution, Sri Lanka became the first country to ratify all five annexes of the MARPOL 73/78 convention, except annex VI. Also Sri Lanka is the only country to have a special Act on marine pollution prevention.
4.
Studies on Quantity and type of Shipboard Wastes
For the purpose of establishment of reception facilities in ports a comprehensive study on quantities and type of wastes generated on board different types of vessels is very recommended to derive what type of facilities are required to be established in any particular port.
4.1 Annexes of MARPOL 73/78
The annexes of MARPOL 73/78 contain the specific regulations pertaining to each category of ship-generated waste or marine pollutant. Originally there were five annexes and now there are six. Annex I and II are compulsory, that is any country which ratifies MARPOL 73/78 Convention must abide by the regulations in these two annexes, but they can keep their reservation for other annexes. However, other than Annex IV and the newly adopted Annex VI, all other annexes are already in force globally (table 3.2).
Annex I: Deals with pollution caused by operational discharge of oil in general.
The Annex came into force on October 2, 1983. It contains, inter alia, regulations for the control of discharge of oil-water mixtures, reception facilities for oily wastes from ships, segregation of oil and water ballast, installations for oil retention on ships, inspection and monitoring systems for oil discharges, oil logs, and various appliances for the prevention of pollution by oil.
from different types of vessels. Parties to the convention must ensure that adequate reception facilities are provided at their ports for all types of oily wastes expected to be produced onboard vessels normally calling those ports. Specific provisions for tankers are also mentioned. An 'Oil Record Book' for all kinds of operation related to oil or oily mixtures has to be kept.
Annex II: Addresses the control of pollution from noxious liquid substances
carried in bulk. Came into force on April 6, 1987. This annex contains regulations about, inter alia, discharge, inspection, tank washing, and log keeping for chemical tankers. It also contains regulations to classify the liquid substances other than oil (POL), which are transported in bulk. Regulations also specify the requirements for chemical-containing tank washing waters. This annex also requires the signatories to provide reception facilities in ports for chemical residues and tank cleaning waters. A 'Cargo Record Book' for all chemical substances to which this annex is applicable, must be maintained, which can be recorded by the authorities of any party to the convention.
Annex III: This annex covers the pollution caused by harmful substances
transported in packaged form. The Annex took force on July 1, 1992. It mentions about the issuing of packaging labels, documentation, quantity limitations, exceptions and measures for preventing or minimising the risk of pollution by harmful substances.
However, no special requirement is specified for the reception facilities for this category of wastes.
Annex IV: Concerns regulation for the prevention of pollution by sewage
This annex describes the regulations for the sewage discharge at sea and the requirement of treatment plants. The annex requires the contracting States to provide reception facilities in ports for sewage also.
Annex V: This annex prescribes the regulations for the prevention of pollution
by garbage from ships. The Annex entered into force on December 31, 1988. For the purpose of this annex, 'garbage' means all kinds of victual, domestic and operational wastes, with the exception of fresh fish and parts thereof. This garbage does not include other substances which are specifically covered by any other annex.
This annex divides the garbage materials into different items and specifies different discharge requirements for each. However, plastic is totally banned for discharge at sea.
Annex VI: Adopted on 26th September 1997 to prevent air pollution from ships.
4.2 Waste quantities on board ships
Tables used in this section to determine the quantities of different types of wastes generated on board ships are based on the studies carried out in 1993 by Det Norske Veritas Industri Norge AS, for the Norwegian Maritime Directorate (Det Norske Veritas Industri Norge AS, 1993).
The data are compiled by analysing reports, international conventions, instructions, statistics, and guidebooks (Norske Veritas Industri Norge, 1993). Wastes are grouped in the following way:
Oil and oil-containing waste
1. Solid oily waste (such as oily rags from machinery spaces)
2. Oil sludge (such as from oil separators/purifiers)
3. Waste oil (used oil or collection of drained oil)
4. Oily bilge water and ballast water (bilge from machinery space, and ballast
water carried in cargo oil tanks).
Among these wastes only group one belongs to the Annex V of the MARPOL 73/78 Convention and the rest belong to Annex I of the Convention.
Solid waste (garbage)
These are Annex V wastes mainly constitute victuals, domestic and operational wastes, excluding wastes those fall under any other specific annexes of the MARPOL 73/78 Convention.
The Technical Report of Det Norske Veritas Industri Norge AS also includes sewage and waste generated from carrying liquid harmful substances in bulk. However, since Annex IV of the MARPOL 73/78 Convention is not yet in force and also since Annex II has got very limited implication in the area of study, these two types of wastes are not covered in this section.
The tables express wastes in unit quantities. The total amount of any particular type of waste generated from ships calling a port is not always required to be delivered to reception facilities. Some of the wastes can be discharged at sea as per the MARPOL 73/78 Convention, which largely depends on the ships' trading area and type of shipboard equipment for processing of wastes.
4.2.1 Oil and oily wastes
Table 4.1 has shown solid oily wastes produced on board different types and sizes of vessels. All the wastes, in this category, are not delivered to port reception facilities. Because some of the wastes in this category are incinerated on board, it can be assumed that ships having an incinerator burn all such wastes produced onboard ships.
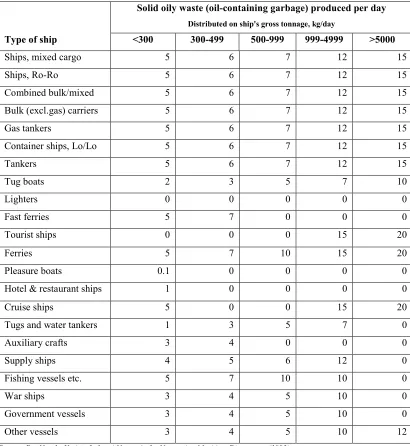
Table 4.1 Solid oily wastes produced on board different types and sizes of ships
Solid oily waste (oil-containing garbage) produced per day
Distributed on ship's gross tonnage, kg/day
Type of ship <300 300-499 500-999 999-4999 >5000
Ships, mixed cargo 5 6 7 12 15
Ships, Ro-Ro 5 6 7 12 15
Combined bulk/mixed 5 6 7 12 15
Bulk (excl.gas) carriers 5 6 7 12 15
Gas tankers 5 6 7 12 15
Container ships, Lo/Lo 5 6 7 12 15
Tankers 5 6 7 12 15
Tug boats 2 3 5 7 10
Lighters 0 0 0 0 0
Fast ferries 5 7 0 0 0
Tourist ships 0 0 0 15 20
Ferries 5 7 10 15 20
Pleasure boats 0.1 0 0 0 0
Hotel & restaurant ships 1 0 0 0 0
Cruise ships 5 0 0 15 20
Tugs and water tankers 1 3 5 7 0
Auxiliary crafts 3 4 0 0 0
Supply ships 4 5 6 12 0
Fishing vessels etc. 5 7 10 10 0
War ships 3 4 5 10 0
Government vessels 3 4 5 10 0
Other vessels 3 4 5 10 12
According to information provided to the Norwegian Maritime Directorate by Mr. Kyed of Kværner Incineration A/S (Lützen, et al, 1996), 60% of the ships in overseas traffic have incinerators. So, solid oily wastes from 40% of overseas ships are to be received at port. Only 10% of the ships engaged in coastal traffic have incinerators. All other types of ships are assumed not to posses any incinerators and hence, solid oily wastes produced onboard such vessels have to be removed at port.
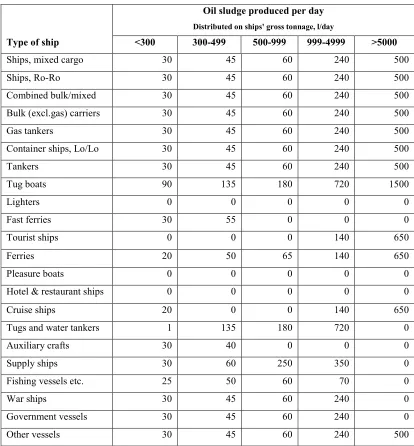
Table 4.2 Oil sludge produced onboard different types and sizes of ships
Oil sludge produced per day
Distributed on ships' gross tonnage, l/day
Type of ship <300 300-499 500-999 999-4999 >5000
Ships, mixed cargo 30 45 60 240 500
Ships, Ro-Ro 30 45 60 240 500
Combined bulk/mixed 30 45 60 240 500
Bulk (excl.gas) carriers 30 45 60 240 500
Gas tankers 30 45 60 240 500
Container ships, Lo/Lo 30 45 60 240 500
Tankers 30 45 60 240 500
Tug boats 90 135 180 720 1500
Lighters 0 0 0 0 0
Fast ferries 30 55 0 0 0
Tourist ships 0 0 0 140 650
Ferries 20 50 65 140 650
Pleasure boats 0 0 0 0 0
Hotel & restaurant ships 0 0 0 0 0
Cruise ships 20 0 0 140 650
Tugs and water tankers 1 135 180 720 0
Auxiliary crafts 30 40 0 0 0
Supply ships 30 60 250 350 0
Fishing vessels etc. 25 50 60 70 0
War ships 30 45 60 240 0
Government vessels 30 45 60 240 0
Other vessels 30 45 60 240 500
In table 4.2 the quantities of oil sludge produced on board different types and sizes of vessels are shown. Oil sludge is not allowed to be discharged at sea at all, but can be incinerated on board. The availability of equipment (incinerator) onboard different types of ships is same as mentioned earlier. Therefore, 40 % of overseas traffic vessels and 90 % of coastal traffic vessels will deliver the oil sludge produced onboard to the shore reception facilities.
Table 4.3 Waste oil produced onboard different types and sizes of ships
Waste oil produced per day
Distributed on ship's gross tonnage, l/day
Type of ship <300 300-499 500-999 999-4999 >5000
Ships, mixed cargo 25 30 50 75 80
Ships, Ro-Ro 25 30 50 75 80
Combined bulk/mixed 25 30 50 75 80
Bulk (excl.gas) carriers 25 30 50 75 80
Gas tankers 25 30 50 75 80
Container ships, Lo/Lo 25 30 50 75 80
Tankers 25 30 50 75 80
Tug boats 20 25 35 60 65
Lighters 0 0 0 0 0
Fast ferries 30 40 0 0 0
Tourist ships 0 0 0 75 100
Ferries 30 40 55 75 100
Pleasure boats 0.1 0 0 0 0
Hotel & restaurant ships 5 0 0 0 0
Cruise ships 30 0 0 75 100
Tugs and water tankers 3 25 35 60 0
Auxiliary crafts 15 25 0 0 0
Supply ships 5 10 15 20 0
Fishing vessels etc. 25 30 50 75 0
War ships 25 30 50 75 0
Government vessels 25 30 50 75 0
Other vessels 25 30 50 75 80
In table 4.3 the quantities of waste oil generated onboard different types and sizes of vessels are given. Also this category of waste can not be discharged at sea all together and hence it is either incinerated onboard when the equipment is fitted or disposed to shore facilities as in the case for solid oily wastes and oil sludge.
Table 4.4 Oily bilge water produced onboard different types and sizes of ships
Oily bilge water produced per day
Distributed on ship's gross tonnage, l/day
Type of ship <300 300-499 500-999 999-4999 >5000
Ships, mixed cargo 80 125 150 500 1200
Ships, Ro-Ro 80 125 150 500 1200
Combined bulk/mixed 80 125 150 500 1200
Bulk (excl.gas) carriers 80 125 150 500 1200
Gas tankers 80 125 150 500 1200
Container ships, Lo/Lo 80 125 150 500 1200
Tankers 80 125 150 500 1200
Tug boats 80 125 150 500 1200
Lighters 0 0 0 0 0
Fast ferries 60 120 0 0 0
Tourist ships 0 0 0 300 400
Ferries 60 130 160 300 400
Pleasure boats 5 0 0 0 0
Hotel & restaurant ships 5 0 0 0 0
Cruise ships 60 0 0 300 400
Tugs and water tankers 10 125 150 500 0
Auxiliary crafts 70 100 0 0 0
Supply ships 50 90 150 500 0
Fishing vessels etc. 70 70 70 75 0
War ships 80 125 150 500 0
Government vessels 80 125 150 500 0
Other vessels 80 125 150 500 1200
In table 4.4 the amounts of oily bilge water produced are mentioned according to the types and sizes of ships. Oil from oily bilge is separated by oil filtering equipment installed onboard as per the MARPOL 73/78 Convention Annex I regulation 16 and the watery effluent is discharged overboard in specified areas other than special areas provided the oil content in the effluent is measured to be less than 15 ppm. The oily portion is to be delivered ashore if not incinerated onboard. The same assumption on incineration as mentioned earlier is also applicable here.
Oily ballast water is normally produced onboard tankers without segregated ballast
tanks, that is cargo oil tanks are used as ballast tanks when the vessel is empty.
Segregated ballast is the ballast water carried in tanks permanently allocated for this purpose and completely separated from the cargo oil and oil fuel system. As per the MARPOL 73/78 Convention regulation 13(1) crude oil tankers of 20,000 dwt and above and product carriers of 30,000 dwt and above built after 31 December 1975 or delivered after 31 December 1979, should have segregated ballast tanks. Therefore, in due course of time as the existing tankers without segregated ballast tanks cease to operate the amount of oily ballast water to be delivered at port will decline.
However, provision of dedicated clean ballast tanks as per regulations 13(9) and (10)
and 14, for tankers built or delivered before the dates mentioned above, is provided in the MARPOL 73/78 Convention which helps to reduce the amount of oily ballast
water produced onboard such vessels. Clean ballast is the ballast water carried in
tanks which were previously used for carriage of oil and now so cleaned that no trace of oil is visible when the ballast is pumped out or the oil content is less than 15 ppm when an oil monitoring device is fitted.
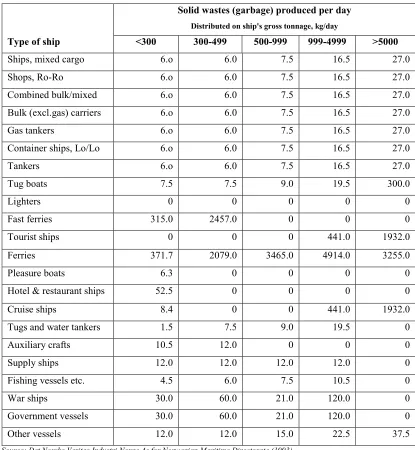
4.2.2 Solid wastes (garbage)
Table 4.5 Solid wastes (garbage) produced onboard different types and sizes of ships
Solid wastes (garbage) produced per day
Distributed on ship's gross tonnage, kg/day
Type of ship <300 300-499 500-999 999-4999 >5000
Ships, mixed cargo 6.o 6.0 7.5 16.5 27.0
Shops, Ro-Ro 6.o 6.0 7.5 16.5 27.0
Combined bulk/mixed 6.o 6.0 7.5 16.5 27.0
Bulk (excl.gas) carriers 6.o 6.0 7.5 16.5 27.0
Gas tankers 6.o 6.0 7.5 16.5 27.0
Container ships, Lo/Lo 6.o 6.0 7.5 16.5 27.0
Tankers 6.o 6.0 7.5 16.5 27.0
Tug boats 7.5 7.5 9.0 19.5 300.0
Lighters 0 0 0 0 0
Fast ferries 315.0 2457.0 0 0 0
Tourist ships 0 0 0 441.0 1932.0
Ferries 371.7 2079.0 3465.0 4914.0 3255.0
Pleasure boats 6.3 0 0 0 0
Hotel & restaurant ships 52.5 0 0 0 0
Cruise ships 8.4 0 0 441.0 1932.0
Tugs and water tankers 1.5 7.5 9.0 19.5 0
Auxiliary crafts 10.5 12.0 0 0 0
Supply ships 12.0 12.0 12.0 12.0 0
Fishing vessels etc. 4.5 6.0 7.5 10.5 0
War ships 30.0 60.0 21.0 120.0 0
Government vessels 30.0 60.0 21.0 120.0 0
Other vessels 12.0 12.0 15.0 22.5 37.5
Source: Det Norske Veritas Industri Norge As for Norwegian Maritime Directorate (1993).
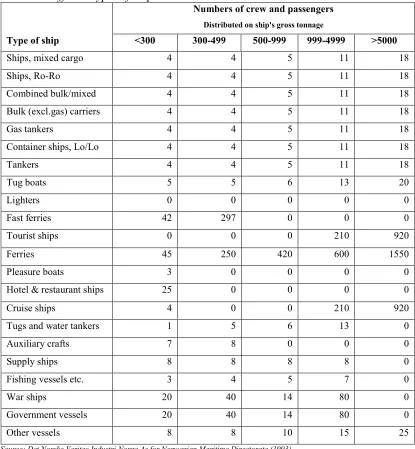
and onboard passenger ships almost double the amount of waste is produced per person per day. However, in the study carried out for the Norwegian Maritime Directorate each passenger is considered to produce 2.1 kg of waste per person per day, which is based on two different references from Kvaerner Incineration, 1993, and ORCA, 1993.
Table 4.6 Numbers of crew and passengers distributed on gross register tonnage for different types of ships
Numbers of crew and passengers
Distributed on ship's gross tonnage
Type of ship <300 300-499 500-999 999-4999 >5000
Ships, mixed cargo 4 4 5 11 18
Ships, Ro-Ro 4 4 5 11 18
Combined bulk/mixed 4 4 5 11 18
Bulk (excl.gas) carriers 4 4 5 11 18
Gas tankers 4 4 5 11 18
Container ships, Lo/Lo 4 4 5 11 18
Tankers 4 4 5 11 18
Tug boats 5 5 6 13 20
Lighters 0 0 0 0 0
Fast ferries 42 297 0 0 0
Tourist ships 0 0 0 210 920
Ferries 45 250 420 600 1550
Pleasure boats 3 0 0 0 0
Hotel & restaurant ships 25 0 0 0 0
Cruise ships 4 0 0 210 920
Tugs and water tankers 1 5 6 13 0
Auxiliary crafts 7 8 0 0 0
Supply ships 8 8 8 8 0
Fishing vessels etc. 3 4 5 7 0
War ships 20 40 14 80 0
Government vessels 20 40 14 80 0
Other vessels 8 8 10 15 25
Some of the solid wastes produced onboard ships can be disposed of at sea legally in accordance with Annex V regulation 3. However, in regulation 3(1) all sorts of plastics are prohibited totally from disposal into the sea. According to the ORCA (1993) report almost 20 % of solid waste is plastic. So, this must be disposed of at a port reception facility.
5.
The Region: South Asia
5.1 General
According to the World Bank's geographical division the South Asia Region consists of Afghanistan, Bangladesh, Bhutan, India, Maldives, Nepal, Pakistan, and Sri Lanka. Among these countries Afghanistan, Bhutan, and Nepal are landlocked and hence do not have any seaport. The remaining have their own seaports as well as a number of small coastal and fishing ports. The sea borne trade for this region including the landlocked countries is carried out through these ports.
Despite a low economic profile in comparison to the world economy, these countries have a fast growing prospect in which oceans and ocean transport and their environmental issues have got an immense importance.
5.2 Population and general economic condition
Total population in this region is about 1.3 billion, which is more than one fifth of total world population. But unfortunately 40 % of people are living below the international poverty line (World Bank Report, 1999), which has made the situation vulnerable to protect environmental degradation in the region.
overall economy in the region is growing with steady pace. According to the World Bank report, for the second consecutive year the South Asia has ranked as the fastest growing developing region in 1999 with an average gross domestic production GDP of 5.4. With opening of national economies and lifting of trade barriers the sea borne trade will expand largely which will in turn increase the number of ship calls in the ports of the region.
Though the region has great potential to grow, but the existing situation is a great impediment to correct the environmental problems. An average GNP per capita of USD 430 in the region is in sharp contrast to the average GNP per capita in the countries under the Helsinki Commission (HELCOM) which has so far successfully administered the Baltic Sea environment protection programme.
In table 5.1 some of the key economic parameters for South Asia are showing the present situation and the trend of progress.
Table 5.1 Key economic factors for countries in South Asia.
1990 1997 1998
GDP (million USD) 410,341 553,211 565,131
GDP growth (annual %) 5.6 4.6 5.6
Exports of goods & services (% GDP) 9.0 12.4 12.7
Imports of goods & services (% GDP) 12.9 16.7 16.0
Gross domestic investment (% of GDP) 23.3 22.5 22.7
Foreign direct investment (million USD) 464 4,908 3,659
Trade as share of PPP GDP (%) 4.5 5.1 4.8
Source: World Bank (2000).
5.3 Shipping in South Asia
close market, expansion in this sector was slow. Presently the situation has changed and the cargo flow in and out of this region is increasing. With a shift in general cargo trade from conventional break bulk mode to container, the trading pattern of shipping in South Asia has also changed considerably. However, the trade-pattern of liquid and dry bulk cargoes remained the same.
The change to containerisation has shifted the region into a transhipment market with main hub ports in Colombo as well as Singapore in South East Asia and UAE/Oman in Middle East. Although most of the manufactured goods are imported from Europe and North America for this region, direct dedicated services for container vessels is almost absent in all ports except Colombo which is used by many mainline operators as the hub port for this region. Singapore plays as the other main hub port especially for the eastern ports Chennai (Madras), Calcutta, and Chittagong. Dubai served as the other main hub port for the western ports Karachi, Bombay, and Jawharlal Nehru, but in the recent years Khorfakkan, Fujairah, and Salalah has been included in the list of hub ports for west coast of the subcontinent.
Import of crude oil products is mainly from the gulf, while the petroleum products are imported from Southeast Asian region also. Dry bulk cargoes are imported mainly from Australia, USA, and South America.
5.4 Ports in South Asia
5.4.1 Bangladesh
Bangladesh has got two sea ports, Chittagong and Mongla, along its 580 km coastline with about 1400 and 300/350 annual ship calls (ocean going) respectively. Besides that there are a number of small ports along the coast for cabottage and fishing vessels. Also Chittagong and Mongla receive numerous coastal vessels all round the year. A calculation on the expected amount of wastes to be received at Chittagong port from overseas traffic is shown in the next chapter.
Table 5.2 Port statistics for Chittagong port in Bangladesh
Fiscal Year Ship calls per year Cargo Handled Imports in tons
Cargo Handled Exports in tons
1994-95 1360 8,924,514 1,354,360
1995-96 1409 8,851,328 1,449,681
1996-97 1482 9,117,259 1,436,990
1997-98 1389 9,559,699 1,526,731
1998-99 1425 12,205,906 1,697,362
Source: Chittagong port information brochure, 1999
5.4.2 India
India is the leading economy in the South Asian region with over 165 million tonnes of overseas cargo imports by sea and about 60 million tonnes of exports by sea during the fiscal year 1996-97 (Govt. of India report, 1999). India has got twelve (with Calcutta and Haldia as separate ports) major ports and 181 minor/intermediate ports along its 7000 km coastline. Table 5.3 shows distribution of major and minor ports in India.