A NOVEL IMPROVED GRADIENT NOISE TOLERANT
METHOD FOR ENHANCED EDGE DETECTION
1N. ANANDAKRISHNAN 2LT. DR. S. SANTHOSH BABOO 1
Assiatant Professor, Department of Computer Science, 1
Providence College for Women, Coonoor 643104 - Tamil Nadu 2
PG& Research Dept. of Computer Applications, D.G. Vaishnav College, Chennai - 600106 - Tamil Nadu Email: [email protected]:2 [email protected]
ABSTRACT
Edge Detection is the process of identifying the sharp changes that occur in the brightness of an image. In order to study the objects in an image it is necessary that the Edges are clear and predictable which is not the case in real time images. Identifying Edges becomes a tedious process when real time images are considered. An Improved Gradient Noise Tolerant (IGNT) method involves the processes of observing the fine details of the image by omitting the irrelevant data including the noisy data and detecting the edges of the objects and features in the image using Preprocessing, Thresholding, Binarization and Feature Extraction, which are experimented, analyzed and the results obtained are discussed in this paper.
Keywords: Otsu’s method, Edge Detection, threshold, features, object, LoG, Canny, pyramid. 1. INTRODUCTION
Edge Detection, is a mathematical method which aims to identify points in digital images, initiating the study at which the image brightness changes sharply or, more formally the points at which the image is having discontinuities. The points in an image predicting the brightness changes are typically classified to form a set of curved line segments termed edges. [4]
In the case of an ideal process, applying an edge detector to an image may lead to a set of connected curves indicating boundaries of objects and surface marking. The result may also correspond to discontinuities in orientation [14]. Thus, the results produced by the Edge Detection algorithm are often a reduced set of data or the filtered data, which omits out information such as the irrelevant data, preserving the properties of the image. Once the results of Edge Detection have successfully been organized, the subsequent tasks of interpreting the information contents in the original image maybe substantially simplified. However, the process is not always as simple as that specified, especially for the real time images [16]. Edges extracted from non-trivial images contain edge curves which are not connected, or missing edges. It may also contain false edges not corresponding to interesting phenomena in the image, thus complicating the very task of interpreting the image data.
The concept of image processing involves several forms like segmenting the image, cropping, enhancing the image, de-noising, de-blurring the image and detecting edges. Each of these processes is used for the detection of Edges by reducing the data processed. In the same way, edge detection is also used for locating some required information, objects in the images, predicting their size and shape, gathering the important events in the image, segmenting some layers, identifying spots in medical images, etc,.
Edge detection is a process of tracing the information of images like shapes, texture and significant features. It is one of the basic processes for several image processing techniques in computer vision. It identifies the variations in image intensities, image brightness and image contrast [9]. The process of edge detection is traditionally done by several algorithms namely, Canny, Sobel, Prewitt, Laplacian, Robert, morphological edge detection etc [13] [10].
image, brain tumor detection, vehicle distance tracking, vehicle number plate tracking, remote sensing images, etc.
The ability to identify each individual object uniquely is a requirement, for applying it in different area. In order to identify the objects and classify them, it is required that the edges in the image be studied. The study basically is coverage of the Edge Detection methods for the detection of fine details and removal of irregularities obtained by the analyses of edges.
IGNT method automatically performs clustering based image Thresholding by extracting the features of the images. Pre-processing, Thresholding, binarization and feature extraction are the major steps involved in the method. Laplacian Image Pyramid is used for repeated smoothing and noise removal. Otsu’s algorithm is used for the process of Thresholding. In feature Extraction the Canny Edge Detection technique is implemented. A classification of the pixels into classes and calculation of optimum threshold by separating the classes is performed, representing a minimal combined spread.
2. LITERATURE REVIEW
Evaluating the Edge detection techniques used in the concept of image processing has given rise to a number of popular Edge Detection techniques. All the techniques have encountered the best possible results [16].
Detecting the Edges by calculating the gradient magnitude [8] and predicting the orientation with the help of convolution masks is seen in the traditional methods. They are typically based on the convolution kernel [17]. The differences seen in the Classical methods are basically based on the creation of the kernel. The gradient and the angular magnitude are extracted for detection [14]. By increasing or adding constant vector values to the kernel, smoothing of Edges is obtained.
Although simplicity was an achievement, the inaccurate results obtained due to noise were of concern. Edge Detection techniques are still in the development phase due to the presence of noise. Convolving the Gaussian filter using Laplacian [1] is another technique. Standard derivatives are obtained and the pixels with zero crossing are considered [11].
In order to detect the presence of curves advanced techniques involving an Image pyramid is used. Repeated smoothing and sub-sampling by low pass filters and detection of differences in adjacent levels by high pass filters is seen in the pyramid.
Increased error rate and decreased Edge Detection lead to a state with error rate that is inversely proportional to the signals. A non-maximal suppression technique with hysteresis Thresholding inculcated the process of removing errors. Optimal Edge Detection methods contributed a large amount towards the reduction of errors.
Detecting the Edges in an image using the traditional and the optimal method began to be considered as just a specific part as the applications of Edge Detection increased.
The use of Edge Detection with Fuzzy Logic considering the fuzzification function and the adaptive threshold, its use with Genetic and Neural Networks considering the chromosome population in the later and the neuron propagation in Neural Networks has established a constant look through capability in Soft Computing [3].
Apart from the above mentioned Edge Detection techniques there are others that are formed as a combination of methods [12]. To bring about a change and to examine improvement in the performance of the techniques, a transition from the linear to the Non-Linear methods based on the diffusion coefficient was made [15].
Color based detection and the segmentation of an image based on the contrast and texture of the image gained importance as color and lines gained its importance in differentiating the object in an image. A calculation of the wavelet transform was used. Apart from algorithms that exploit the Thresholding, algorithms were also developed to detect Edges based on the concept of local signals. An adaptive technique using an adaptive Thresholding was also developed. The norm today is of performing Edge Detection automatically using automatic algorithms to calculate the threshold and detect Edges [5].
process of Thresholding is completed, the Edge Detector is applied to the image. The detector recognizes the features predicting the fine details of the image or object using the procedure shown in
Figure 1 [13].
Non-Maximal Suppression is used as an intermediate step in many of the computer vision algorithms. It is often used along with Edge Detection algorithm. It is a process in which zero is set to all the pixel values that are not actually placed on the ridge top so as to produce thin lines in the output. Canny Edge Detector is determined by three parameters, they are,
1) Gaussian kernel 2) Upper threshold 3) Lower threshold
In summary the algorithm first converts the image into a grayscale image using luminance conversion. Followed by, the use of filters to reduce the noise. The gradient and the angular magnitude of the image are calculated.
In order to separate the pixels with higher magnitude and gradient value non-maximal compression is performed. Finally to avoid the reduction of valid edges hysteresis Thresholding is applied. In order to avoid the presence of noise in the image the upper threshold is kept as low as possible. Thus, we reach the resulting product with reduced noise and an intimate feature extraction using Edge Detectors.
3. IGNT METHOD
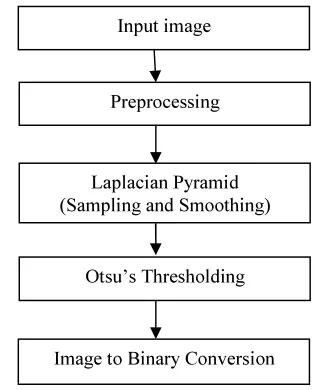
The IGNT Edge Detection method is the proposed method for edge detection in an image, which involves four steps considerably.
i) Preprocessing ii) Thresholding iii) Binarization
iv) Feature Extraction, as shown in
Figure2.
The first step i.e Preprocessing stage is used for the elimination of redundant data and Discontinuity Removal with the employment of smoothing and sampling.
The second step is used to calculate the threshold limit which is done by means of Otsu’s algorithm. Then the third step is to obtain the Binarized image with the help of Thresholding stage. Finally, the directional characteristics of the Binary image are extracted to provide a noise free edge detected image.
3.1 PREPROCESSING
An image is an artifact that shows the visual perception. Images may be of two dimension or more and may be captured by any device, at any circumstance. This image, given as an input is raw data consisting of redundant data, unclear features and discontinuities.
The image considered may also contain improper background and embedded shapes, thus Figure 1. Extraction using Canny Edge Detector
Figure 2. Feature Extraction using Proposed Method Input image
Smoothing Operation
Non-maximal Suppression Gradient Calculation
Hysteresis Thresholding
Input image
Preprocessing
Otsu’s Thresholding Laplacian Pyramid (Sampling and Smoothing)
denying the exact detection of the features in the image. The processes of overcoming redundancy and discontinuity is inculcated in preprocessing, thus making it a necessity. IGNT process begins with preprocessing, which involves Laplacian Pyramidal Transformations. An Image Pyramid is a multi-scale signal representation in which the signal or an image is subjected to repeated smoothing and sub-sampling. They are mainly used for computing the image features from an image [18].
Image pyramid is used in computer vision, image processing and signal processing applications. It is useful in representing scale-space and in multi-resolution analysis [20]. Laplacian image pyramids based on the bilateral filter provides a good structural framework for image enhancement and manipulation.
Image pyramids can be classified into two as
• Low pass pyramid and • Band pass pyramid
Low pass pyramid:
In the low pass filter the process of smoothing the image using the appropriate smoothing filter is seen. This is followed by the process of sub-sampling.The process is repeatedly applied until a well smoothed smaller image is obtained. As a result of processing an image with gradual increase in smoothing is obtained. In addition the spatial sampling density decreases level by level in the image. The image finally obtained viewed as a graphical representation looks similar to a pyramid from which the name “Image pyramid” is obtained.
Band pass pyramid
Band pass filter involves the filtering of the differences between the adjacent levels in the pyramid including some interpolation performed between representations at the adjacent level of resolution for enabling pixel wise difference computation.
Image pyramid thus is a collection of images in which the size can be reduced or expanded. Here the Laplacian pyramid is used. Gaussian filtering and Laplacian transform are the basic concepts of the Laplacian pyramid. The pyramid is used to reconstruct the unsampled image from the original image thus producing smoothed and sampled images. [19].
LAPLACIAN PYRAMID
The Laplacian pyramid is a representation of a hierarchy of images formed by the decomposition of the original image [11]. In the hierarchy obtained each level is a correspondent to different bands of image frequencies. The difference between levels in the Gaussian pyramid helps in the formation of this hierarchy. For an image I the laplacian pyramid L(I) is calculated using:
L (I) = G (I)-EXPAND (G (I +1))
These representations involves the following
• Reduction of noise • Textural analysis • Object recognition and, • Image feature labeling.
Implementation of Laplacian pyramid involves the methods of reduction and expansion. Reduction is a process as the name predicts, reduces the size of an image as required. Example a 9x9 block is reduced to a 3x3 block. In contradiction Expansion is a process of maximizing the size of the image as required. For example a 3x3 block is expanded to form a 9x9 block.
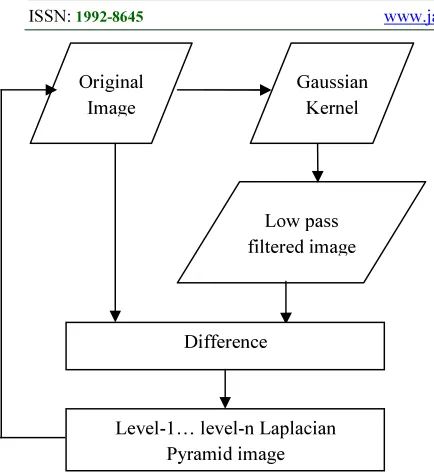
LAPLACIAN PYRAMID REDUCTION: Image Pyramid being an obvious technique for sampling an image, Laplacian pyramid is an essential tool in the field of image processing. Consider the original image, which is convolved using Gaussian kernel. A low pass filtered image is obtained from the low pass filter and the difference between the original image and the low pass filtered image is observed. The difference of the images produces the Laplacian pyramid level-1 image.
Level-1 image is further subjected to the Gaussian kernel thus producing a new low pass filtered image. The difference between the low pass filtered image and level-1 image results in level-2 Laplacian image as shown in Figure 3.
Laplacian pyramid uses the concept of a laplacian transform instead of the Gaussian filtering technique. The image is convolved using a Gaussian kernel which is the low pass filtered
The difference between the original image and the low pass filtered image is considered as the laplacian. Continuing the process, results in a set, representing the band pass version of the image. Thus the laplacian is the set of resulting band pass filters. In this method, the images are sampled and further sub-sampled forming a decomposition of the original image into a hierarchy of images. The size of the pyramid may be increased or decreased in order to obtain sampled data that is used for matching the query image with the image in the database.
LAPLACIAN PYRAMID EXPANISION The pyramid forms a combination of a number of levels of images. Each level in the Laplacian pyramid obtained corresponds to a reduced format of the previous level. The result obtained as the final output of the Laplacian pyramid reduction is to be expanded in order to remove the unnecessary pixels from the image. Laplacian expansion process comprises the following stages.
1) Get the input image, (i.e.) the output of the Laplacian pyramid reduction.
2) In the image, each pixel is processed as a 3x3 block by assigning values for each such pixel. 3) As given, the process is repeated for each
pixel in the image due to which the size of the image is expanded as per the requirement.
The Laplacian method is performed in the presence of the Gaussian pyramid in which each level of the Gaussian increases the size of the original image. The band pass filter obtained in each level represents the difference between successive levels of the Gaussian pyramid. Thus the smoothed data is obtained from the query image for further processing.
In the absence of these methods to extract required points from the image and the matching of the query image directly with the database image may lead to mismatch resulting in a false value. In order to avoid such mismatching, the Laplacian algorithm is used to remove the presence of noise thus enabling the best possibility of extracting the features of the image. It is also applied in order to remove the unwanted data that may include the background of the image or the unknown values with the corresponding pixel values of the image during the process of expansion.
Finally the process of Preprocessing produces an image that contains continuous data formed by the combination of the discontinuous data thus resulting in an image that is free from noise, redundant data and discontinuities.
3.2 THRESHOLDING
Otsu’s method automatically thresholds by clustering or by reducing gray level image into binary image for further processing. The algorithm considers the image as containing two clusters of pixels for which the optimal threshold is calculated separately. Otsu’s method is an optimal method for Thresholding large objects from an entire background image. Otsu’s method can be extended as a method of multilevel Thresholding popularly known as the Multi-Otsu’s Method [7].
Otsu’s THRESHOLDING
In order to make the segmentation process robust the levels of Thresholding should be selected by the system automatically [21]. This automatic selection is possible only if there is enough amount of knowledge about the objects, its environment and its applications. Knowledge of the selected object includes the following:
Characteristics of the objects
• Size of the object
[image:5.595.74.291.107.344.2]• The part of the image that contains the object or the pixels forming the object and
Figure 3. Process involved in the Laplacian Pyramid Reduction.
Original Image
Gaussian Kernel
Low pass filtered image
Difference
• The knowledge of the presence of different object and the total number of objects in the image.
As the process begins, the threshold that minimizes the weighted with-class variance is first found which is similar to maximizing the variance between two classes. The process is straight away performed on the gray level histogram making it fast. Assumptions are made in the process about the histograms, statistics and object illumination they are
• Histogram (and the image) is bimodal. • There is no use of spatial coherence, nor is
there use of any other notion of the object structure.
• The process assumes to involve stationary statistics that can also be modified to be locally adaptive.
• It also assumes to have uniform illumination implicitly. The bimodal brightness behavior is seen from the object appearance.
The algorithm yielded by the method consists of the following procedure;
1) Calculate the histogram and probabilities for each intensity level of the image.
2) Set up initial parameters
as 0 0, the class probability and the class mean respectively.
3) Assign t=1 then update and Compute
(t), the minimal intra class variance.
4) Desired threshold corresponds to maximum
(t).
5) The corresponding threshold levels are calculated.
(t) – the greater max and
(t) – the greater or equal maximum.
6) Finally, the desired threshold is given by,
.
In order to perform the Otsu’s Thresholding, there is a requirement of knowledge about the selected objects, environment and their characteristic features. The method is applied to a gray level image, enhancing the speed of Thresholding. The levels for Thresholding in this method are chosen by minimizing the variance of two clusters of pixels separated by the threshold operator.
In Otsu’s method of image Thresholding, gray level images are efficiently separated into two classes producing two fairly distinct classes that exit in the image. Thresholding is applied to these distinct classes. The question of enabling a more efficient method points in the direction of choosing the best threshold value for the Binarization process.
3.3 BINARIZATION
Binarization is the process of converting the gray levels into two possible values (0’s or 1’s). This binarization is achieved by fixing the threshold limit. That optimal threshold limit is obtained by otsu’s Thresholding which is calculated in the previous stage. If the pixel value exceed threshold limit that pixel is considered as an logical 1 otherwise the pixel is to be logical 0.
3.4 FEATURE EXTRACTION
Feature extraction is one of the dimension reduction methods, in this proposed method our features are directional information of an image. In IGNT method the directional information of binarized image can be extracted by traditional canny edge detection method. During preprocessing the high frequency information of an image is boosted. So that the discontinuity of the image edges due to Gaussian noise is eliminated and perfect edge detection is produced.
Also the directional information of binarized image will have no high frequency noise, since the Otsu’s Thresholding during binarization will have less effect due to high frequency noise.
Best results are obtained by using a Canny Edge Detection algorithm with good detection that could mark the real edges of the images as much as possible, an algorithm providing maximum localization, (i.e.) the edges marked are optimal and produces a high probability of edges representing the original edges in the real image and an algorithm that marks the edges only once. They are extracted in such a way it does not lead to false Edge Detection or results with noise.
4. RESULTS AND ANALYSIS
remove any type of noise present in an image with high accuracy.
Extracting the features from an image is a time consuming process if it involves a large set of data. Thus leading to, difficulties in image matching.
The Canny Edge Detection technique overcomes these difficulties by identifying the features of the image by calculating the gradient and hysteresis threshold.
The performance of the IGNT method is evaluated with the help of simulation results using MATLAB software. From this analysis it can be seen that the IGNT method performs well as compared to the other method.
The purpose of evaluating the method computationally is established by high level technical computing and data analysis methods like MATLAB.
IGNT method is analysed using the latest version of MATLAB called MATLAB 2013. Windows, Mac OS and Linux are the operating systems used to run MATLAB and the performance is measured using the virtual cores in terms of CPU time.
Multi threading is used for multiple operations. Hyper threading in Intel cores contributes to the multi core appearance in the computers.
2 GB Ram memory and a half of the core is used in Windows Task Manager. Pentium processor helps the data to be computed without any congestion in data bus increasing the performance.
Bweuler is a Euler number of a binary image. It computes the Euler number of the binary image by considering by the patterns of concavity and convexity in a local 2x2 neighborhood.
Eul = bweuler (BW, n),
which returns the Euler number for the binary image BW. The Eul value obtained at different noise levels for different techniques is compared with the Eul value obtained for the IGNT method in Table 4.1
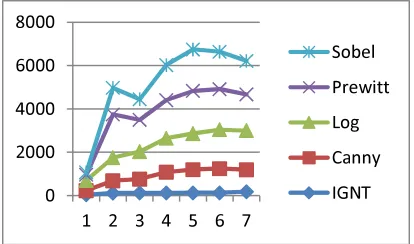
This value returned Eul is a scalar and is the total number of holes in the objects. In this bweuler method, extra objects are added when there is an increase in the noise level.
Figure 5. Represents a histogram comparing, the results produced by the IGNT method for various levels of noise, with the results produced by other Edge Detection techniques for various samples of noise. It can be seen that, there is a steady increase in the addition of objects with increase in the noise level.
0 2000 4000 6000 8000
1 2 3 4 5 6 7
Sobel
Prewitt
Log
Canny
IGNT
Eulers Binary
Noise level
Canny IGNT Log Prewitt Sobel
0.001 199 36 470 258.33 107
0.041 570 118 1063.7 1996 1222.3
0.071 643.5 120 1264 1464 950.33
0.141 959.5 122 1564 1756.7 1616
0.171 1075 128 1659.7 1965.3 1916.7
0.241 1122.5 126 1791 1868.7 1728.7
[image:7.595.316.521.157.405.2]0.271 1017.5 178 1804 1666.3 1547.3
Table 4.1. Bweuler a table calculated for the edge detection techniques.
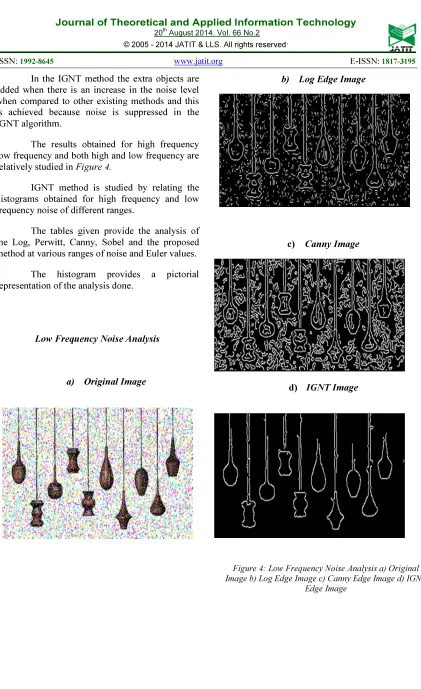
[image:7.595.305.512.579.701.2]In the IGNT method the extra objects are added when there is an increase in the noise level when compared to other existing methods and this is achieved because noise is suppressed in the IGNT algorithm.
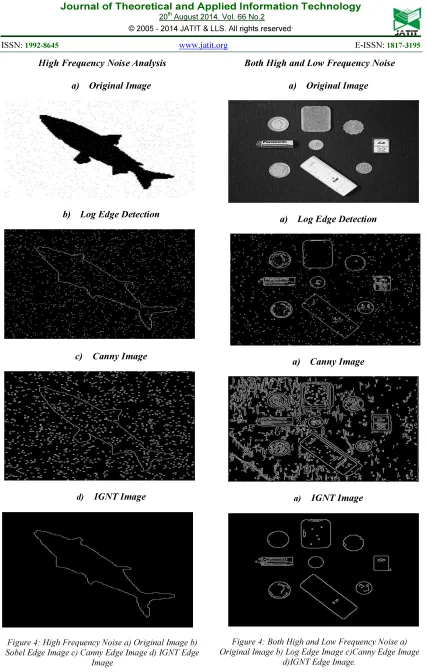
The results obtained for high frequency low frequency and both high and low frequency are relatively studied in Figure 4.
IGNT method is studied by relating the histograms obtained for high frequency and low frequency noise of different ranges.
The tables given provide the analysis of the Log, Perwitt, Canny, Sobel and the proposed method at various ranges of noise and Euler values.
The histogram provides a pictorial representation of the analysis done.
Low Frequency Noise Analysis
a) Original Image
b) Log Edge Image
c) Canny Image
d) IGNT Image
Figure 4: Low Frequency Noise Analysis a) Original Image b) Log Edge Image c) Canny Edge Image d) IGNT
[image:8.595.92.513.54.743.2]High Frequency Noise Analysis
a) Original Image
b) Log Edge Detection
c) Canny Image
d) IGNT Image
Figure 4: High Frequency Noise a) Original Image b) Sobel Edge Image c) Canny Edge Image d) IGNT Edge
Image
Both High and Low Frequency Noise
a) Original Image
a) Log Edge Detection
a) Canny Image
a) IGNT Image
[image:9.595.87.514.70.742.2]
Figure 4: Both High and Low Frequency Noise a) Original Image b) Log Edge Image c)Canny Edge Image
In Table 4.2 and Figure 6 the Euler values obtained for Sobel, Prewitt, Canny, Log Edge and the proposed method are analysed with noise level ranging from 0.1 to 0.5 and with two sigma values 0.01 and 0.41. The values obtained using the proposed method does not deviate much from the noise level, thus detecting most of the Edges at the lowest Euler Value.
Table 4.3 and Figure 7 represent the results obtained using low frequency noise at a range of about 0.01 to 0.41 Sigma values. Here to the results for the IGNT method are obtained at a lowest Euler value.
Both High and Low Frequency Noise
Sigma Noise Log Prewitt Sobel Canny IGNT
0.01
0.1 4439 4446 3091 1887 61
0.2 5203 5972 5706 2287 66
0.3 5414 4805 4425 2050 87
0.4 5419 4105 4026 1762 230
0.5 5443 4646 4718 1459 412
0.41
0.1 4284 4479 3031 1768 63
0.2 5328 5902 5785 2159 62
0.3 5515 4697 4405 1909 72
0.4 5445 4118 4090 1785 273
0.5 5307 4652 4769 1497 612
Table 4.2. A table predicting both high and low frequency noise
calculated for the edge detection techniques.
0 2000 4000 6000 8000
0.1 0.2 0.3 0.4 0.5
Eul
e
r
V
al
u
e
Noise Level Sigma-0.01
Log
Prewitt
Sobel
Canny
IGNT
0 2000 4000 6000 8000
0.1 0.2 0.3 0.4 0.5
Eu
le
r
V
al
ue
Noise Level
Sigma-0.41
Log
Prewitt
Sobel
Canny
IGNT
Figure 6.Comparison of the Edge Detection Techniques for both high
and low frequency noise at different noise levels and Sigma values
Low Frequency Noise
Sigma Log Prewitt sobel canny IGNT
0.01 1323 330 187 329 18
0.11 1327 341 193 332 15
0.21 1335 358 193 333 16
0.31 1351 381 235 340 18
0.41 1373 369 250 343 20
0 100 200 300 400 500
0.01 0.11 0.21 0.31 0.41
E
u
le
r
s
Va
lu
e
Sigma
Low Frequency Noise
Prewitt
sobel
canny
[image:10.595.92.466.180.644.2]IGNT
[image:10.595.296.523.272.537.2]Figure 7. Comparison of the Edge Detection Techniques using Euler’s Method with Low Frequency Noise Table 4.3. A Table Calculating Edges using Sigma
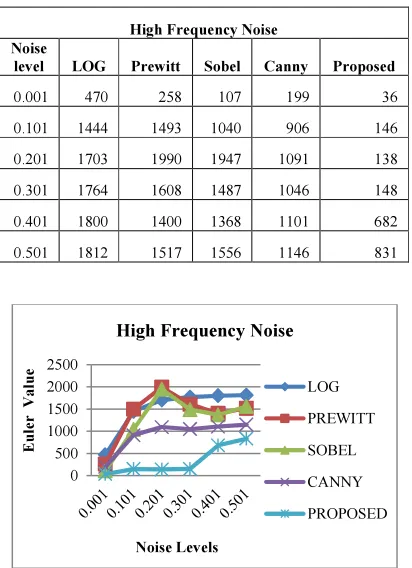
Table 4.4 and Figure 8 are presented to represent the results obtained using High frequency noise. A little deviation of the proposed method into the higher Euler values can be seen in the table and the Histogram indicating the requirement of higher Euler values for higher noise levels.
5. CONCLUSION
Detection of the Edges forms a major concept to study the objects in the image. In the IGNT method a combination of some of the popular Edge Detection techniques such as the Laplacian of Gaussian, Otsu’s method and the Canny Edge Detector is used. The advantages seen in each method contributes to the IGNT method. The limitation seen in one is overcome by the other, thus forming a well formed Edge Detection algorithm. Laplacian of Gaussian algorithm provides the reduction and expansion of the data using Image pyramids. Thus the results obtained are smoothed and sub-sampled according to the requirement. The reduction and expansion of data
and the smoothing and sub-sampling provided bring about a large increase in the signal to noise ratio.
Otsu’s method helps in the transformation of the data to be processed leading to a specific amount of required continuous data being given to the next process which is seen in the discontinuity removal. Finally, the Canny Edge Detector involving an increase in signal to noise ratio and increase in the localization of the edges using hysteresis Thresholding and non-maximal suppression contribute towards the process of feature extraction in the IGNT method.
The IGNT method can reduce the CPU time even when executed in low configuration processors whereas the existing system fails to execute fast in low configuration processors. The existing system also fails to suppress the noise when the noise level exceeds. This is because it considers the noise pixels as objects and processes. Thus failing in the attempt to, eliminate the increased noise.
But the IGNT method performs well even for increased noise levels. Thus this methodology when implemented in real time processing of images like mine ore detection, tracking vehicle number, biomedical image processing will perform efficiently when compared with the traditional methodologies of Edge Detection. Edge Detection method is a very important step for extracting the features from an image which may be used for image identification. When applying Edge Detection to an image with noise, it effectively removes the noise and detects Edge details with accuracy. It is simpler and more efficient for computating edges and also for the detection of Edges with very less consumption of time, making the process very simple to implement. The IGNT method provides good results as compared to the other Edge Detection techniques. This method can be effectively used in the area of image processing, especially for process involving large databases.
REFERENCE
[1] Sara Sharifzadeh , Ehsannadernejad, and Hamid Hassanpour, “Edge detection Techniques: Evaluations and Comparisons” Applied Mathematical Sciences, Vol.2, no. 31, 2008.
[2] Uvika and Sumeetkaur, “A Comprehensive Review On Different Edge Detection
0 500 1000 1500 2000 2500
E
u
le
r
V
a
lu
e
Noise Levels
High Frequency Noise
LOG
PREWITT
SOBEL
CANNY
PROPOSED
High Frequency Noise Noise
level LOG Prewitt Sobel Canny Proposed
0.001 470 258 107 199 36
0.101 1444 1493 1040 906 146
0.201 1703 1990 1947 1091 138
0.301 1764 1608 1487 1046 148
0.401 1800 1400 1368 1101 682
0.501 1812 1517 1556 1146 831
[image:11.595.83.289.157.441.2]Figure 8. Comparison of the Edge Detection Techniques using Euler’s Method with High Frequency Noise. Table 4.4. A Table Calculating Edges using High Frequency
Techniques” An International Journal of Engineering Sciences Vol.6, July 2012. [3] N.Senthilkumaran and R.Rajesh, “Edge
Detection Techniques for Image Segmentation-A Survey of Soft Computing Segmentation-Approaches” International Journal of Recent Trends in Engineering, Vol,.1, No.2, May 2009.
[4] Mohamed A. El-Sayed and TarekAbd-El Hafeez, “New Edge Detection Technique based on the Shannon Entropy in Gray Level Images” International Journal on Computer Science and Engineering (IJCSE) Vol.3 No.6 June 2011.
[5] FirasAjilJassim and Fawzi H. Altaani, “Hybridization of Otsu Method and Median Filter for Color Image Segmentation” International Journal of Soft Computing and Engineering (IJSCE), Volume-3 Issue-2, May 2013.
[6] Ping-Sung Liao, Tse-Sheng Chen and Pau-Choo Chug, “A Fast Algorithm for Multilevel Thresholding” Journal of Information Science and Engineering, 2001.
[7] Jun Zhang and Jinglu Hu, “Image Segmentation Based on 2D Otsu Method with Histogram Analysis” International Conference on Computer Science and Software Engineering CSSE, IEEE, 2008. [8] Christian Drewniok, “Multi-Spectral Edge
Detection” Journal of Remote Sensing, Vol.15. No.18, 1994.
[9] MamtaJuneja andParvinder Singh Asndhu, “Performance Evaluation of Edge Detection Techniques for Images in Spatial Domain” International Journal of Computer Theory and Engineering, Vol.1, No.5, December 2009. [10]PunamThakare, “A Study of Image
Segmentation and Edge Detection Techniques” International Journal on Computer Science and Engineering (IJCSE) Vol.3 No.2 Feb 2011.
[11]G.T. Shrivakshan and Dr.C.Chandrasekar, “A Comparison of various Edge Detection Techniques used in Image Processing” International Journal of Computer Science Issuses, Vol.9,No.1, September 2012.
[12]S. Lakshmi and Dr.V.Sankaranarayanan, “A study of Edge Detection Techniques for Segmentation Computing Approaches” IJCA Special Issue on Computer Aided Soft Computing techniques for Imaging and Biomedical ApplicationsCASCT, 2010.
[13]Raman Maini and Dr. HimanshuAggaarwal, “Study and Comparison of Various Image Edge Detection Techniques” International Journal of Image Processing (IJIP), Volume (3): Issue (1).
[14]Muthukrishnan.R and M.Radha, “Edge Detection Techniques for Image Segmentation” International Journal of Computer Science and Information Technology (IJCSIT) Vol 3, No 6, Dec 2011. [15]M.Kalpana, G. Kishorebabu and K.Sujatha,
“Extraction of Edge Detection using Digital Image Processing Techniques” International Journal of Computational Engineering Research Vol.2, September 2012.
[16]Saiful Islam and Majidul Ahmed, “A Study on Edge Detction Techniques for Natural Image Segmentation” International Journal of Innovative Technology and Exploring Engineering (IJITEE), Volume-2, February 2013.
[17]VineetSaini and RajinishGarg, “A Comparative Analysis on Edge Dtection Techniques” IOSR Journal of Electronics and Communication Engineering (IOSRJECE) Volume 1, May-June 2012.
[18]K.PadmaVasavi, N.Udaya Kumar, E.V.KrishnaRao and M. MadhaviLatha, “A Novel Statistical Thresholding in Edge Detection using Laplacian Pyramid and Directional Filter Banks” Proceedings of the World Congress on Engineering and Computer Science WCECS Vol , October 2010.
[19]S.M.Mukane, Y.S.Ghodake and
P.S.Khandagle, “Image Enhancement Using Fusion by Wavelet Transform and Laplacian Pyramid” IJCSI International Journal of Computer Science Issuses, No.2, July 2013. [20]N. Indumadhi and G. Padmavathi, “Enhanced
Image Fusion Algorithm Using Laplacian Pyramid and Spatial frequency Based Wavelet Algorithm” International Journal of Soft Computing and Engineering (IJSCE), Volume-1, November 2011.
[21]Deng-Yuan Huang, Ta-Wei Lin and Wu-Chih Hu, “Automatic Multilevel Thresholding Based on Two-Stage OTSU’s Method with Cluster Determination By Valley Estimation” International Journal of Innovative Computing, Information and Control, Volume