INTEGRATED FRAMEWORK OF FEATURE SELECTION
FROM MICROARRAY DATA FOR CLASSIFICATION
1AHMED A. ABDULWAHHAB, 2MAKHFUDZAH MOKHTAR (Dr.) ,3 M. IQBAL B.
SARIPAN (Assoc. Prof Dr.) , 4 MUHAMMAD HAFIZ B. ABU BAKAR (Dr.)
1
MSc. Student, Department of Computer and Communication Systems Engineering, University Putra Malaysia, Malaysia ; Ministry of Science and Technology, Iraq
2,3,4
Department of Computer and Communication Systems Engineering, University Putra Malaysia, Malaysia
E-mail: [email protected], [email protected], [email protected] ,[email protected]
ABSTRACT
A DNA microarray has the ability to record levels of huge number of genes in one experiment. Previous research has shown that this technology can be helpful in the classification of cancers and their treatments outcomes. Normally, cancer microarray data has a limited number of samples which have a tremendous amount of genes expression levels as features.To specify relevant genes participated in different kinds of cancer still represents a challenge.For the purpose of extracting useful genes information from the data of cancer microarray, gene selection algorithms were examined systematically in this study and an integrated framework of gene selection was proposed.Using feature ranking based on absolute value two sample t-test with pooled variance estimate evaluation criterion combined with sequential forward feature selection, we show that the performance of classification at least as better as published results can be obtained on the therapy outcomes regarding breast cancer patients.Also, we reveal that combined use of different feature selection and classification approaches makes it feasible to select strongly relevant genes with high confidence.
Keywords: Microarray, Gene Selection, Classification, Feature Ranking, Sequential Forward Feature
Selection, Breast Cancer, Leukemia.
1. INTRODUCTION
Due to its strong effects on the environment and public health, biology always has been among the most important and hottest areas for research. During the recent decades, tremendous amount of biological data have been collected for analysis and study. The analysis of these huge data necessitate the cooperation among mathematicians, statisticians, Chemists, information engineers, medics, and biologists. Due to their encouraging efforts, this collaboration has launched new multidisciplinary fields that are growing by fast leap5. One of the promising fields where biology comes together with information technology is bioinformatics. Even though it is a new discipline, bioinformatics covers a broad range of research
fed to the computer through microarray scanning via high resolution scanners6. The images for the scanned microarray represent unprocessed raw data that are not ready to be analyzed with actual machine learning. At this point, a preprocessing step should be taken to convert the set of raw images into the standard shape of microarray data7,8. The extent of this study does not cover preprocessing data as the microarray data are given in its pre-processed standard shape.
Sample-feature matrix, as known in machine learning, is the machine learning standard shape of the microarray data form. This matrix is an
matrix, where represents rows of
different features and represents columns of different samples. As gene levels represent feature values, the term "sample-gene matrix" is used in a particular case of microarray5. As a well-known fact in machine learning, specimens should be more than features, often much more than features in many cases. In microarrays, the situation is different as samples are much less than genes(or features) with the rank of 1:100 ratios. The curse of dimensionality is a known problem. In order to overcome this problem, the process of gene selection should be done by selecting a subset of the most useful genes from the whole gene set5,9,10. The process of gene selection takes many forms and it is performed by multi methods. The process of gene selection ends up with a subgroup of genes that is the most distinguishable between specimens from different classes6,11. In the case of building supervised classifiers, these genes are considered as the features that are used in this process. These classifiers are tested and trained by using the obtainable samples, then they are considered general as they can really classify any hidden sample into its correct category.
To systematize the analysis of microarrays, a generally accepted form of the microarray's data construction was developed5. The construction of data is an 2-Dimentional matrix of gene expression of genes for samples. This definition is transposed in some literature, in other words, 16. Normally, this data form is referred to as :
⋯
⋮ ⋱ ⋮
⋯
=
, … . . , , … . . ,
(Eq.1)
The mathematical definition of the microarray is exhibited in (Eq.1). The expression of
indicates the value of the gene for the sample
.
Frequently, this set of data is related to the vector of the group's label which gives each vector the sample's gene expression of in order to group the label . In general, the labels are individual numeric values which indicate different groups. For instance, if a part of the sample belongs to cancer tumors and the rest to normal tumors, then can be either 1 or 0, indicating a cancer sample or a normal sample respectively12,13. The mathematical mapping of to is shown in (Eq.2) :
, … . . →
, … … (Eq.2)
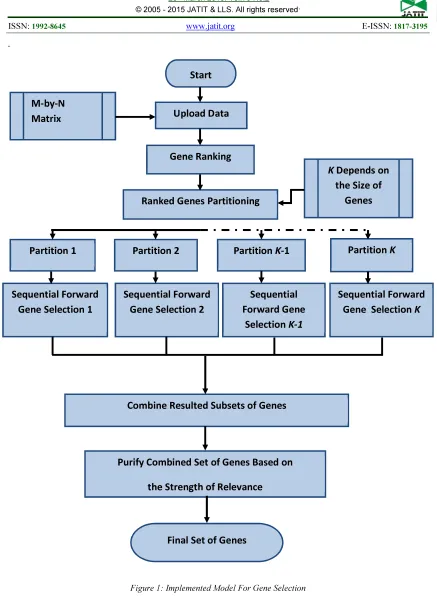
Some of the data sets of microarrays have been analyzed using different methods14–16. Figure 1 depicts the main steps in the selection procedure that were used in this study. As shown in Figure1, the process of analysis begins by considering the matrix of microarray data. This array is based on the pre-processing that converts raw initial data from experiments into the typical form of sample-gene matrix 17,18.
The analysis may take several forms after having the sample-gene matrix . By using the whole gene set, the matrix can be directly used to train a classifier. This way has many drawbacks although it is possible to be done. Many processing resources are required. The seriousness of this issue depends on the essence of the classifier used. Using the whole gene set leads to missing the empirical observation which holds the view that most of these genes are irrelevant8,19.
begin with gene selection of a subgroup of genes which includes the most pertinent genes for certain phenotypic matters. Generally, the process of gene selection is executed over the sample-gene matrix directly. It outlines two main issues: distinctive genes and unnecessary genes. Distinctive genes are those whose profiles have strong statistical differences between different classes. Hence, they are good genes for differentiating between samples which belong to different categories20,21. Unnecessary genes are those that have near profiles. Since one of the genes provides almost the same amount of information as all of them, using all of them does not add value even if these genes are fully distinctive5,22,23. The classifier needs to be examined and is given a numeric efficiency value after being trained with the samples using the selected subgroup of genes. The accuracy of the classification is the most common metric for measuring the classifiers' performance which represents the percentage value of the correctly classified test samples in relation to the entire set of test samples. Regarding testing and evaluating of the classifier, many ways have been discussed in the literature24–28.
According to biologists, nearly all of the genes in the genetic set are unrelated to the analyzed problem. The phenomenon of the curse of dimensionality can lead to high computation cost and reduce the statistical significance. Furthermore, irrelevant genes add noise terms that can misguide the analysis29,30.
The essential filtering of the gene set is done by collecting the most affected subset of genes to participate in the next step of processing. This process is known as gene selection!" that represents feature selection in machine learning. The mathematical formula of gene selection is shown in (Eq.3):
… . .
#$
… . . %&. '
In (Eq.3),gene selection !" selects ( genes from the entire set of genes.The index of the
) chosen gene in the original and entire set of
genes is *+, .
The most instructive genes have many superfluous genes among them, which is another issue in the context of gene selection .Selecting two highly instructive genes which have redundant expressions leads to a reduction in the performance in terms of accuracy and the cost of computation. The same effect is evident when the weight of one of these two genes is doubled. Hence, this situation adds another assignment to the process of gene selection while deals with the redundancy problem5,18,31. Many methods have been used regarding the selection of genes for both supervised and unsupervised learning analyses. Wrapper method(closed-loop) and filter method(open-loop) are the two main classes of gene selection methods5,6. By using feedback from the classifier, the wrapper method that is closed-loop method selects the best subset of genes. Normally, these methods increase the accuracy of the classification relating to the selected subset of genes. Without regarding the classifier that is used later in the classification phase, the filter method selects the subset genes from the entire set. Normally, the filter method assorts the genes based on some virtue criteria to select the top ( ones11,15,17.
Based on the justifications mentioned regarding the gene selection and the significance in the analysis of microarray data, it is apparent that using the full group of genes in the process of classification is not practical from both statistical and biological viewpoints. In deciding on gene selection methods, more than one problem should be borne in mind, for example, if the data are not related to the labels of the classes, then all the methods that are supervised do not apply. However, methods such as individual ranking and consecutive ranking with the information content acting as a comparison criterion can be efficiently applied.
than in the closed-loop method which is done in unique shots even when the actions are repetitive. The closed-loop method comprises whole training and testing for a selected classifier using the selected feature's group in each loop. This method devours much more time and computation resources. Furthermore, the closed-loop method takes into consideration the classifier and the accuracy of classification. This method is instinctive because the accuracy of classification is the ultimate target in almost all cases. Another complexity arises as the open-loop method is fully independent of the classifier whereas the closed-loop method cannot be implemented before specifying the classifier to be used.
The tendency in research is to begin with an open-loop method in order to filter the entire large set of genes by removing the lowest informative ones. The outcome is a subgroup of features(genes) that is still bigger than the final subset of genes sough. Then by using the closed-loop method to produce the ultimate subgroup of selected genes, the resulting genes are processed. This two- grade approach for gene selection includes both coarse-grained gene anthology (open-loop) and fine-grained anthology(closed-loop). It is not easy to compare the open-loop and closed-loop methods. Methods such as SVM-RFE, VIA-SVM, shrunken centroids, and elastic net fully rely on the selected classifiers. However, other methods, for example, in forward sequential selection, its algorithm can be applied with any type of classifier.
2. SUPERVISED CLASSIFICATION
Supervised classification is defined as the procedure of training a classifier (system) by using the obtainable labeled data samples to correctly classify a new unlabelled sample. The training phase(stage) and the online phase are the main phases of supervised classification. The available set of samples is used by the training phase to tune the classifier's parameters to differentiate between the samples that are within(or belong to) different classes. The online
phase(or stage) is when an unlabelled sample is classified by the trained classifier. Many classifiers have been identified and they have been used in the analysis of microarray data. Two examples of classifiers are support vector machines (SVM) 8,15,25,30,32 and k-nearest-neighbor (KNN) 5,9,29–31 .
3. CLASSIFICATION TESTING AND
VALIDATION
A metrical value can calculate the efficiency and performance of each procedure to set up a well-founded comparison when different methods are implemented on different data sets. The accuracy of classification is the most instinctive and most common metric in the classification procedures. Generally, the accuracy of classification is the percentage of the truly classified patterns over the entire set of patterns. Despite having encouraging accuracy, the issue is that for the obtainable data points, the labels (classes) are restricted. When all of these patterns (data points) used to train the classifier, then the classifier is expected to be very distinct to these points. Using the same patterns for testing can obtain perfect but misleading accuracy percentages which do not compute how general the classifier is. From the training point of view, the ultimate possible number of training patterns is needed to make classification as statistically significant as possible. However, from the testing point of view, the ultimate number of testing patterns that have not been examined for classification is needed. Therefore, calculated accuracy gives a better indication of the popularity of the classifier. The issue of selecting training and testing sets of data has been addressed by methods such as k-fold cross-validation 5,25,31,32 and leave-one-out cross-validation (LOOCV) 6.
4. DATA SETS
produced by Affymetrix® microarray technology. The way the preparation of this study was done made it possible to analyze other data sets in future.
4.1 Data Set from Van't Veer et al. (2002)
Provided by the Nederland Institute of Cancer, this data set by Van't Veer et al.(2002) consists of genetic expression values of 24481 genes for 97 of breast cancer patients. The synthesis of this data set was introduced in 2002. The data was analyzed in other publications as in [7;29]. In this study, we selected 78 primary breast cancer samples: 34 from patients who developed distant metastases(relapse) within five years and 44 from patients who continued to be cancer-free after a period of at least five years, as the initial data for selecting marker genes. An additional 19 young, lymph-node negative breast cancer samples were selected as an independent set of primary tumors that were used to validate the prognosis classifier. These data can be requested from (http:// www.nki.nl).
4.2 Data Set from Golub et al. (1999)
Provided by Broad Institute and can be
downloaded from
(
http://www.broadinstitute.org/cgi-bin/cancer/datasets.cgi) , this data set consists of genetic expression values of 7129 genes taken from bone marrows of 72 of Leukemia patients. Synthesis of this data set was introduced in 1999. In this study, we select 38 samples: 27 from acute lymphoblastic leukemia samples (ALL) and 11 from acute myeloid leukemia samples (AML) as the initial data used to select marker genes. An independent data for 34 patients (20 ALL and 14 AML) were obtained for the validation of prognosis classifier.
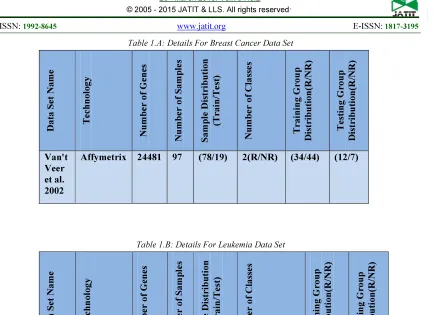
The details of these data sets are shown in tables 1.a and 1.b .
5. METHOD
The main steps involved in the selection procedure for the predictor genes were: (a) genes ranking; (b) partitioning of ranked genes matrix; (c) applying sequential forward feature
selection technique over each part ; (d) combining resulted subsets of predictor genes; and (e) purifying combined set of predictor genes to produce the final subset of genes. Figure 1 shows the main stages in the process of predictor genes selection.
5.a Gene Ranking
The first step was to rank the features( or genes) by using an independent evaluation criterion for binary classification. The input for this step was the sample-features(genes) matrix . The output was matrix which represented the same
samples with the ranked genes in descending order based on the used criterion. The independent criterion used was the absolute value two sample t-test with pooled variance estimate. This criterion assumes normally distributed independent populations, the two sample t-test is used to test whether population means are equal.
5.b Ranked Genes Matrix Partitioning
The feature selection problem is essentially a
combinatorial optimization problem, i.e. a topic
that consists of finding an optimal object from a finite set of objects which is computationally expensive. Traditional feature selection methods address this issue by selecting the top ranked features based on certain scores computed independently for each feature. These approaches neglect the possible correlation
between different features and thus cannot
produce an optimal feature subset. Based on the aforementioned, the hypothesis here is that there is another significant genes that may be ranked within another region, especially with the fact that the filter methods yield poor performance by ignoring the classifier interaction. Thus, the ranked gene-sample matrix (Xr) will be partitioned into (K) partitions in approximately the same size. The purpose of this partitioning process is to facilitate the process of wrapper process of feature selection, where there is no criterion has been adopted in this process.
5.c Sequential Forward Feature Selection
subsets of marker genes. This procedure was done individually on every partition of (-, … -). The technique of sequential forward
selection was applied. Sequential forward selection is a gene selection method which can be used with any type of classifiers. The first thing to do is to define a comparison metric such as the classification accuracy to compare between different sets of selected genes, this metric will form the feedback signal in the method when it runs. The training and sample groups were determined by k-fold cross validation for every part individually. The output represented the best marker gene for every portion of the data. The stopping criterion can be that a predetermined number of selected genes is reached, a specific performance level is reached or the performance enhancement rate is less
than a specific value.
5.d Combining Resulted Subsets of Genes
In this step, the resulted subsets of genes were combined. These subsets of genes was resulted from the process of sequential forward feature selection, each subset represents the predictor genes for that part of ranked genes matrix.
5.e Purifying of Predictor Genes
Gene purifying, or filtering was represented the final step in the procedures for gene selection. The technique of leave one gene out was used to measure the strength of relevance for every gene individually. In this step, every gene was left out temporarily to determine how it strongly relevant by classifying the test samples using the remaining genes. This process was sequentially repeated to produce the optimal subset of predictor genes.
6. RESULTS
In this study, we applied our proposed integrated framework on two different data sets: breast cancer and leukemia data sets. The optimal subset of predictor genes were validated on two different classifiers: support vector machine, SVM and K- Nearest -Neighbor, KNN. The results on prediction accuracy fluctuated based
on the nature of the data sets and kinds of classifiers.
6.1 Breast Cancer Data Set
In the case of breast cancer data set (Van't Veer et al. 2002),the optimal subset of genes which produced from the process of genes purifying has contained the best 29 prediction genes (Table 2.a). These optimal prediction genes were evaluated by classifying the independent test samples (19 patients) with two different classifiers. The first classifier was SVM classifier, the results was 17 true predicted samples out of 19 samples (Accuracy= 89.5%). The another classifier was KNN classifier, the results was 16 true predicted samples out of 19 samples (Accuracy= 84%). We also evaluated it's power for correct classification by performing the (leave-one-out) method for cross validation on the training group (78 patients). The classifier correctly predicted the actual disease's outcome for 68 out of the 78 samples (87%).
6.2 Leukemia Data Set
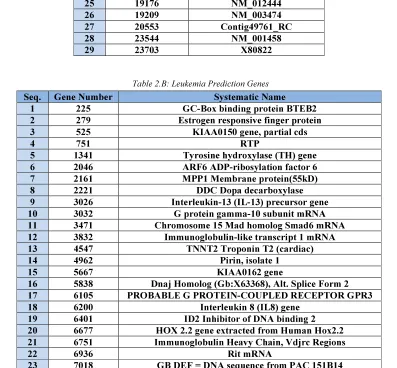
In the case of leukemia data set (Golub et al. 1999),the optimal subset of genes has contained the best 23 prediction genes (Table 2.b). These optimal prediction genes were validated by classifying the independent test samples (34 patients) with two different classifiers. The first classifier was SVM classifier, the results was 31 true predicted samples out of 34 samples (Accuracy= 91%). The another classifier was KNN classifier, the results was 29 true predicted samples out of 34 samples (Accuracy= 85%). We also evaluated it's power for correct classification by performing the (leave-one-out) method for cross validation on the training group (38 patients). The classifier correctly predicted the actual class for 33 out of the 38 samples (86%).
6.3 Results Evaluation
predict either patients having breast cancer would experience a metastasis five years after surgery or not . They were listed (NKI 70), which containing 70 genes that well performed for predicting the outcomes of clinical status (AUC≈ 0.7). It is currently available as a prognostic test for patients with breast cancer. The study in (35) has shown that the prediction accuracy for (NKI 70) genes on training group was (83%) based on LOOCV method. We classified the group of test samples by using (NKI70) subset of prediction genes, the results was 13 true predicted samples out of 19 (Accuracy= 68.5%). Thus, this study has succeeded to improve the accuracy of prognostic test for breast cancer patients. In the study(12), Golub et al. listed their prediction genes. This list contains 50 genes that perform well in predicting the classes of leukemia ( ALL or AML). We classified the group of test samples (34 patients) using these genes, the result was 32 true predicted samples out of 34 samples (Accuracy=94%). The study in (12) has demonstrated that the prediction power for these genes on training group (38 samples) was (92%) based on LOOCV method. The results from our study was reasonable although it was less than published results.
7. DISCUSSION
Gene selection and classification of samples can be implemented using a wide range of different procedures that introduced in the literature. Specifying a method from the long list of methods relies on many heuristic factors, but in most of the cases, the actual implementation decide the final choice in addition to testing for several methods with different parameters and comparing their performance.
8. CONCLUSION
In this paper, an integrated framework for gene selection from cancer microarray data has been proposed and implemented. This framework included a combination of filter and wrapper methods. The framework consists of gene
.
Figure 1: Implemented Model For Gene Selection
M-by-N
Matrix
Start
Upload Data
Gene Ranking
Ranked Genes Partitioning
Partition 1
Partition 2
Partition
K
-1
Partition
K
K
Depends on
the Size of
Genes
Sequential Forward
Gene Selection 1
Combine Resulted Subsets of Genes
Sequential Forward
Gene Selection 2
Sequential Forward
Gene Selection
K
Sequential
Forward Gene
Selection
K-1
Purify Combined Set of Genes Based on
the Strength of Relevance
Table 1.A: Details For Breast Cancer Data Set D a ta S et N a m e T ech n o lo g y Nu m b er o f Gen es Nu m b er o f S a m p le s S a m p le D is tri b u ti o n (T ra in /T e st ) N u m b er o f C la ss e s T ra in in g Gro u p Dis trib u ti o n (R /NR ) T es tin g Gro u p Dis trib u ti o n (R /NR ) Van't Veer et al. 2002
[image:9.595.89.523.89.404.2]Affymetrix 24481 97 (78/19) 2(R/NR) (34/44) (12/7)
Table 1.B: Details For Leukemia Data Set
D a ta S et N a m e T ech n o lo g y Nu m b er o f Gen es Nu m b er o f S a m p le s S a m p le D is tri b u ti o n (T ra in /T e st ) Nu m b er o f C la ss e s T ra in in g Gro u p D is trib u ti o n (R /NR ) T es tin g Gro u p D is trib u ti o n (R /NR ) Golub et al. 1999
Affymetrix 7129 72 (38/34) 2(ALL/AML) (27/11) (20/14)
Table 2.A: Breast Cancer Prediction Genes
Seq. Gene Number Systematic Name
1 1208 NM_003165
2 2001 NM_001826
3 2740 Contig48406_RC
4 3692 NM_003474
5 3692 NM_020228
6 4045 NM_002832
7 4453 AB040922
8 4911 X80822
9 4925 Contig28882_RC
10 4925 AL117435
11 4947 NM_012307
12 4980 AF070647
13 4980 Contig41154_RC
14 4994 Contig43544_RC
15 5143 NM_016492
16 6278 Contig15799_RC
17 15052 NM_015949
[image:9.595.125.478.336.494.2]19 16301 NM_016831
20 16334 Contig47512_RC
21 17024 NM_009586
22 17701 NM_000779
23 18101 NM_018459
24 19095 AL117435
25 19176 NM_012444
26 19209 NM_003474
27 20553 Contig49761_RC
28 23544 NM_001458
[image:10.595.99.496.200.568.2]29 23703 X80822
Table 2.B: Leukemia Prediction Genes
Seq. Gene Number Systematic Name
1 225 GC-Box binding protein BTEB2
2 279 Estrogen responsive finger protein
3 525 KIAA0150 gene, partial cds
4 751 RTP
5 1341 Tyrosine hydroxylase (TH) gene
6 2046 ARF6 ADP-ribosylation factor 6
7 2161 MPP1 Membrane protein(55kD)
8 2221 DDC Dopa decarboxylase
9 3026 Interleukin-13 (IL-13) precursor gene
10 3032 G protein gamma-10 subunit mRNA
11 3471 Chromosome 15 Mad homolog Smad6 mRNA
12 3832 Immunoglobulin-like transcript 1 mRNA
13 4547 TNNT2 Troponin T2 (cardiac)
14 4962 Pirin, isolate 1
15 5667 KIAA0162 gene
16 5838 Dnaj Homolog (Gb:X63368), Alt. Splice Form 2
17 6105 PROBABLE G PROTEIN-COUPLED RECEPTOR GPR3
18 6200 Interleukin 8 (IL8) gene
19 6401 ID2 Inhibitor of DNA binding 2
20 6677 HOX 2.2 gene extracted from Human Hox2.2
21 6751 Immunoglobulin Heavy Chain, Vdjrc Regions
22 6936 Rit mRNA
23 7018 GB DEF = DNA sequence from PAC 151B14
REFERENCES
[1] McGuire WL. Breast cancer prognostic factors: evaluation guidelines. J Natl
Cancer Inst. 1991;83(3):154-155.
doi:10.1093/jnci/83.3.154.
[2] Eifel P et al. National institutes of health consensus development conference statement: adjuvant therapy for breast cancer, November 1-3, 2000. J Natl
Cancer Inst. 2001;93(13):979-989.
doi:10.1093/jnci/93.13.979.
[3] Group EBCTC. Tamoxifen in early breast cancer. Lancet. 1998;352(9152):404. doi:10.1016/S0140-6736(05)60502-8. [4] Group EBCTC. Polychemotherapy for
early breast cancer: an overview of the randomised trials. Lancet. 1998;352(9132):930-942. Available at: http://www.ncbi.nlm.nih.gov/pubmed/975 2815.
Learning in Bioinformatics. 3rd Editio. New Jersey: John Wiley & Sons, Inc; 2009:1-46. doi:10.1002/9780470397428. [6] Weeraratna, A.T. and Taub DD.
Microarray Data Analysis: An Overview of Design, Methodology and Analysis. In: Korenberg MJ, ed. Microarray Data
Analysis: Methods and Applications. 3rd
Editio. New Jersey: Humana Press Inc.; 2007:1-16.
[7] Welsch RSM and R. Comparing and Visualizing Gene Selection and Classification Methods for Microarray Data. In: Yan-Qing Zhang JCR, ed.
Machine Learning in Bioinformatics. 3rd
Editio. New Jersey: John Wiley & Sons,
Inc; 2009:47-68.
doi:10.1002/9780470397428.
[8] Vapnik CC and V. Support-Vector Networks. Mach Learn J. 1995;20:273-297. doi:10.1023/A:1022627411411. [9] S. Pang, I. Havukkala, Y. Hu and NK.
Bootstrapping Consistency Method for Optimal Gene Selection from Microarray Gene Expression Data for Classification Problems. In: Yan-Qing Zhang JCR, ed.
Machine Learning in Bioinformatics. 3rd
Editio. New Jersey: John Wiley & Sons,
Inc; 2009:89-110.
doi:10.1002/9780470397428.
[10]S. Vanichayobon SW and WW. Microarray Gene Selection Using Self-Organizing Map. In: The 7th WSEAS International Conference on Simulation,
Modelling and Optimization. Beijing,
China; 2007:239-244.
[11]Shakya K, Ruskin HJ, Kerr G, Crane M BJ s. l. Comparison of microarray preprocessing methods. Adv Comput Biol. 2010;680:139-147. doi:10.1007/978-1-4419-5913-3_16.
[12]T. R. Golub, D. K. Slonim, P. Tamayo, C. Huard, M. Gaasenbeek, J. P. Mesirov, H. Coller, 1 M. L. Loh, J. R. Downing, M. A. Caligiuri, C. D. Bloomfield ESL. Molecular Classification of Cancer: Class Discovery and Class Prediction by Gene Expression Monitoring. Science (80- ). 1999;286:531-57.
doi:10.1126/science.286.5439.531. [13]Schena M, Shalon D, Davis RW BP.
Quantitative monitoring of gene expression patterns with a complementary DNA microarray. Science (80- ).
1995;270:467–470.
doi:10.1126/science.270.5235.467. [14]Affymetrix GeneChip official website.
Available at: http://www.affymetrix.com. [15]Xiang Xiao, Ernst R. Dow, Russell
Eberhart ZBM and RJO. Gene Clustering Using Self-Organizing Maps and Particle Swarm Optimization. In: Parallel and Distributed Processing Symposium, 2003.
Proceedings. International. Nice, France:
IEEE; 2003:154-163.
doi:10.1109/IPDPS.2003.1213290. [16]Wang, Z. and Palade V. A Comprehensive
Fuzzy-Based Framework for Cancer Microarray Data Gene Expression Analysis. In: The 7th IEEE International
Conference on Bioinformatics and
Bioengineering (BIBE 2007). Boston,
MA,USA: IEEE; 2007:1003-1010. doi:10.1109/BIBE.2007.4375680. [17]Sherlock G. Analysis of large-scale gene
expression data. Curr Opin Immunol. 2000;12:201–205.
doi:10.1093/bib/2.4.350.
[18]Mao XZ and KZ. LS Bound based gene selection for DNA microarray data.
Bioinformatics. 2005;21:1559-1564.
doi:10.1093/bioinformatics/bti216. [19]Brown, M. P., Grundy, W. N., Lin, D. et
al. Knowledge-based analysis of microarray gene expression data by using support vector machines. In: Natl Acad Sci. USA; 2000:262-267, Vol.97.
Available at:
http://www.pnas.org/content/97/1/262.lon g.
[20]S.A. Salem, L.B. Jack and AKN. Investigation of Self-Organizing Oscillator Networks for Use in Clustering Microarray Data. IEEE Trans
Nanobioscience. 2008;7:65-79.
doi:10.1109/TNB.2008.2000151.
[21]OlshenA. B., and Jain AN. Deriving quantitative conclusions from microarray expression data. Bioinformatics. 2002;18:961–970.
doi:10.1093/bioinformatics/18.7.961. [22]K. Tendrapalli, R. Basnet SM and AHS.
Gene Selection for Tumor Classification Using Microarray Gene Expression Data.
In: The World Congress on Engineering.
London, U.K; 2007:290-295, Vol.1.
Available at:
[23]Lander, E. S., Linton, L. M., Birren, B. et al. Initial sequencing and analysis of the human genome. Nature. 2001;409:860– 921. doi:10.1038/35057062.
[24]A. Kulkarni, N. Kumar, V. Ravi USM. Colon cancer prediction with genetics profiles using evolutionary techniques.
Expert Syst Appl. 2011;38:2752 – 2757.
doi:10.1016/j.eswa.2010.08.065.
[25]Abu-Jamous B., Rui Fa., David J. AKN. Paradigm of Tunable Clustering Using Binarization of Consensus Partition Matrices (Bi-CoPaM) for Gene Discovery. PLoS One. 2013;8(2). doi:10.1371/journal.pone.0056432. [26]Andres RD-U and SA de. Variable
selection from random forests: application to gene expression data. In: The 5th
Annual Spanish Bioinformatics
Conference. Barcelona, Spain;
2004:47-53. Available at:
http://ligarto.org/rdiaz/Papers/rfVS/rfVarS el.pdf.
[27]Augenlicht, L. H. and Kobrin D. Cloning and screening of sequences expressed in a mouse colon tumor. Cancer Res. 1982;42:1083-1093. Available at: http://cancerres.aacrjournals.org/content/4 2/3/1088.long.
[28]Augenlicht, L. H., Wahrman, M. Z., Halsey, H., Anderson, L., Taylor, J., and Lipkin M. Expression of cloned sequences in biopsies of human colonic tissue and in colonic carcinoma cells induced to differentiate in vitro. Cancer Res. 1987;47:6017-6021. Available at: http://cancerres.aacrjournals.org/content/4 7/22/6017.long.
[29]G. Abraham, A. Kowalczyk, S. Loi IH and JZ. Prediction of breast cancer prognosis using gene set statistics provides signature stability and biological context. BMC Bioinformatics. 2010;11:277. doi:10.1186/1471-2105-11-277.
[30]B AJ. The Analysis of Microarray Data. 2011.
[31]Guyon, I., Weston, J., Barnhill, S. and V. Gene selection for cancer classification using support vector machines. Mach
Learn. 2002;46:389-422.
doi:10.1023/A:1012487302797.
[32]Yan-Qing Zhang JCR, ed. Fuzzy Gene Mining: A Fuzzy-Based Framework for Cancer Microarray Data Analysis. In:
Machine Learning in Bioinformatics. 3rd
Editio. New Jersey: John Wiley & Sons,
Inc; 2009:111-134.
doi:10.1002/9780470397428.
[33]J.P. Florida, H. Pomares, I. Rojas, J.M. Urquiza LJH and MGC. Effect of Pre-processing methods on Microarray-based SVM classifiers in Affymetrix GeneChip.
In: The 2010 International Joint
Conference on Neural Networks (IJCNN).
Barcelona, Spain: IEEE; 2010:1-6. doi:10.1109/IJCNN.2010.5596308. [34]Lashkari DA, DeRisi JL, McCusker JH,
Namath AF, Gentile C, Hwang SY, Brown PO DR. Yeast microarrays for genome wide parallel genetic and gene expression analysis. In: Natl Acad Sci. USA: PNAS; 1997:13057–13062, Vol.94.
Available at:
http://www.pnas.org/content/94/24/13057. long.
[35]Laura J. van ’t Veer, Hongyue Dai, Marc J. van de Vijver, Yudong D. He, Augustinus A. M. Hart, Mao Mao, Hans L. Peterse, Karin van der Kooy, Matthew J. Marton, Anke T. Witteveen, George J. Schreiber, Ron M. Kerkhoven, Chris Roberts, Peter S. Linsley RB& SHF. Gene expression profiling predicts clinical outcome of breast cancer. Nature. 2002;415:530-536. doi:10.1038/415530a. [36]Lockhart DJ, Dong H, Byrne MC et al.
Expression monitoring by hybridization to high-density oligonucleotide arrays. Nat
Biotechnol. 1996;14:1675-1680.