International Journal of Emerging Technology and Advanced Engineering
Website: www.ijetae.com (ISSN 2250-2459, ISO 9001:2008 Certified Journal, Volume 7, Issue 7, July 2017)
464
Comparative Analysis of E-learning Web-based Educational
Applications – Case Study:Libyan Universities
Emhemed Omran Khalifa
Abstract-- Today, the world will witness the rapid progress in the way of the use of information technology in education. The development of ICT and the Internet, as well as many universities in developing countries to publish e-books and e-learning modules related to the efficiency of higher education through web-based applications training e-learning, is reflected in the design (Zhou et al, 2006).
E-learning (electronic learning) online training, web-based learning and technology delivered instruction fields, uniting in the long run. Internet applications are based on a flexible e-learning to provide a learning environment (Chanchary and Islam. 2011). Compared to traditional training, e-learning with traditional education, the environment, compared to similar, or even better. In addition, e-learning students to produce, create, edit, compress, and lets you set up online in the last academic podcasts free of charge, through the use of open source technology as a learning experience can be improved(Holmes and Gardner, 2006).
E-learning, and now, as an opportunity for higher education has witnessed unprecedented expansion(LeMay et al, 2009). This expansion of the alternative regime calls for the sound and the quality of teaching(Gudep and Selvam, 2009). E-learning of digital information technologies, as well as in remote areas around the world, is growing fast and then becoming an integral part of modern education. E-learning, and a multitude of different teaching methods. However, e-mail communication or received during the Web site (Abdulaziz, 2014) can be done online.
In this research, such as security, availability and value for e-learning, as well as scientists to determine the difference between e-learning and other issues discussed at the meeting. E-learning is one of the great advantages of local teachers will help to reduce dependence (Alzamil, 2006). After the Internet for Students (Clark and Mayer, 2008) is delivered through a network of interactive materials, of course, design, because in this way, the use of e-learning can reduce the problem of staff shortages.
Many of the education system and increasing literacy levels in developing countries want to increase the pressure to provide more educational opportunities. Available at educational institutions, does not correspond to the growth in demand in growth rates. Develops Internet technology and telecommunication systems while learning formal classrooms to offer sustainable and cost-effective alternatives. E-learning due to bad design or background and student experience spent many of his childhood is still a developing country. Higher Education Institutions over the last few years with the adoption of e-learning environment of great interest and the implementation of e-learning for effective implementation of the strategy (Sadiq and Al-Tawil, 2009).
This is Libya's high-educational education e-learning institution in design quality inquiries. In this study, design e-learning applications to discuss the weakness and strength of the academic environment of more students for these applications, loyalty and, in this way, the design of effective Educational Developers Support for the success of e-Learning systems determine the factors (Ministry of Higher Education of Libya, 2012).
I. DATA INSTRUMENT
Participant in the survey question (questions) in order to draw a lot of personal data is necessary for certain data or information (product), consists of a set of data collection tools. Respondents often designed for statistical analysis. However, this is not always the case. Verbal request or a phone call to the same number of easy and often requires the collection and analysis of the data to determine the answer is no, according to information "came tool". However, answers to frequently polls in some populations may not be practical, so that they can read and answer the question, he said, lead to frustration among those who believe margins. in addition, answers to questions related to some of the content may be a problem
II. THE MEASUREMENT SCALE
Likert scale is designed for the quantitative analysis of monitored data consists of 5 categories of participants in a measured response. 5 point Likert scale can measure and assess the business environment and human behavior in the workplace. Scale construction includes the following:
1. Preparation of initial items; a number of affirmative and negative statements about or attitude to be measured, the number of prepared statements must be greater than the final number of statements included in the final version is produced.
2. Administration items to a representative sample of the population whose attitude wanted to be measured. The researcher asked subjects to express their agreement or disagreement with each item on a scale.
3. Assigning scores to the items; it is assigned a score to each item, in order to classify them according reflect positive or negative attitudes of participants. 4. Rating allocation subjects; the score of each subject
International Journal of Emerging Technology and Advanced Engineering
Website: www.ijetae.com (ISSN 2250-2459, ISO 9001:2008 Certified Journal, Volume 7, Issue 7, July 2017)
465
5. Analysis and selection of items; by applying statistical tests on the collected data when making discrimination attitude in question are selected, and reject those that do not meet this requirement. The difference between the Likert scale and Likert scale items is that theLikert scale for each element account. The product is usually (for example, scientific research brands through horizontal lines), together with visual scale, sometimes called the scope of the product. This will cause a lot of confusion
A Likert item is the subject of research can be objective or subjective criteria that can only be answered with the statement. In general, agree with the measured level of the statement. They are often used to answer the five levels):
1) Strongly Disagree 2) Disagree
3) Neutral 4) Agree
5) Strongly Agree
Likert scale is for measuring positive or negative response to a statement, BP. "Not important" is not an option, because sometimes they are positive or negative, to examine four items
Likert scale is for various reasons may be the subject of infringement. Statements of the respondents, or their companies / organizations have a better way to try to get him to prevent the use of science. More balanced statement design for measuring imbalances can solve the problem, but the other two issues will be problematic.
III. DATA ANALYSIS
As mentioned above, such standard deviation mean that linear regressionis as the most important factor for statistical analysis. Analysis of the study, this is usually a lot of variables and variables for testing the main structure statistical analysis because it involves the use of factor analysis, factor analysis and other characteristics of the group of variables, rotation as Bo '. The purpose of this analysis, factor analysis and linear regression analysis of the study results then created a model predictive model.
Statistical analysis of collected data in the Social Sciences Study (SPSS) version 20.0 of the statistical package shows that SPSS software statistical analysis for data management. Software data management tools and graphical display are for results, including statistical calculations, most often, with a wide range of main module states. The following statistical analysis was performed using the SPSS "data management (item selection, file creation, data format)," database and "document information (for data file storage," meta-data dictionary ") in the nature of the process of this software is important.
SPSS statistical analysis is performed using SPSS as the best option is to use the main advantages of the above can be done by two main ways:
i) Wide range of analysis options. SPSS is mainly designed for conducting statistical analysis of observed data in particular and thus SPSS offers a great range of equations and statistical methods, including charts and graphs.
ii)SPSS help the researcher for effective data management. SPSS ease data analysis because of its wide range of statically methods and easy to make analysis from highly usable interface.
The main statistical analyses that will be applied in this study are:
i. Reliability
ii. Descriptive Statistics: Frequencies, Mean, and Standards Deviation.
iii. Analysis of Variance ANOVA iv. Correlations
v. Factor Analysis vi. Linear regression
Descriptive Analysis
Chart describes the main features of the collection of statistical information on the amount of discipline. Ads in this section analysis study of the variables used to measure the parameters that characterize evaluation and analysis of this relationship. The results of this analysis are used to verify the hypothesis. The percentage of each element separately analyzed using descriptive statistics of the following
1. Frequencies 2. Mean
3. Standard Deviation
Descriptive statistics for each factor (latent variable) to determine the significance (of products) used in this study. Information entered using the SPSS software (V.20), data were analyzed using descriptive statistics. This type of information and analysis or frequency of common measures of central tendency has a tendency to generalize, because the main reason for the use of descriptive analysis (mean, standard deviation) of frequencies.
International Journal of Emerging Technology and Advanced Engineering
Website: www.ijetae.com (ISSN 2250-2459, ISO 9001:2008 Certified Journal, Volume 7, Issue 7, July 2017)
466
In probability and statistics, the mean and expected values are used as synonyms to indicate one measure of the probability distribution or the central tendency of a random variable characterized by its distribution.
Standard deviation. Itis a measure that is used to quantify the amount of variation or dispersion of a set of data values. A low standard deviation indicates that the data points tend to be very close to the set's mean (also known as the expected value), while the high standard deviation indicates that the data points are spread over a wider range of values. The closer the standard deviation is to zero, the closer the data points are to the mean of the set (also known as the expected value), while the higher standard deviation indicates that the data points are spread over a wider range of values 1).Figure 1: Standard deviation of normal distribution data.
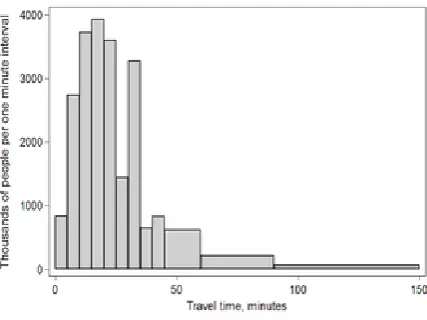
[image:3.595.326.540.142.302.2] Frequencies. Frequency of experiments. The number of times the experiment or study occurred. This frequency is often graphically represented as a histogram (see Figure 2 below). The frequency distribution table is an array of values that one or more variables take from the sample. Each entry in the table contains the frequency or number of occurrences of a value within a particular group or interval, and the table summarizes the distribution of values in the sample. The researchers use SPSS frequency analysis to show the frequency of each response selected by the respondent.
Figure 2: A histogram illustrates depict the frequencies of observations occurring in certain ranges of values.
Percentages. The cumulative percentage is another way of expressing the frequency distribution. The relative frequency distribution calculates the percentage of cumulative frequencies within each interval, just as it does when the frequency relation is calculated. The main advantage of the cumulative percentile of the cumulative percentile for frequency distribution is that it provides an easier way to compare different data sets. Cumulative frequency and cumulative percentage graphs are exactly the same, except for vertical or scale. In fact, you can have two vertical or (cumulative frequencies and a cumulative percentage of the part) in the same graph.
Reliability of data
International Journal of Emerging Technology and Advanced Engineering
Website: www.ijetae.com (ISSN 2250-2459, ISO 9001:2008 Certified Journal, Volume 7, Issue 7, July 2017)
467
The test method is the same procedure for testing the level of stability, and its reaction time to determine whether the same or different times the people in the given sample. In this test, the following answers are used to calculate the correlation coefficients. The second test is the first test, and the correlation of 0.70 or more, the engine is considered reliable.
An alternative form of method means, first, the sample of respondents and the questionnaires are returned. The sentence will remain in the meaning of words and their results after the change. After the change, implementation of the tool is another example. As shown in the previous case, after a comparative analysis of two sets of responses there is a connection between the above found the first and second correlations coefficient 0.70, the engine must be reliable.
Half split methods can be divided into two large samples. After each document is completed and returned, the correlation coefficients are found to be over 70, the team calculated, which can be considered as reliable.
The method of internal consistency assesses the scope of the research of instruments and the most common metric measures. The method of different products, they measure the sense to measure how well concepts. Various products focus on certain variable interest rates in the variables for measuring capacity, as such, is an important measure. Internal consistency, the Cronbach alpha is known as a statistical measure is calculated to reflect the scales on humans. Founded 0.70), Cronbachalpha, a good measure of the reliability of research in social sciences. (1) using a high Cronbach alpha has been found, a more reliable means of interest.
The above four methods compare the first three discovered methodological defects that unfortunately test time and the test is repeated with the same equipment as a result of subjecting fatigue. Split samples are half-interested in different parts If you need to change the use of alternative methods, as well as manage heavy elements as well as time. He is the only one who does not require items on the scale of demand management and to process internal consistency methods do not pose such problems. More importantly, this method only allows you to test reliability for a single administration. This researcher, therefore, evaluates the reliability of devices that are used in this way.
Cronbach alpha has to determine the reliability of their equipment, calculated for all subscales. The Cronbach alpha measures to calculate a one-dimensional construct set of items to choose how best to measure. Factor analysis to measure between correlation items can say whether high or low reliability. The low inter-item correlation between items of high correlation tool is a reliable document, which means they do not comply, that is, the low reliability of the equipment.
Cronbach alpha for all variables in this study are calculated using SPSS, version 20.0, and the results of this thesis are chapters four.
Regression analysis
Regression analysis comprises determining a statistical relationship between two or more variables This analysis is a technique for predicting the value of the dependent variable using one or more independent variables. Regression analysis can be simple or more. In simple regression analysis, only two variables, independent and dependent, are considered for analysis
In this analysis, the study uses several linear regression analysis. Several attempts linear regression applied linear equations to the observed data to model the relationship between two or more variables and variable response. Variables, such as joint management, the factors that may affect the response variable. While there may be many variables, this study is primarily to one explanation variable. variable is the answer to each item. Comments variables are always plotted along the x or horizontal axis Cartesian coordinate system. response variable is plotted along the y-axis.
In this study, multiple regression analysis takes into account the independent variable and the dependent variable, and is considered one or more independent variables, taking into account the ratio between the size of the variable return variable and research. The researcher will apply multiple regression procedure to determine the extent to which these variables are interdependent.The basic relationship in a simple regression is depicted by the following formula:
γ = α+βX
whereγ = the dependent variable; α = constant; β = the beta coefficient; and X = the independentvariable.
In multiple regression analysis more than one independent variable is considered, which enables the magnitude of the direction to be determined, as well as the relationship between a number of variables, with the independent and the dependent variable under consideration. The relevant equation is expressed as follows:
γ=α+βX1+βX2+βX3+βX4+βX 5
whereγ = the dependent variable; α = the constant; β = the beta; and X1-X5 = the independent variables.
International Journal of Emerging Technology and Advanced Engineering
Website: www.ijetae.com (ISSN 2250-2459, ISO 9001:2008 Certified Journal, Volume 7, Issue 7, July 2017)
468
While the primary data that will be collected from the survey using predefined questionnaire, the secondary data will be collected from published journals, books, magazines, internet resources, and newspapers. This chapter shows that the population consists of 3490 individuals represents bachelor and postgraduate students in the University of Tripoli. The design of the research illustrates the plan of study and the path that will be followed by the researcher to solve the problem in this study. The design of a study starts through research questions and objectives, evaluating of variables, set hypotheses, defines data collection methods, and deciding the statistical analysis. The study uses SPSS software to analyze the collected data.
IV. ANALYSIS AND RESULTS
This paper presents the quantitative analysis of the primary data collected from the participants in the survey conducted at the place of the study. The results from the statistical analysis in this chapter are used to achieve the following objectives:
1. Answering research questions.
Examining the relationships between the variables of the study (Usability, Information Quality, System Quality, and E-learning Intention).
2. Testing the hypothesis of the study, the tests include single and multiple linear regressions.
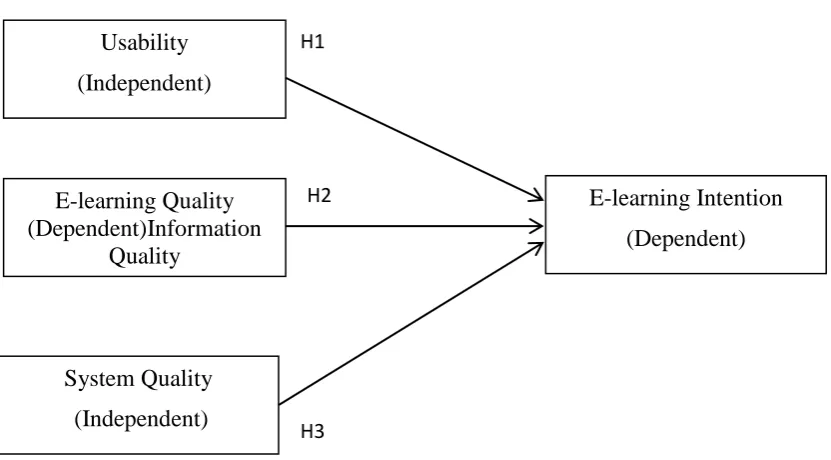
[image:5.595.63.479.347.577.2]3. Evaluating the theoretical model (see figure below) and evaluating the level of association between the variables of the model.
Figure 3 The theoretical model of the study **Sig. < 0.05
As described in previous chapter, the primary data was collected from the survey after distributing questionnaire to the study Sample. After filtering the complete questionnaire forms, the researcher filled the data in SPSS file before conducting the essential statistical analysis. The analysis in this chapter is divided into several sections, and in each section the study discusses the result so that to make the necessary conclusions and examines the relationships between the variables of the study as well as testing the hypothesis, the summary of each section is described below:
Section One: The demographic analysis, whichincludes the analysis ofbiological populations of the study such as age, experience, marital status, academic qualifications, and job experience.
Section Two: Reliability test, the aim of this test is to verify the consistency of the questionnaire and detect any possible error in the design of the questionnaire or detecting items that cause ambiguity for the study sample. The test is conducted by measuring reliability coefficient Cronbach's Alpha. However, if the values of this coefficient are acceptable, then further analysis could be performed.
E-learning Intention
(Dependent)
E-learning Quality
(Dependent)Information
Quality
(Independent)
System Quality
(Independent)
H2
Usability
(Independent)
H1
International Journal of Emerging Technology and Advanced Engineering
Website: www.ijetae.com (ISSN 2250-2459, ISO 9001:2008 Certified Journal, Volume 7, Issue 7, July 2017)
469
Section Three: Descriptive analysis, in this analysis the researcher calculates the descriptive statistics (mean, standard deviation, frequencies) to understand the level of agreement on each item as well as the overall mean value of each variable. The descriptive analysis is useful to find the items those scored the highest level of agreement by the participants in the survey.Section Four:Correlation analysis,where the correlation coefficient (Pearson) is found to know the degree of association between the variables of the study. But the correlation matrix could be not used to specify the direction of association of identify causal relationships, therefore, it is important to conduct regression analysis in next step.
Section Five: Regression analysis, it is used for testing the linear relationships between the variables and testing the hypothesis of the study as well. Simple linear regression is used to examine the relationships between only one independent variable and one dependent variable. A multiple linear regression is used to examine the relationship between many independent variables and others.
V. THE DEMOGRAPHIC ANALYSIS
Demographic analysis allows the researcher to measure the size of the study sample contains a number of methods and techniques. This means, above all, designed for the study of human population, but the population of researchers and social actors in age, experience, marital status, academic qualifications and work experience through the process of change over time can be extended to different places you want. the human population in the biological sense, the development of independent analysis estimates of demographic population using administrative records.
1. Gender
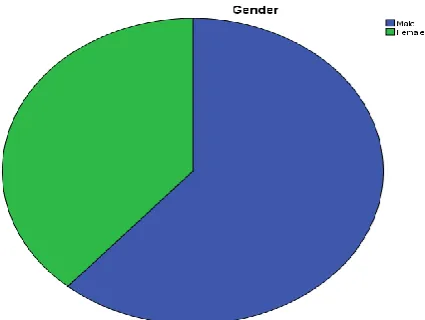
The following table shows the distribution of gender between the participants.
Table 1
Frequencies of Gender demographic factor
Demographic Variable
Category
Frequency
Percentage
Sex
Male
202
61.40%
Female
127
38.60%
Total
385
100%
Gender table above, shows that share of men (61.40%) than women (38.60%).
[image:6.595.170.383.586.746.2]The result is the number of women working in the field of education is lower than men. The following graphic shows the percentage of the study sample of rock.
International Journal of Emerging Technology and Advanced Engineering
Website: www.ijetae.com (ISSN 2250-2459, ISO 9001:2008 Certified Journal, Volume 7, Issue 7, July 2017)
470
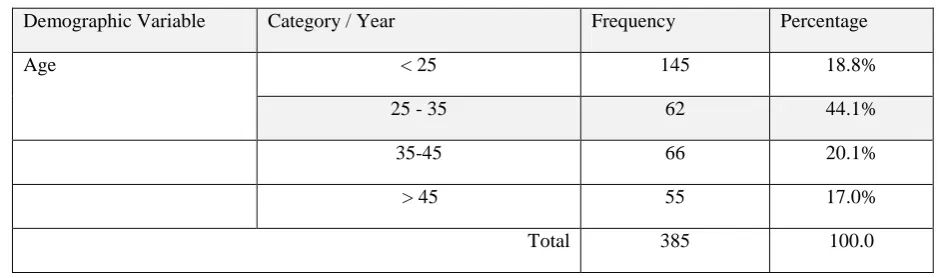
2. Age [image:7.595.61.531.192.331.2]The following table shows the distribution of age between the participants.
Table 2
Frequencies of Age demographic factor
Demographic Variable Category / Year Frequency Percentage
Age < 25 145 18.8%
25 - 35 62 44.1%
35-45 66 20.1%
> 45 55 17.0%
Total 385 100.0
The table of age above shows that the maximum percentage of age (44.10%) is age group between (25-35) years old. This result shows that the university have a good number of middle aged staff and lecturer (about 50%).
Where elder staff and lecturers greater than 45 years) represent the lowest percentage in the university (17.00%). The following chart shows that percentage of age in the study sample.
Figure 5 The age chart of study sample
3. Education
[image:7.595.125.478.401.577.2]International Journal of Emerging Technology and Advanced Engineering
Website: www.ijetae.com (ISSN 2250-2459, ISO 9001:2008 Certified Journal, Volume 7, Issue 7, July 2017)
[image:8.595.60.528.163.322.2]471
Table 3Frequencies of Academic Qualification demographic factor
Demographic Variable Category / Year Frequency Percentage
Academic qualifications
Diploma 74 22.50%
Bachelor degree 169 51.40%
Master degree 44 13.40%
Ph.D degree 42 12.80%
Total 385 100.0
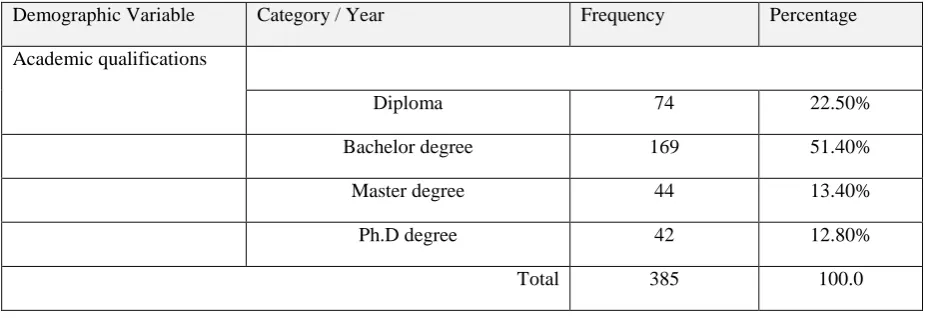
The table above shows frequencies and percentages of academic qualifications of participant. It is found that bachelor degree represents the highest percentage (51.40%).
[image:8.595.144.460.382.597.2]The following chart shows that distribution of academic qualifications of the study sample.
Figure 6 The academic qualification chart of study sample
4. Marital Status
[image:8.595.58.528.677.767.2]The following table shows the distribution of marital status of employees and staff in the hospital:
Table 4
Frequencies of Marital Status demographic factor
Demographic Variable Category / Year Frequency Percentage
Marital status Single 160 48.60%
Married 169 51.40%
International Journal of Emerging Technology and Advanced Engineering
Website: www.ijetae.com (ISSN 2250-2459, ISO 9001:2008 Certified Journal, Volume 7, Issue 7, July 2017)
472
The table above shows frequencies and percentages of marital status of participant. It is found that the number of married staff and lecturer are slightly greater than
[image:9.595.168.389.191.337.2]singles (51.40%), about half number of employees and staff are married. The following chart shows that distribution of marital status of the study sample.
Figure 7 The marital status chart of study sample
VI. THE RELIABILITY TEST
The reliability of the respondents used the initial data collection application used for testing the consistency of the total. The coefficient of reliability associated with a test score is a measure of the amount of measurement error.
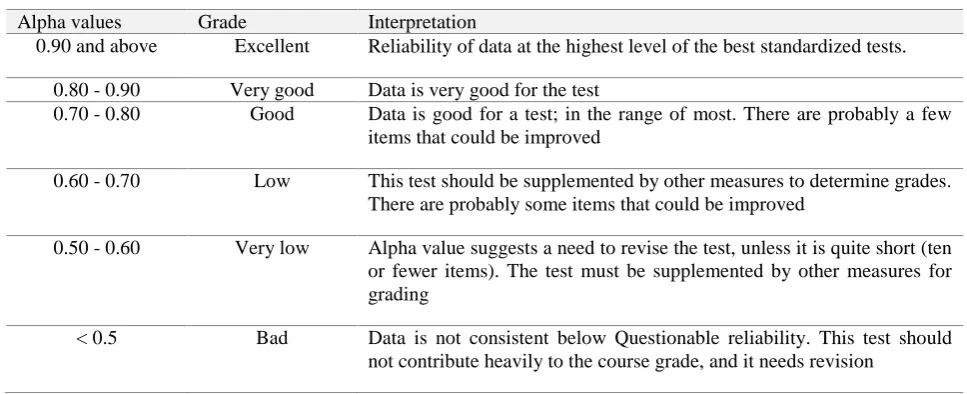
[image:9.595.55.539.459.656.2]In general, the reliability coefficient, this one on how to best measure of the internal consistency of all of the items in our product. 0.00 and 1.00 for the reliability coefficient alpha range (see table below), the higher the value, the more reliable test results. Reliability interpretation is based on the following values:
Table 5
Reliability Cronbach's Alpha classifications
Alpha values Grade Interpretation
0.90 and above Excellent Reliability of data at the highest level of the best standardized tests.
0.80 - 0.90 Very good Data is very good for the test
0.70 - 0.80 Good Data is good for a test; in the range of most. There are probably a few items that could be improved
0.60 - 0.70 Low This test should be supplemented by other measures to determine grades. There are probably some items that could be improved
0.50 - 0.60 Very low Alpha value suggests a need to revise the test, unless it is quite short (ten or fewer items). The test must be supplemented by other measures for grading
< 0.5 Bad Data is not consistent below Questionable reliability. This test should not contribute heavily to the course grade, and it needs revision
The output table form SPSS shows that the reliability coefficient Cronbach's Alpha of all variables equal 0.942 (94.20%). Based on the above classifications of alpha values, it is found that the current reliability of collected data associated with all items used in the survey is “Excellent”, which is considered the level of the best standardized tests in statistical approaches as shown in the table below.
International Journal of Emerging Technology and Advanced Engineering
Website: www.ijetae.com (ISSN 2250-2459, ISO 9001:2008 Certified Journal, Volume 7, Issue 7, July 2017)
[image:10.595.66.529.164.284.2]473
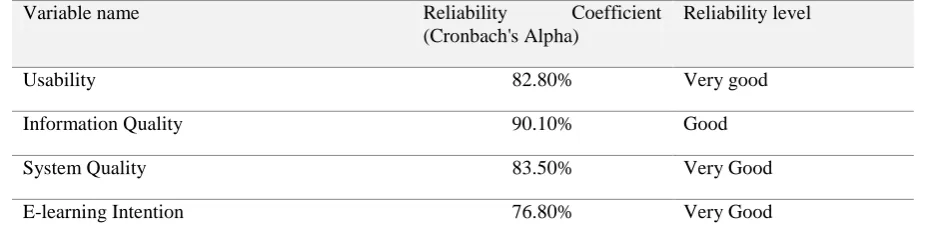
Table 6Reliability Cronbach's Alpha of each variable
Variable name Reliability Coefficient
(Cronbach's Alpha)
Reliability level
Usability 82.80% Very good
Information Quality 90.10% Good
System Quality 83.50% Very Good
E-learning Intention 76.80% Very Good
After checking the overall reliability of the whole items in the questionnaire, and checking Cronbach's Alpha for each variable. It is found that the consistency of items associated with each variable is acceptable for statistical analysis. Therefore, further analysis could be conducted.
VII. THE DESCRIPTIVE ANALYSIS
In a study of descriptive statistics, used to describe the main features of the data. They design and measures are about a simple summary. Together with simple graphics analysis, they are just the basics of quantitative analysis. In Univariate analysis at the same time for a change include the examination of cases worldwide. The study was descriptive analysis uses a variable There are three main features:
Distribution, which is a summary of the frequency of individual values or ranges of values for a variable. Frequency tables are the main type to measure distribution.
Central tendency. The central tendency of a distribution is an estimate of the "center" of a distribution of values. There are three major types of estimates of central tendency. The main type of estimates of central tendency is (Mean).
Dispersion, It refers to the diffusion of values centered on the central tendency. There are two general measures of dispersion, range and standard deviation. The standard deviation is a more accurate and detailed variance estimate, since the ideal value can greatly exaggerate the range. The following sections describe the descriptive statistics associated with each variable:
Usability
International Journal of Emerging Technology and Advanced Engineering
Website: www.ijetae.com (ISSN 2250-2459, ISO 9001:2008 Certified Journal, Volume 7, Issue 7, July 2017)
[image:11.595.55.543.158.485.2]474
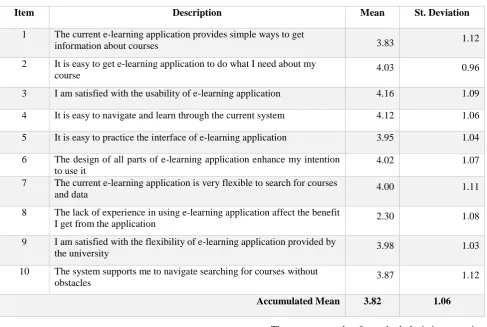
Table 7Descriptive result of Usability of e-learning application
Item Description Mean St. Deviation
1 The current e-learning application provides simple ways to get
information about courses 3.83 1.12
2 It is easy to get e-learning application to do what I need about my
course 4.03 0.96
3 I am satisfied with the usability of e-learning application 4.16 1.09
4 It is easy to navigate and learn through the current system 4.12 1.06
5 It is easy to practice the interface of e-learning application 3.95 1.04
6 The design of all parts of e-learning application enhance my intention to use it
4.02 1.07
7 The current e-learning application is very flexible to search for courses
and data 4.00 1.11
8 The lack of experience in using e-learning application affect the benefit
I get from the application 2.30 1.08
9 I am satisfied with the flexibility of e-learning application provided by
the university 3.98 1.03
10 The system supports me to navigate searching for courses without
obstacles 3.87 1.12
Accumulated Mean 3.82 1.06
The findings from the descriptive result associated with this variable are summarized in the following points:
The maximum level of agreement is found on item 3 (mean = 4.16), which understand that student at the university are satisfied with the usability of e-learning application.
The minimum level of agreement is found on item 8 (mean = 2.30), according to that the lack of experience in using e-learning application affect the benefit that students can get from the application.
The average standard deviation of all items is large (1.06). Basically, a large standard deviation means that the values in a statistical data set far to the mean of the data set, on average.
The current result of standard deviation associated with this variable shows that the majority of responses are clustering away from the mean value of each item. All items will be collected equal to the average (3.82). This value is positive and university systems and web-integrated application of e-learning by the participants of the existence of a moderate level of agreement. The experiment concluded that the use of e-learning students to answer their e-learning Libya using weak experience shows that it is an important factor. For this reason, the university, and this factor must provide special courses for students in the first year of the study.
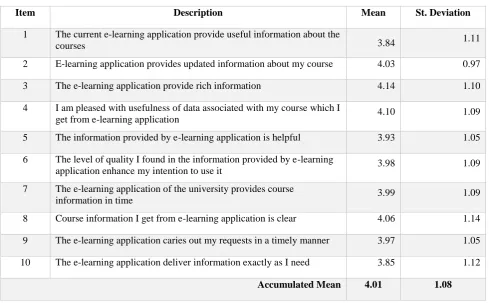
Information Quality
International Journal of Emerging Technology and Advanced Engineering
Website: www.ijetae.com (ISSN 2250-2459, ISO 9001:2008 Certified Journal, Volume 7, Issue 7, July 2017)
[image:12.595.54.544.158.461.2]475
Table 8Descriptive result of Information Quality of e-learning application
Item Description Mean St. Deviation
1 The current e-learning application provide useful information about the
courses 3.84 1.11
2 E-learning application provides updated information about my course 4.03 0.97
3 The e-learning application provide rich information 4.14 1.10
4 I am pleased with usefulness of data associated with my course which I
get from e-learning application 4.10 1.09
5 The information provided by e-learning application is helpful 3.93 1.05
6 The level of quality I found in the information provided by e-learning
application enhance my intention to use it 3.98 1.09
7 The e-learning application of the university provides course
information in time 3.99 1.09
8 Course information I get from e-learning application is clear 4.06 1.14
9 The e-learning application caries out my requests in a timely manner 3.97 1.05
10 The e-learning application deliver information exactly as I need 3.85 1.12
Accumulated Mean 4.01 1.08
The findings from the descriptive result associated with this variable are summarized in the following points:
The maximum level of agreement is found on item 3 (mean = 4.14), which understand that the e-learning application provide rich information and this could help student significantly.
Item 4 scored the second highest level of agreement (mean = 4.10), which understands that students are pleased with usefulness of data associated with their course which they get from e-learning application. This shows that the current e-learning application installed in the university website is providing good level of information quality.
The minimum level of agreement is found on item 1 (mean = 3.84), according to that The current e-learning application provide useful information about the course, but still this represent a good level of agreement and shows good level of quality provided by the application.
The average standard deviation of all items is large (1.08). Basically, a large standard deviation means that the values in a statistical data set far to the mean of the data set, on average.
The current result of standard deviation associated with this variable shows that the majority of responses are clustering away from the mean value of each item. The accumulated mean ofall items equal (4.01). This value is positive and indicates a high level of agreement by the participants on the quality of information provided by e-learning application.
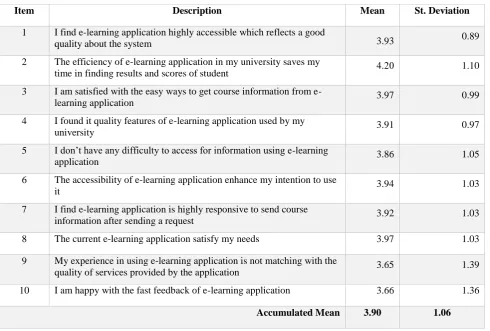
System Quality
International Journal of Emerging Technology and Advanced Engineering
Website: www.ijetae.com (ISSN 2250-2459, ISO 9001:2008 Certified Journal, Volume 7, Issue 7, July 2017)
[image:13.595.55.546.160.491.2]476
Table 9Descriptive result of System Quality of e-learning application
Item Description Mean St. Deviation
1 I find e-learning application highly accessible which reflects a good
quality about the system 3.93 0.89
2 The efficiency of e-learning application in my university saves my
time in finding results and scores of student 4.02 1.10 3 I am satisfied with the easy ways to get course information from
e-learning application 3.97 0.99
4 I found it quality features of e-learning application used by my
university 3.91 0.97
5 I don’t have any difficulty to access for information using e-learning
application 3.86 1.05
6 The accessibility of e-learning application enhance my intention to use
it 3.94 1.03
7 I find e-learning application is highly responsive to send course
information after sending a request 3.92 1.03
8 The current e-learning application satisfy my needs 3.97 1.03
9 My experience in using e-learning application is not matching with the
quality of services provided by the application 3.65 1.39 10 I am happy with the fast feedback of e-learning application 3.66 1.36
Accumulated Mean 3.90 1.06
The findings from the descriptive result associated with this variable are summarized in the following points:
The maximum level of agreement is found on item 2 (mean = 4.0), which understand that the efficiency of e-learning application in the Libyan university saves time for students in finding results and scores associated with their study.
Item 9 scored the min level of agreement (mean = 3.65), which shows that the experience of users with e-learning application is poor and not matching with the quality of services provided by the application.
The average standard deviation of all items is large (1.06). Basically, a large standard deviation means that the values in a statistical data set far to the mean of the data set, on average.
All items collected average (3.90). This value is positive, and the quality of the application of e-learning contract by the participants at the highest level. It found that university students experience a low of Libya and university systems and Web sites in e-learning with the use of matching. According to the university administration at the University of s-should consider this factor before planning for the education, students need to know how such a system, and this is the first year for students to be done through intensive courses In order to get the maximum benefit from the system at the university.
Intention to use E-Learning
International Journal of Emerging Technology and Advanced Engineering
Website: www.ijetae.com (ISSN 2250-2459, ISO 9001:2008 Certified Journal, Volume 7, Issue 7, July 2017)
[image:14.595.53.544.157.497.2]477
Table 10Descriptive result of Intention to use e-learning application
Item Description Mean St. Deviation
1 The good performance of e-learning application increase my intention
to use it the future 3.87 0.99
2 The ease of use of e-learning application increases my intention to use
it 4.01 0.90
3 The good utilities of e-learning application affect my intention to use it
positively 4.07 0.96
4 The simple way to get and reach information of e-learning application
affect my intention to use it positively 4.05 1.02
5 The rich of data I get from e-learning application increases my
intention to use it 3.96 0.98
6 The fast response of e-learning application enhance my intention to
use it 3.97 0.99
7 I find e-learning application is highly accessible then I use it more
frequent in the future 3.92 1.04
8 I have a good knowledge about e-learning application 2.55 1.27
9 I find e-learning application is convenience then I use it more frequent
in the future 3.84 1.16
10 When e-learning application satisfy my needs then I have more
intention to use it in the future 3.80 1.16
Accumulated Mean
3.90 1.06The findings from the descriptive result associated with this variable are summarized in the following points:
The maximum level of agreement is found on item 3 (mean = 4.07), which understand that the good utilities of e-learning application affect the intention of students to use this system positively and periodically.
The minimum level of agreement is found on item 8 (mean = 2.55), this results confirms that the knowledge about e-learning application is a very important factor and affect the intention to use e-learning by students.
The average standard deviation of all items is large (1.04). Basically, a large standard deviation means that the values in a statistical data set far to the mean of the data set, on average.
The current result of standard deviation associated with this variable shows that the majority of responses are clustering away from the mean value of each item.
The accumulated mean ofall items equal (3.7). This value is positive and indicates a moderate level of agreement by the participants on the intention to use e-learning applications. It is concluded that student have good perception about e-learning but they need to know more about this concept. Students who have poor knowledge or no knowledge at all about e-learning will definitely stop using the application because they don’t know how to get the information associated with their courses.
VIII. SUMMARY
International Journal of Emerging Technology and Advanced Engineering
Website: www.ijetae.com (ISSN 2250-2459, ISO 9001:2008 Certified Journal, Volume 7, Issue 7, July 2017)
[image:15.595.84.509.164.301.2]478
Table 11Summary of Descriptive Results
Variable Standard deviation Mean
Usability 3.82 1.06
Information Quality 4.01 1.08
System Quality 3.90 1.06
E-learning intention 3.7 1.04
The following chart shows the summary of descriptive results associated with each variables
Figure 8 The descriptive results of all variables
IX. PEARSON CORRELATION ANALYSIS
In the correlation analysis, this study evaluated the sample coefficient of correlation (r), in particular Pearson product moment correlation coefficient. Matrix correlation is important because it is used in the theoretical framework for testing the degree of association between predefined variables.
The correlation coefficient is a measure of linear association between two variables. The value of the correlation coefficient is always between -1 and +1. The correlation between the two variables can be positive or negative. A correlation coefficient of 1 indicates that the two variables are perfectly linked to positive linear relationship (i.e., a high level of one variable indicating a high level of other low level). A correlation coefficient of -1 indicates that the two variables are perfectly related. (Ie, the upper level of one variable is associated with the second lower level), a correlation coefficient of 0 indicates that there is no linear relationship between the two variables.
For example, a correlation of r = 0,9 indicating a strong positive correlation between two variables, while the correlation of r = -0.2 indicates a weak negative association. A close correlation between the 0 indicates that no linear correlation between the two continuous variables.
Any correlation greater than 0.30 is accepted
The output of the correlation matrix table (see table below) shows that all correlations between the independent variable and the dependent variable (E-learning intention) are strong (r** > 0.30, ρ < 0.05, ρ = 0.000). The following summary shows the result of correlation matrix,
1.Pearson correlation between Usability and E-learning Intention= .727** (statistically highly significant)
2.Pearson correlation between System Quality and E-learning Intention= .
753
** (statistically moderate significant)Usability, 1.00, 3.82
Information _Quality,
1.00, 4.01 System_Quali ty, 1.00, 3.90
E-learning Quality, 1.00,
3.70
[image:15.595.135.463.322.512.2]International Journal of Emerging Technology and Advanced Engineering
Website: www.ijetae.com (ISSN 2250-2459, ISO 9001:2008 Certified Journal, Volume 7, Issue 7, July 2017)
479
3.Pearson correlation between Information Quality and E-learning Intention= .720** (statistically high significant)
The highest level of correlation is found between Usability and E-learning Intention A correlation of r = .727 (ρ < .0005, ρ = 0.000) suggests a strong positive correlation between Usability and E-learning Intention.
[image:16.595.51.545.251.434.2] [image:16.595.53.545.253.436.2]The lowest level of correlation is found between System Quality and E-learning intention. A correlation of r = .357 (ρ < .0005, ρ = 0.000) suggests a middle positive correlation between System Quality and E-learning Intention.
Table 12
Pearson Correlation Matrix of study variable
Correlations
X1_Usability X3_System_Qual Y_ E-learning Intention
X2_Information _Qual
X1_Usability
Pearson Correlation 1 .590** .727** .955**
Sig. (2-tailed) .000 .000 .000
N 385 385 385 385
X3_System_Qual
Pearson Correlation .590** 1 .357** .625**
Sig. (2-tailed) .000 .000 .000
N 385 385 385 385
Y_E-learning Intention
Pearson Correlation .727** .357** 1 .720**
Sig. (2-tailed) .000 .000 .000
N 385 385 385 385
X2_Information_Qual
Pearson Correlation .955** .625** .720** 1
Sig. (2-tailed) .000 .000 .000
N 385 385 385 385
**. Correlation is significant at the 0.01 level (2-tailed).
X. SUMMARY
This paper presented the highlights of the thesis including the problem statesman, research questions, research objective, the significance of the study. It is argued that educational institutes play the most vital role in building the future of Libya, and without developing and adoption of new education methods; the educational institutes of Libya may face a wide gap with other countries.E-learning is very affordable teaching method, and saves the time of students by deployment of information technology in educational materials, cultural, social and economic benefits of E-learning because it allows for the development of knowledge. Where learning models are continually emerging as new e-learning technology tools and new research findings in the different areas of e-learning become available. This study will develop a web-based e-learning application for Libyan higher education institutes. Previous studies showed that the intention to use e-learning by Saudi students affected by different factors such as attitude and perception of students.
XI. CONCLUSION AND RECOMMENDATIONS
In this study, Libya education institutions plan to use the programs for e-learning and affects the quality system and quality information.
E-learning education development of theoretical models for variable learning web-based (eg quality systems, quality information and the availability of e-learning are considered the basis of analysis of the relationship between the use of the target). The study design questions and objectives through data collection and statistical analysis methods to study the design variables and determine decisions to assess the hypothesis. SPSS software to analyze the data collected in the study. The following sections summarize each variable decision.
XII.USABILITY
It concluded that the use of e-learning experience is an important factor, most users of these systems before the introduction of e-envy in Libya, e-learning training courses for all students in a poor experience. Therefore, the presence of Libyan universities as an important factor in the first year of the study and the need to provide special courses for students. The existence of a strong, positive and causal e-learning where the goodwill associated with the initial estimate, has been approved.
XIII. INFORMATION QUALITY
International Journal of Emerging Technology and Advanced Engineering
Website: www.ijetae.com (ISSN 2250-2459, ISO 9001:2008 Certified Journal, Volume 7, Issue 7, July 2017)
480
The respondents accept the importance of this variables with a high level of agreement. It is found that e-learning application provide rich information and this could help student significantly. Therefore, the quality of data and information provided by e-learning has a strong impact on users and encourage them to use the system frequently. The result of the study showed that information quality is correlated with e-learning intention in a positive, strong, and causal relationship.
XIV.SYSTEM QUALITY
System quality is a measure of success of any information system. There are certain measures for system qualities that determine the level of quality of e-learning. According to that, the developers of e-learning applications should consider this factor before the implementation in academic environment, also students need to know the quality measures of e-learningand this can be a determinant factor for using the system frequently. It is found that that system quality is correlated with e-learningin a positive, strong, and causal relationship.
XV. INTENTION TO USE E-LEARNING
The intention to use e-learning is assumed a dependent variable in this study which is affected by three independent variables (usability, system quality, and information quality). The respondents confirmed that their acceptance to use e-learning is highly correlated with these three variables. The result showed that student in Libya have good perception about e-learning but they have low intention to use because of weak experience with this system. However, Libyan students has the willingness to learn about e-learning applications but they could not use it correctly and efficiently. It is evident from the result that students who have poor knowledge or no knowledge at all about e-learning will definitely stop using the application because they don’t know how to get the information associated with their courses.
In addition to that,the experience of students in the Libyan university is low and not matching with the current e-learning application which has been installed by the IT department of the university. The test of multiple linear regression shows that usability, system quality, and information quality affecting the intention to use e-learning directly in positive and causal relationships
XVI. CONCLUSION
Literature reveals that many e-learning enabled universities around the world are encouraging the adoption of this technology in learning educational and business organizations.
Most scientists have confirmed that e-learning has the potential to meet the needs and expectations of students by addressing their educational problems.
Previous studies relating to the implementation and development of e-learning in all educational institutions belongs to the government and public sector, as well as any related study has implications for the usefulness, attitude, considered the usefulness of e-learning and intended to be used as a.
According to the results of this research, makes e-learning provided answers to some of the problems identified students. Provide alternative means for communication with teachers and peers, provide a variety of learning materials and forms, expand the flexibility and quality of work in a group and give students feedback on their assignments. However, the number of students in Libya using applications for e-learning is still small, and there is a lack of design weaknesses and inadequate experience.
Theoretical examination showed a high priority and importance of e-learning in educational institutions implementing e-learning technologies in the educational system. Modern educational institutions want to gain a competitive advantage with other colleges and universities should adopt a new way of student learning. Most universities in developing countries have found it all interesting to adopt e-learning applications to help students learn faster and better and start online academic programs, When applied, the institution should spend more time on managing and sharing knowledge with students with significant advantages in the institute.
Literature and previous studies have shown that students can not use the application for e-learning in large part, because they had a lot of flaws in the design of applications, including long time in response to customer demand, low availability, and poor application flexibility. Poor quality information. All of these factors are considered weaknesses in the design application training e-learning on the Web that do not meet the targets by using these systems in educational institutions.
The empirical results show that the correlation between the independent variables (utility, quality systems, quality information) and dependent variables (intention e-learning) is a high level of interpretation is high. (R 2 = 0.549), which makes 54,90% of the volatility of the dependent variable (s intent-learning) of the independent variable (utility, quality information and quality systems) relationship. In other words, after the completion of investigation in Libya, a theoretical model very well fits the data.
International Journal of Emerging Technology and Advanced Engineering
Website: www.ijetae.com (ISSN 2250-2459, ISO 9001:2008 Certified Journal, Volume 7, Issue 7, July 2017)
481
Involvement of students in the system for e-learning have adopted public and state-run colleges still not encouraging. There are a lot of difficulties and obstacles for ease of use, ease of use and usefulness of students, such as English, and the difficulties of the institution. In conclusion, the actual contribution of e-learning is important throughout the curriculum in all countries, including Libya. There is a good signal that the intention of Libya for the use of e-learning is on the rise, but not as much as the great support of the government.
XVII. FUTURE STUDIES
This analysis in this study is limited to one university only. Therefore, it is highly recommended to conduct wider investigation on the variables of this study in other universities in Libya to understand the effect of usability, system quality, and information quality on the intention to use e-learning from different views. It is recommended to include other variables such as service quality to enhance the understanding of e-learning intention in academic level
XVIII. RECOMMENDATIONS
The study sets the following recommendations based on the findings and results from the theoretical and empirical analysis:
There is a need to conduct an intensive courses giving to students at first year of their study at the university in order to get the maximum advantage from the system. The weak experience in using e-learning in Libya can be solved through training courses for all students to introduces e-leaning before the implementations of these systems
The information provided by e-learning application should include the quality measure such accuracy, objectivity, Believability, reputation, relevance, value-added, Completeness, amount of information.
There are certain dimensions for system qualities such as functionality, flexibility, convenience, responsiveness, and timeliness which should be provided in e-learning system to enhance the level of quality of e-learning. According to that, the developers of e-learning applications should consider these dimensions before the implementation in academic environment.
It is important to enhance the experience of students to use e-learning with full confidence because the experience of students in the Libyan university is low with e-learning applications and not matching with the current development of these systems. The staff of IT department of the university must conduct periodic meetings with students to know their problems after trying to using e-learning.
The developers of e-learning applications must focus on good performance to increase my intention to use it the future. For example, the ease of use of e-learning should be considered, and the good utilities provided for students may affect their intention positively.
E-learning applications should provide a simple way to get information about the courses and other academic data. It is concluded that high quality of information of e-learning application affect the intention to use it significantly.
REFERENCES
[1] Cheng-Ying Yang, Ah-Fur Lai1 and Chun Chen, Ming-Hsiang Hwang,Cheng-Yi Li (2012). An Investigation on Procrastination in the E-learning Environment, Information Science and Digital Content Technology (ICIDT), 2012 8th International Conference, Vol.3
[2] Farah HabibChanchary, Samiul Islam (2011). Is Saudi Arabia Ready for E-Learning? – A Case Study, Department of Computer Science, Najran University, Najran, Saudi Arabia
[3] Holmes B. & J. Gardner (2006). E-learning: Concepts and Practice; London : SAGE Publications
[4] Kathryn C. Dixon and Robert Dixon (2007). Designing quality e-learning environments in higher education Lou Siragusa, Faculty of Education, Language Studies and Social Work, Curtin University of Technology,Proceedingsascilite Singapore 2007: Full paper: Siragusa, Dixon & Dixon
[5] Zhang, L. Zhou, R.O. Briggs &J.F. Jr. Nunamaker (2006). Instructional video in e-learning: Assessing the impact of interactive video on learning effectiveness,” Information & Management, Vol. 43
[6] Ministry of Higher Education of Saudi Arabia, 2012, source: http://www.mohe.gov.sa/en/default.aspx
[7] Syed Hussain Ali, Sadiq M. Sait& Khalid M. Al-Tawil (2009). Perceptions about e-Learning in Saudi Arabia, King Fahd University of Petroleum & Minerals, Saudi Arabia
[8] Pat LeMay Burr, Ph.D., Annette E. Craven, Ph.D. (2009). E-Learning: Creating a High Touch Learning Community with High Tech, 2009 Fourth International Conference on Innovative Computing, Information and Control
[9] Fahad N. Al-Fahad. 2009. “Students' Attitudes and Perceptions Towards the Effectiveness of Mobile Learning In King Saud University, Saudi Arabia”. The Turkish Online Journal of Educational Technology – TOJET April 2009. Volume (8) Issue 2 Article 10.
[10] Algahtani, Abdullah, Faleh. 2011. “Evaluating the Effectiveness of the E-learning Experience in Some Universities in Saudi Arabia from Male Students' Perceptions, Durham theses, Durham University.. Available at Durham E-Theses Online: http://etheses.dur.ac.uk/3215/.
[11] Ahmed Maajoon. Alenezi, M. A. 2012.“Faculty Members’ Perception of E-learning in Higher Education in the Kingdom of Saudi Arabia (KSA)”.Journal of Educational Instructional Technology.
[12] Syed Hussain Ali, Sadiq M. Sait& Khalid M. Al-Tawil.2009. “Perceptions about e-Learning in Saudi Arabia”. King Fahd University of Petroleum & Minerals, Saudi Arabia
International Journal of Emerging Technology and Advanced Engineering
Website: www.ijetae.com (ISSN 2250-2459, ISO 9001:2008 Certified Journal, Volume 7, Issue 7, July 2017)
482
[14] AbdulazizYahyahNaserAlrashidi. 2014. “E-learning in Saudi Arabia: A Review of the Literature”. British Journal of Education, Society &Behavioural Science
[15] Al-Fahad FN. 2010. “The learners’ satisfaction toward online e-learning implemented in the College of Applied Studies and Community Service”. Turkish Online Journal of Distance Education.Vol. 11(2).
[16] Ashit Kumar Dutta , Al-Adhaileh Mosley, Mohammad MobinAkhtar. 2011. “E-learning in Higher Education: Design and Implementation”. IJCSI International Journal of Computer Science Issues, Vol. 8, Issue 4, No 2.
[17] Farah HabibChanchary, Samiul Islam. 2010. “Is Saudi Arabia Ready For E-Learning? – A Case Study”. Najran University, Najran, Saudi Arabia
[18] Given, Lisa M. (2008). The Sage encyclopedia of qualitative research methods. Los Angeles, Calif.: Sage Publications. [19] AbdulazizYahyahNaserAlrashidi. 2014. “E-learning in Saudi
Arabia: A Review of the Literature”. British Journal of Education, Society &Behavioural Science
[20] Ahmed Maajoon. Alenezi, M. A. 2012.“Faculty Members’ Perception of E-learning in Higher Education in the Kingdom of Saudi Arabia (KSA)”.Journal of Educational Instructional Technology.
[21] Al-Fahad FN. 2010. “The learners’ satisfaction toward online e-learning implemented in the College of Applied Studies and Community Service”. Turkish Online Journal of Distance Education.Vol. 11(2).
[22] Algahtani, Abdullah, Faleh. 2011. “Evaluating the Effectiveness of the E-learning Experience from Male Students' Perceptions, Durham theses, Durham University. Available at Durham E-Theses Online: http://etheses.dur.ac.uk/3215/.
[23] AmalRhema and IwonaMiliszewska. 2010. "Towards E-Learning in Higher Education in Libya".Issues in Informing Science and Information Technology. Victoria University, Melbourne, Victoria .Issues in Informing Science and Information Technology Volume 7.
[24] Ashit Kumar Dutta , Al-Adhaileh Mosley, Mohammad MobinAkhtar. 2011. “E-learning in Higher Education: Design and Implementation”. IJCSI International Journal of Computer Science Issues, Vol. 8, Issue 4, No 2.
[25] Briffa, Keith R.; Osborn, Timothy J.; Schweingruber, Fritz H.; Harris, Ian C.; Jones, Philip D.; Shiyatov, Stepan G.; Vaganov, Eugene A. (2001). "Low-frequency temperature variations from a northern tree ring density network". Journal of Geophysical Research 106: 2929. doi:10.1029/2000JD900617.
[26] Cheng-Ying Yang, Ah-Fur Lai1 and Chun Chen, Ming-Hsiang Hwang,Cheng-Yi Li. 2012. An Investigation on Procrastination in the E-learning Environment, Information Science and Digital Content Technology (ICIDT), 2012 8th International Conference on Information Systems.Volume (3).No21.
[27] Zhang D., L. Zhou, R.O. Briggs &J.F. Jr. Nunamaker, 2006. “Instructional video in e-learning: Assessing the impact of interactive video on learning effectiveness,” Information & Management, Vol. (43).
[28] Elango, R. Gudep, V. K. and Selvam, M. “Quality of e-Learning: An Analysis Based on e-Learners’ Perception of e-Learning.” The Electronic Journal of e-Learning Volume 6 Issue 1, pp. 31 - 44, available online at www.ejel.org
[29] Fahad N. Al-Fahad. 2009. “Students' Attitudes and Perceptions Towards the Effectiveness of Mobile Learning In King Saud University”. The Turkish Online Journal of Educational Technology – TOJET April 2009. Volume (8) Issue 2 Article 10. [30] Given, Lisa M. 2008. The Sage encyclopedia of qualitative
research methods. Los Angeles, Calif.: Sage Publications. [31] Kathryn C. Dixon and Robert Dixon (2007). Designing quality
e-learning environments in higher education Lou Siragusa, Faculty of Education, Language Studies and Social Work, Curtin University of Technology,Proceedingsascilite Singapore 2007: Full paper: Siragusa, Dixon & Dixon
[32] Pat LeMay Burr, Ph.D., Annette E. Craven, Ph.D. (2009). E-Learning: Creating a High Touch Learning Community with High Tech, 2009 Fourth International Conference on Innovative Computing, Information and Control
[33] Rhema, A. 2005. “Towards flexible learning: Implementing web-based learning in the Data Analysis Department of the Faculty of Economics and Accounting of the “Aljabalalgharbi University” in Gharian
[34] Salem Alkhalaf, Jeremy Nguyen, Anne Nguyen, Steve Drew. 2011. “The potential role of collaborative learning in enhancing e-learning systems: evidence from Libya”. Proceedings Ascilite Journal.
[35] Syed Hussain Ali, Sadiq M. Sait& Khalid M. Al-Tawil.2009. Perceptions about e-Learning in Libya, King Fahd University of Petroleum & Minerals.