comm
en
t
re
v
ie
w
s
re
ports
de
p
o
si
te
d r
e
se
a
rch
refer
e
e
d
re
sear
ch
interacti
o
ns
inf
o
rmation
Optimization and clinical validation of a pathogen detection
microarray
Christopher W Wong
*
, Charlie Lee Wah Heng
†
, Leong Wan Yee
*
,
Shirlena WL Soh
‡
, Cissy B Kartasasmita
§
, Eric AF Simoes
¶
,
Martin L Hibberd
‡
, Wing-Kin Sung
†
and Lance D Miller
*
Addresses: *Genomic Technologies, Genome Institute of Singapore, Republic of Singapore. †Computational and Mathematical Biology, Genome
Institute of Singapore, Republic of Singapore. ‡Infectious Diseases, Genome Institute of Singapore, Republic of Singapore. §Hasan Sadikin
Hospital, Department of Pediatrics, Faculty of Medicine Universitas Padjadjaran, Indonesia. ¶Section of Infectious Diseases, The University of
Colorado at Denver and Health Sciences Center and The Children's Hospital, Denver, CO 80262, USA.
Correspondence: Christopher W Wong. Email: [email protected]
© 2007 Wong et al.; licensee BioMed Central Ltd.
This is an open access article distributed under the terms of the Creative Commons Attribution License (http://creativecommons.org/licenses/by/2.0), which permits unrestricted use, distribution, and reproduction in any medium, provided the original work is properly cited.
Pathogen detection by microarray
<p>New design and optimization of pathogen detection microarrays is shown to allow robust and accurate detection of a range of patho-gens. The customized microarray platform includes a method for reducing PCR bias during DNA amplification.</p>
Abstract
DNA microarrays used as 'genomic sensors' have great potential in clinical diagnostics. Biases inherent in random PCR-amplification, cross-hybridization effects, and inadequate microarray analysis, however, limit detection sensitivity and specificity. Here, we have studied the relationships between viral amplification efficiency, hybridization signal, and target-probe annealing specificity using a customized microarray platform. Novel features of this platform include the development of a robust algorithm that accurately predicts PCR bias during DNA amplification and can be used to improve PCR primer design, as well as a powerful statistical concept for inferring pathogen identity from probe recognition signatures. Compared to real-time PCR, the microarray platform identified pathogens with 94% accuracy (76% sensitivity and 100% specificity) in a panel of 36 patient specimens. Our findings show that microarrays can be used for the robust and accurate diagnosis of pathogens, and further substantiate the use of microarray technology in clinical diagnostics.
Background
Timely, accurate and sensitive detection of infectious disease agents is still difficult today, despite a long history of progress in this area. Traditional methods of culture and antibody-based detection still play a central role in microbiological lab-oratories despite the problems of the delay between disease presentation and diagnosis, the limited number of organisms that can be detected by these approaches, and the 'hit-or-miss' nature of the diagnostic process, which depends on a clinical prediction of the infectious source [1]. Faster diagno-sis of infections would reduce morbidity and mortality, for example, through the earlier implementation of appropriate
antimicrobial treatment. During the past few decades, vari-ous methods have been proposed to achieve this, with those based on nucleic acid detection, including PCR and microar-ray-based techniques, seeming the most promising. These approaches are beginning to rapidly decrease laboratory turnaround times so that results can be available within 2-6 hours compared to perhaps 24 hours. Future developments may see this reduced even further; and through the develop-ment of point-of-care devices, perhaps enable the clinician to make the diagnosis directly at the bed-side [2,3].
Published: 28 May 2007
Genome Biology 2007, 8:R93 (doi:10.1186/gb-2007-8-5-r93)
Received: 26 February 2007 Revised: 26 April 2007 Accepted: 28 May 2007 The electronic version of this article is the complete one and can be
While pathogen microarrays and their utility in discovering emerging infectious diseases such as SARS have been described, technical problems related to accuracy and sensi-tivity of the assay prevent their routine use in patient care [4-9]. For microarrays to become a standard diagnostic tool, the following questions must be addressed: what are the factors that influence probe design and performance? How is a path-ogen 'signature' measured and detected? What is the specifi-city and sensitivity of an optimized detection platform? Can detection algorithms distinguish co-infecting pathogens and closely related viral strains? [10-12].
Noisy signals caused by cross-hybridization artifacts present a major obstacle to the interpretation of microarray data, par-ticularly for the identification of rare pathogen sequences present in a complex mixture of nucleic acids. For example, in clinical specimens, contaminating nucleic acid sequences, such as those derived from the host tissue, will cross-hybrid-ize with pathogen-specific microarray probes above some threshold of sequence complementarity. This can result in false-positive signals that lead to erroneous conclusions. Sim-ilarly, the pathogen sequence, in addition to binding its spe-cific probes, may cross-hybridize with other non-target probes (that is, probes designed to detect other pathogens). This latter phenomenon, though seemingly problematic, could provide useful information for pathogen identification to the extent that such cross-hybridization can be accurately predicted. With various metrics to assess annealing potential and sequence specificity, microarray probes have tradition-ally been designed to ensure maximal specific hybridization (to a known target) with minimal cross-hybridization (to non-specific sequences). However, in practice we have found that many probes, though designed using optimal in silico param-eters, do not perform according to expectations for reasons that are unclear (CW Wong et al., unpublished data).
Here, we report the results of a systematic investigation of the complex relationships between viral amplification efficiency, hybridization signal output, target-probe annealing specifi-city, and reproducibility of pathogen detection using a custom designed microarray platform. Our findings form the basis of a novel methodology for the in silico prediction of pathogen 'signatures', shed light on the factors governing viral amplifi-cation efficiency and demonstrate the important connection between a viral amplification efficiency score (AES) and opti-mal probe selection. Finally, we describe a new statistics-based pathogen detection algorithm (PDA) to link this all together, permitting confident identification of organisms entirely by prediction, and evaluate the entire platform in relation to conventional PCR techniques in a cohort of patients with lower respiratory illness.
Results and discussion
Empirical determination of cross-hybridization thresholds on a pathogen detection microarray
To systematically investigate the dynamics of array-based pathogen detection, we created an oligonucleotide array using Nimblegen array synthesis technology [13]. The array was designed to detect up to 35 RNA viruses using 40-mer probes tiled at an average 8-base resolution across the full length of each genome (53,555 probes; Figure S1 and Table S1 in Additional data file 1). Together with 7 replicates for each viral probe, and control sequences for array synthesis and hybridization (see Materials and methods), the array con-tained a total of 390,482 probes. Initially, we studied virus samples purified from cell lines, reverse-transcribed and PCR-amplified with virus-specific primers (instead of ran-dom primers). This allowed us to study array hybridization dynamics in a controlled fashion, without the complexity of cross-hybridization from human RNA and random annealing dynamics, which occur with random primers. We then applied our findings to clinical samples amplified using ran-dom primers.
comm en t re v ie w s re ports refer e e d re sear ch de p o si te d r e se a rch interacti o ns inf o rmation
MCM measures the number of consecutive bases that are exact matches, with high scores for similar sequences [17,18].
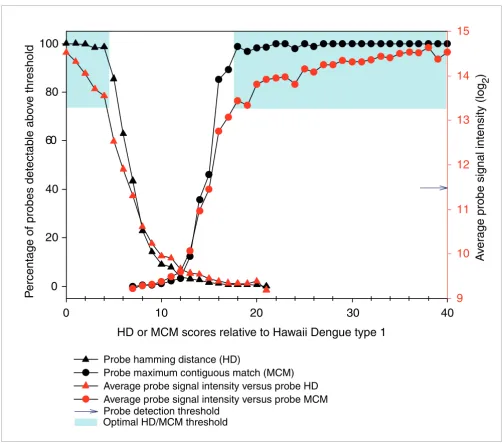
We calculated the HD and MCM scores for every probe rela-tive to the Hawaiian Dengue 1 isolate and observed that these scores correlated negatively (HD) and positively (MCM) with probe signal intensity (Figure 2). All probes on the array with high similarity to the Hawaiian Dengue I genome, that is, HD
≤ 2 (n = 942) or MCM ≥ 27 (n = 627), hybridized with median signal intensity 3 SD above detection threshold. Although 98% of probes were detectable at the low HD range from 0-4, or high MCM range from 18-40, median probe signal inten-sity decreased at every increment of sequence distance (Fig-ure 2). Median signal intensity dropped off sharply to background levels at HD = 7 and MCM = 15, with 43% and 46% detectable probes, respectively. The majority of probes (>96%, n > 51,000) had HD scores between 8 and 21 and/or MCM scores between 0 and 15, of which only 1.23% and 1.57%, respectively, were detectable.
At the optimal similarity thresholds HD ≤ 4 and MCM ≥ 18, >98% of probes could be detected with median signal inten-sity 2 SD above detection threshold, whereas adjusting the similarity threshold down 1 step to HD ≤ 5 and MCM ≥ 17 would result in only approximately 85% probe detection and median signal intensity approximately 1.2 SD above detection threshold (Figure 2). Using these optimal HD and MCM thresholds to guard against cross-hybridization, we binned all probes into specific 'recognition signature probe sets' (that is, r-signatures) most likely to specifically detect a given patho-gen, and we defined r-signatures for each of the 35 pathogen
genomes represented on the array (Table 1). Each pathogen's r-signature comprised tiling probes derived from its genome sequence (HD = 0, MCM = 40), as well as cross-hybridizing probes derived from other pathogens (HD ≤ 4, MCM ≥ 18). According to these criteria, a given probe could belong to multiple different r-signatures, thereby maximizing probe-level evidence for pathogen detection.
We next considered other non-specific hybridization phe-nomena that could affect performance of our r-signature probes. For example, we observed a linear relationship between probe signal and %GC content (data not shown). Consistent with previous observations, we found that probes <40% GC hybridized with diminished signal intensities, while probes with >60% GC content showed higher signal intensi-ties [19,20]. Thus, we censored probes with GC <40% or >60% from the r-signatures, despite optimal HD or MCM val-ues. Furthermore, as cross-hybridization with human sequences could also confound results, we compared all probes to the human genome assembly (build 17) by BLAST using a word size of 15 [21]. Probes with an expectation value of 100 were also censored (Table 1).
While the ideal pathogen r-signature would be one where all probes would hybridize to the target sequence at detectable levels, polymorphic variation between the probes (derived from a consensus sequence) and the actual target would be expected to impede the performance of the r-signature probes at some level. To test this hypothesis, we compared the ratios of detectable to undetectable probes across all r-signatures in the context of the hybridization involving the Hawaiian Den-gue 1 isolate. Although the DenDen-gue 1 sequence used to derive the Dengue 1 r-signature was approximately 5% different from the Hawaiian isolate, the detectable probe ratio of the Dengue 1 specific probes was 151/152 (99%), 12 times higher then that for the nearest Dengue serotype signature, suggest-ing that moderate polymorphic variation is quite tolerable, allowing, in this case, for discernment of the correct pathogen.
Predicting genome-wide amplification bias
Random priming amplification, rather than primer-specific amplification, is preferred for identifying unknown patho-gens in clinical specimens. However, in initial experiments using random priming amplification to identify known path-ogens, we frequently observed incomplete hybridization of the pathogen genome marked by interspersed genomic regions not detected by the probes. An example involving the amplification of respiratory syncytial virus (RSV) B from a human nasopharyngeal aspirate is shown in Figure 3. In pre-liminary analyses, sequence polymorphisms, probe GC con-tent and genome secondary structure failed to explain this phenomenon, suggesting that it might result from a PCR-based amplification bias stemming from differential abilities of the random primers to bind to the viral genome at the reverse transcription (RT) step. The random primer used in
[image:3.612.53.297.86.299.2]Heatmap of microarray probe signal intensities
Figure 1
Heatmap of microarray probe signal intensities. Cells corresponding to probes are aligned in genomic order and colored according to the signal intensity-color scales shown. Hybridization signatures corresponding to (a) SARS Sin850 or (b) Dengue 1 Hawaiian isolate are shown.
our experiments was a 26-mer composed of a random non-amer (3') tagged with a fixed 17-mer sequence (5'-GTTTC-CCAGTCACGATA) [4,9,22]. Intra-primer secondary structure formation, such as dimer and hairpin formation between the 17-mer tag and nonamer, and probe melting tem-perature are known to influence binding efficiency [23,24]. To explore our hypothesis, we designed an algorithm to model the RT-PCR process using experimental data (see Additional data file 1 for details). Briefly, it calculates the probability that a 500-1,000 base-pair product (average size range of PCR product) can be generated from each possible starting position in the genome assuming that a nonamer in the random primer mix will complement the viral sequence
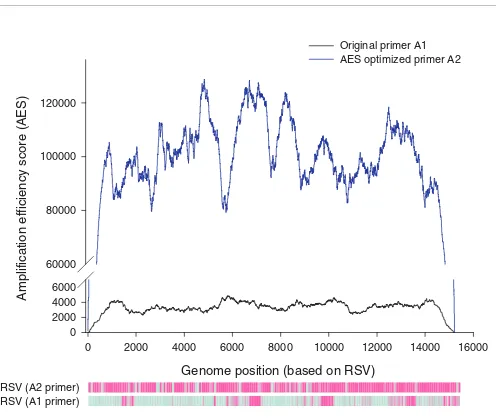
perfectly. This probability is reduced when intra-primer hair-pin formation is predicted, and increased according to degree of complementarity between tag sequence and viral sequence. In this manner, the probability that each nucleotide will be successfully PCR-amplified is reflected in its AES (see supple-mental methods in Additional data file 1 and [25]). To vali-date the algorithm, we ranked the hybridization signal intensities for all 1,948 probes tiled across the RSV B genome and compared them to their AES values (Figure 3). We observed that high AES significantly correlates to probe hybridization signal intensity above the detection threshold (P = 2.2 × 10⁻¹⁶; Fisher's exact test). In another experiment involving a patient sample positive for metapneumovirus
[image:4.612.56.558.82.526.2]Relationship between probe HD, probe MCM and probe signal intensity
Figure 2
Relationship between probe HD, probe MCM and probe signal intensity. Average probe signal intensity and percentage of detectable probes (signal intensity > mean + 2 SD) decreases as HD increases and MCM decreases. The optimal cross-hybridization thresholds HD ≤ 4 or MCM ≥ 18, where >98% of probes can be detected, is shaded in blue.
HD or MCM scores relative to Hawaii Dengue type 1
0
10
20
30
40
P
ercentage of probes detectab
le abo
v
e threshold
0
20
40
60
80
100
A
v
er
age probe signal intensity (log
2
)
9
10
11
12
13
14
15
Probe hamming distance (HD)
Probe maximum contiguous match (MCM)
Average probe signal intensity versus probe HD
Average probe signal intensity versus probe MCM
Probe detection threshold
comm
en
t
re
v
ie
w
s
re
ports
refer
e
e
d
re
sear
ch
de
p
o
si
te
d r
e
se
a
rch
interacti
o
ns
inf
o
rmation
(hMPV), the probes tiled across the hMPV genome showed a similar result, P = 1.3 × 10⁻⁹. Repeatedly, we observed that higher AES correlated with greater probe detection, with, on average, >70% detection for probes in the top 20% AES (see supplemental methods in Additional data file 1).
While HD, MCM, %GC and sequence uniqueness were valua-ble parameters for probe selection, they did not take into account PCR bias, and were insufficient predictors of probe performance when considered in the absence of AES (Figure
4). We found that using only the probes within the top 20% AES (Table 1) substantially improved the efficacy of our pre-diction algorithm (discussed in the following section). In total, after applying all probe selection criteria, the r-signa-tures utilized 9,768 of the >50,000 unique probes initially included on the array.
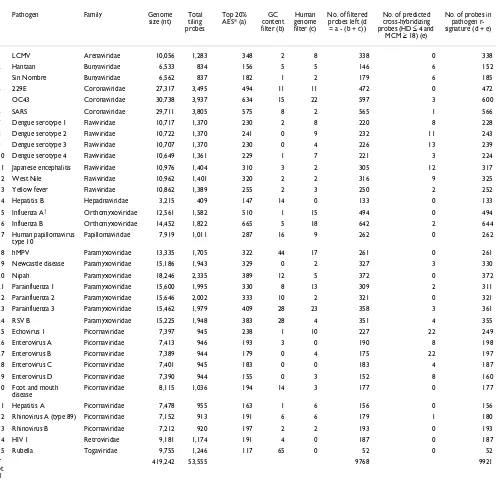
[image:5.612.57.553.116.601.2]We next hypothesized that amplification efficiency scoring could be used to select an optimal tag sequence (that is, for the RT-PCR primers) for achieving uniformly high AES Table 1
Binning of probes into specific pathogen signature probe sets
Pathogen Family Genome
size (nt) Total tiling probes
Top 20% AES* (a)
GC content filter (b)
Human genome filter (c)
No. of filtered probes left (d = a - (b + c))
No. of predicted cross-hybridizing probes (HD ≤ 4 and
MCM ≥ 18) (e)
No. of probes in pathogen r-signature (d + e)
1 LCMV Arenaviridae 10,056 1,283 348 2 8 338 0 338
2 Hantaan Bunyaviridae 6,533 834 156 5 5 146 6 152
3 Sin Nombre Bunyaviridae 6,562 837 182 1 2 179 6 185
4 229E Coronaviridae 27,317 3,495 494 11 11 472 0 472
5 OC43 Coronaviridae 30,738 3,937 634 15 22 597 3 600
6 SARS Coronaviridae 29,711 3,805 575 8 2 565 1 566
7 Dengue serotype 1 Flaviviridae 10,717 1,370 230 2 8 220 8 228
8 Dengue serotype 2 Flaviviridae 10,722 1,370 241 0 9 232 11 243
9 Dengue serotype 3 Flaviviridae 10,707 1,370 230 0 4 226 13 239
10 Dengue serotype 4 Flaviviridae 10,649 1,361 229 1 7 221 3 224
11 Japanese encephalitis Flaviviridae 10,976 1,404 310 3 2 305 12 317
12 West Nile Flaviviridae 10,962 1,401 320 2 2 316 9 325
13 Yellow fever Flaviviridae 10,862 1,389 255 2 3 250 2 252
14 Hepatitis B Hepadnaviridae 3,215 409 147 14 0 133 0 133
15 Influenza A† Orthomyxoviridae 12,561 1,582 510 1 15 494 0 494
16 Influenza B Orthomyxoviridae 14,452 1,822 665 5 18 642 2 644
17 Human papillomavirus type 10
Papillomaviridae 7,919 1,011 287 16 9 262 0 262
18 hMPV Paramyxoviridae 13,335 1,705 322 44 17 261 0 261
19 Newcastle disease Paramyxoviridae 15,186 1,943 329 0 2 327 3 330
20 Nipah Paramyxoviridae 18,246 2,335 389 12 5 372 0 372
21 Parainfluenza 1 Paramyxoviridae 15,600 1,995 330 8 13 309 2 311
22 Parainfluenza 2 Paramyxoviridae 15,646 2,002 333 10 2 321 0 321
23 Parainfluenza 3 Paramyxoviridae 15,462 1,979 409 28 23 358 3 361
24 RSV B Paramyxoviridae 15,225 1,948 383 28 4 351 4 355
25 Echovirus 1 Picornaviridae 7,397 945 238 1 10 227 22 249
26 Enterovirus A Picornaviridae 7,413 946 193 3 0 190 8 198
27 Enterovirus B Picornaviridae 7,389 944 179 0 4 175 22 197
28 Enterovirus C Picornaviridae 7,401 945 183 0 0 183 4 187
29 Enterovirus D Picornaviridae 7,390 944 155 0 3 152 8 160
30 Foot and mouth disease
Picornaviridae 8,115 1,036 194 14 3 177 0 177
31 Hepatitis A Picornaviridae 7,478 955 163 1 6 156 0 156
32 Rhinovirus A (type 89) Picornaviridae 7,152 913 191 6 6 179 1 180
33 Rhinovirus B Picornaviridae 7,212 920 197 2 2 193 0 193
34 HIV 1 Retroviridae 9,181 1,174 191 4 0 187 0 187
35 Rubella Togaviridae 9,755 1,246 117 65 0 52 0 52
T ot al
419,242 53,555 9768 9921
*AES scores for all tiling probes were ranked together and only those probes in the top 20th percentile were retained. †Segment 7 of Influenza A was omitted during probe
across viral genomes, thus globally maximizing PCR effi-ciency (see supplemental methods in Additional data file 1 and [25]). Briefly, we generated 10,000 primer sequences, eliminated those that formed self-dimers, and calculated AES for every genome based on each candidate primer tag. Primer A2, which had the highest average AES for all 35 viruses present on the array, was selected as the 'AES-optimized' primer. In a comparative study of eight patient samples (five RSV, three hMPV), we observed that primer A2 showed a marked improvement in overall PCR efficiency in amplifying both RSV and hMPV over the original primer, A1 (Figures S2 and S3 in Additional data file 1). The increased PCR efficiency contributed to increased hybridization of DNA to the probes, and is reflected in the uniformly higher signal intensities observed using primer A2. Consequently, >70% of viral
probes had signal intensities above detection threshold when using primer A2, compared to approximately 20% using primer A1 (Anova test, P = 0.00026; Figure S3 in Additional data file 1).
PDA: an algorithm for detecting pathogens
We observed that while the signal intensities for all pathogen r-signatures approximate a normal distribution, a large pro-portion of probes comprising the signature of a detectable pathogen have relatively strong signal intensities resulting in a right-skewed distribution (Figure 5a). We reasoned that analysis of the tails of the signal intensity distributions for each r-signature might better enable not only the identifica-tion of an infecting pathogen, but also the presence of co-infecting pathogens in the same sample. Thus, we devised a
[image:6.612.60.556.82.500.2]Measurement and application of AES
Figure 3
Measurement and application of AES. An RSV patient sample was amplified using original primer A1 (black line), or AES-optimized primer (blue line). The probes that have detectable signal above threshold are shown in purple in the corresponding heatmaps. For primer A1, the detectable regions correspond to regions that have higher AES scores than undetectable regions.
Genome position (based on RSV)
0
2000
4000
6000
8000
10000
12000
14000
16000
Amplification efficiency score (AES)
0
2000
4000
6000
60000
80000
100000
120000
Original primer A1
AES optimized primer A2
comm
en
t
re
v
ie
w
s
re
ports
refer
e
e
d
re
sear
ch
de
p
o
si
te
d r
e
se
a
rch
interacti
o
ns
inf
o
rmation
robust statistics-based PDA that analyzes the distribution of probe signal intensities relative to the in silico r-signatures (see supplemental methods in Additional data file 1 and [25]). The PDA software comprises two parts: evaluation of signal intensity of probes in each pathogen r-signature using a modified Kullback-Leibler Divergence (KL); and statistical analysis of modified KL scores using the Anderson-Darling test.
Since the original KL cannot reliably determine differences in the tails of a probability distribution, and is highly dependent on the number of probes per genome and the size of each sig-nal intensity bin, we incorporated the Anderson-Darling sta-tistic to give more weight to the tails of each distribution. By using a cumulative distribution function instead of the origi-nal probability distribution, the p value generated is inde-pendent of the binning criteria, eliminating errors that occur if a particular signal intensity bin is empty [26,27]. We call our modified KL divergence the 'weighted Kullback-Leibler divergence' (WKL):
where Qa(j) is the cumulative distribution function of the sig-nal intensities of the probes in Pa found in bin bj ; is the
cumulative distribution function of the signal intensities of
the probes in found in bin bj. R-signatures representing absent pathogens should have normal signal intensity distri-butions and thus relatively low WKL scores, whereas those representing present pathogens should have high, statisti-cally significant outlying WKL scores (Figure 5b). In the
[image:7.612.303.555.85.364.2]sec-Effects of probe filtering criteria on r-signature probe detection
Figure 4
Effects of probe filtering criteria on r-signature probe detection. The 1,948 probes tiled across the RSV B genome were binned according to different filtering criteria and plotted against the percentage of probes with detectable signal. Measurements reflect the average of five experiments.
No filter ing
HDM CM only
Top 20% AES
Top 20% AES
+ HDM CM
Top 10% AES
Top 10% AES + H
DMCM
P
ercentage probes abo
v
e signal intensity detection threshold
40 45 50 55 60 65 70
Distribution of probe signal intensities and WKL scores
Figure 5
Distribution of probe signal intensities and WKL scores. RNA isolated from a RSV-infected patient was hybridized onto the array. (a) Distribution of probe signal intensities of all 53,555 probes (red) and r-signature probes for an absent pathogen, for example, parainfluenza-1 (dotted line), show a normal distribution. The distribution of signal intensity for RSV r-signature probes are positively skewed, with higher signal intensities in the tail of the distribution. (b) Distribution frequency of WKL scores for the 35 pathogen r-signatures with the majority ranging between -5 and 3. A non-normal WKL score distribution is observed (P < 0.05 by Anderson Darling test). The presence of a pathogen is indicated by a non-normal distribution caused by outlier WKL = 17, corresponding to RSV. Excluding the RSV r-signature WKL score results in a normal distribution. From this computation, we conclude that RSV is present in the hybridized sample.
Log2 signal intensity
8 9 10 11 12 13 14 15 16
Number of probes
0 100 200 300 400 500
Number of probes (all non-RSV)
0 2,000 4,000 6,000 8,000 10,000 12,000
RSV Parainfluenza-1 All probes except RSV
-5 0 5 10 15 20 0.00
0.05 0.10 0.15 0.20 0.25 0.30
F
requency
WKL scores
(a)
(b)
WKL P
Q j Q j
Q j
Q j Q j
a
a a
a
a a
j k
( | )
( ) ( ( )
( ))
( ) ( )
Pa =
−
⎢⎣ ⎥⎦
= −
∑
log
1
0 1
Q ja( )
[image:7.612.56.298.87.402.2]ond part of PDA, the distribution of WKL scores is subjected to an Anderson-Darling test for normality. If P < 0.05, the
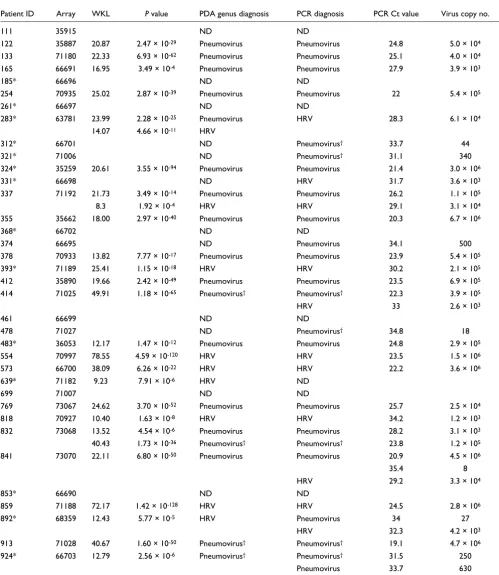
WKL distribution is considered not normal, implying that the pathogen with an outlying WKL score is present. Upon iden-Table 2
Comparison of microarray and real-time PCR performance in detection of pathogen genera (HRV, pneumovirus)
Patient ID Array WKL P value PDA genus diagnosis PCR diagnosis PCR Ct value Virus copy no.
111 35915 ND ND
122 35887 20.87 2.47 × 10⁻²⁹ Pneumovirus Pneumovirus 24.8 5.0 × 10⁴
133 71180 22.33 6.93 × 10-62 Pneumovirus Pneumovirus 25.1 4.0 × 10⁴
165 66691 16.95 3.49 × 10⁻⁴ Pneumovirus Pneumovirus 27.9 3.9 × 10³
185* 66696 ND ND
254 70935 25.02 2.87 × 10-39 Pneumovirus Pneumovirus 22 5.4 × 10⁵
261* 66697 ND ND
283* 63781 23.99 2.28 × 10⁻²⁵ Pneumovirus HRV 28.3 6.1 × 10⁴
14.07 4.66 × 10⁻¹¹ HRV
312* 66701 ND Pneumovirus† 33.7 44
321* 71006 ND Pneumovirus† 31.1 340
324* 35259 20.61 3.55 × 10-94 Pneumovirus Pneumovirus 21.4 3.0 × 10⁶
331* 66698 ND HRV 31.7 3.6 × 10³
337 71192 21.73 3.49 × 10⁻¹⁴ Pneumovirus Pneumovirus 26.2 1.1 × 10⁵
8.3 1.92 × 10⁻⁴ HRV HRV 29.1 3.1 × 10⁴
355 35662 18.00 2.97 × 10-40 Pneumovirus Pneumovirus 20.3 6.7 × 10⁶
368* 66702 ND ND
374 66695 ND Pneumovirus 34.1 500
378 70933 13.82 7.77 × 10⁻¹⁷ Pneumovirus Pneumovirus 23.9 5.4 × 10⁵
393* 71189 25.41 1.15 × 10⁻¹⁸ HRV HRV 30.2 2.1 × 10⁵
412 35890 19.66 2.42 × 10-49 Pneumovirus Pneumovirus 23.5 6.9 × 10⁵
414 71025 49.91 1.18 × 10-65 Pneumovirus† Pneumovirus† 22.3 3.9 × 10⁵
HRV 33 2.6 × 10³
461 66699 ND ND
478 71027 ND Pneumovirus† 34.8 18
483* 36053 12.17 1.47 × 10⁻¹² Pneumovirus Pneumovirus 24.8 2.9 × 10⁵
554 70997 78.55 4.59 × 10-120 HRV HRV 23.5 1.5 × 10⁶
573 66700 38.09 6.26 × 10⁻²² HRV HRV 22.2 3.6 × 10⁶
639* 71182 9.23 7.91 × 10⁻⁶ HRV ND
699 71007 ND ND
769 73067 24.62 3.70 × 10-52 Pneumovirus Pneumovirus 25.7 2.5 × 10⁴
818 70927 10.40 1.63 × 10⁻⁸ HRV HRV 34.2 1.2 × 10³
832 73068 13.52 4.54 × 10⁻⁶ Pneumovirus Pneumovirus 28.2 3.1 × 10³
40.43 1.73 × 10-36 Pneumovirus† Pneumovirus† 23.8 1.2 × 10⁵
841 73070 22.11 6.80 × 10-50 Pneumovirus Pneumovirus 20.9 4.5 × 10⁶
35.4 8
HRV 29.2 3.3 × 10⁴
853* 66690 ND ND
859 71188 72.17 1.42 × 10-128 HRV HRV 24.5 2.8 × 10⁶
892* 68359 12.43 5.77 × 10⁻⁵ HRV Pneumovirus 34 27
HRV 32.3 4.2 × 10³
913 71028 40.67 1.60 × 10-50 Pneumovirus† Pneumovirus† 19.1 4.7 × 10⁶
924* 66703 12.79 2.56 × 10⁻⁶ Pneumovirus† Pneumovirus† 31.5 250
Pneumovirus 33.7 630
[image:8.612.57.556.118.693.2]comm
en
t
re
v
ie
w
s
re
ports
refer
e
e
d
re
sear
ch
de
p
o
si
te
d r
e
se
a
rch
interacti
o
ns
inf
o
rmation
tification of a pathogen, that pathogen's WKL score is left out, and a separate Anderson-Darling test is performed to test for the presence of co-infecting pathogens. In this manner, the procedure is iteratively applied until only normal distribu-tions remain (that is, P > 0.05). The PDA algorithm is extremely fast, capable of making a diagnosis from a hybrid-ized microarray in less than 10 seconds.
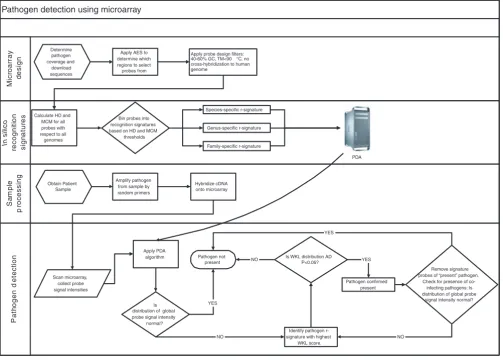
Microarray performance on clinical specimens
To assess the clinical utility of the pathogen prediction plat-form, we analyzed 36 nasal wash specimens according to the workflow illustrated in Figure 6. These specimens were obtained from children under 4 years of age with lower respi-ratory tract infections (LRTI), of which 14 were hospitalized for severe disease and 22 with ambulatory LRTI. The clinical diagnosis of these patients was bronchiolitis or pneumonia. All 36 specimens had been previously analyzed for the pres-ence of hMPV, and RSV A and B using real-time PCR. Twenty-one specimens tested positive for one or more viruses, while fifteen were PCR-negative for all three. All
specimens were analyzed by microarray in a blinded fashion (Table 2).
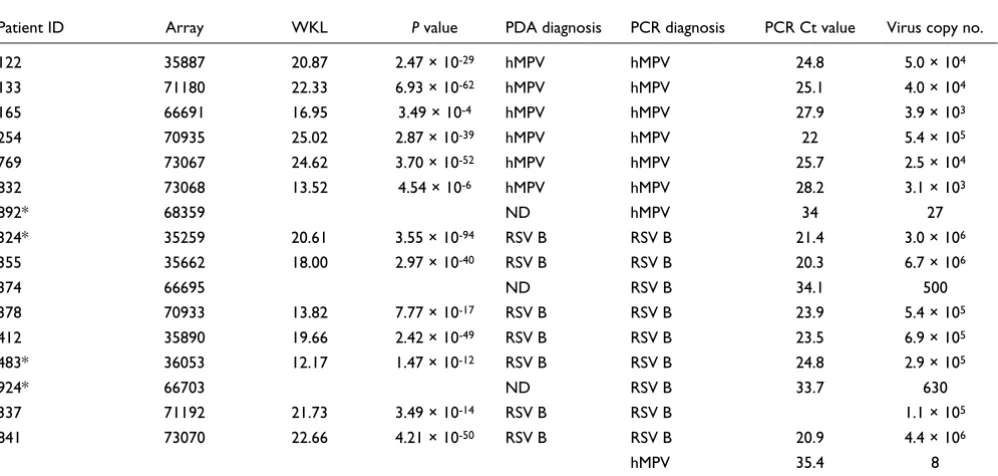
As the RSV A full-genome sequence has not been published, our array was not designed to specifically detect this virus. Thus, we first assessed array performance using only results from the 16 patients diagnosed with either hMPV or RSV B by PCR (Table 3). Of this cohort, the microarray correctly detected the presence of hMPV or RSV B in 13/16 samples. This corresponds to an assay specificity of 100%, sensitivity of 76%, and diagnostic accuracy of 94%. All 4 false negative samples (patients 374, 841, 892, and 924) had Ct values >33.5, which is near the detection limit of real-time PCR, and thus perhaps beyond the range of detection by microarray.
We next assessed array performance in the group of patients PCR-positive for RSV A (n = 7) and PCR-negative for all tested viruses (n = 15). The microarray made only two positive calls in this group, both for RSV B. Interestingly, both RSV B calls corresponded to high-titre RSV A specimens by PCR (patients 414 and 913), suggesting that certain probe sets can
[image:9.612.55.558.88.447.2]Schema of pathogen detection process
Figure 6
Schema of pathogen detection process. AD, Anderson-Darling. Pathogen detection using microarray
In
si
li
co
rec
o
gni
ti
on
s
ign
at
ur
es
Sa
m
p
le
p
roc
es
s
ing
P
a
th
ogen d
e
te
c
tion
M
ic
roar
ray
de
s
ig
n
Calculate HD and MCM for all probes with respect to all genomes
Apply AES to determine which regions to select probes from
Apply probe design filters: 40-60% GC, TM<90 °C, no cross-hybridization to human genome
Bin probes into recognition signatures based on HD and MCM
thresholds
Species-specific r-signature
Family-specific r-signature Genus-specific r-signature
Obtain Patient Sample
Amplify pathogen from sample by random primers
Hybridize cDNA onto microarray
Scan microarray, collect probe signal intensities
Apply PDA algorithm
Is distribution of global probe signal intensity
normal?
Identify pathogen r-signature with highest
WKL score.
Remove signature probes of “present” pathogen.
Check for presence of co-infecting pathogens: Is distribution of global probe
signal intensity normal? YES
NO
Is WKL distribution AD P<0.05? NO
Pathogen confirmed present
YES YES
NO Pathogen not
present Determine
pathogen coverage and
download sequences
detect the presence of related, but unspecified, viruses. Anal-ysis of the published RSV A partial genome sequence (923 bp, Genbank ID: AF516119) revealed that 7 probes on our micro-array had 100% identity to RSV A. We created an 'RSV A r-signature' comprising these 7 probes, enabling the specific detection of RSV A by microarray in 4/7 patient samples PCR-positive for RSV A (patients 414, 832, 913, and 924). Although the performance of this small r-signature was not as robust as the other virus r-signatures (median size: 249 probes), it sug-gested that it was feasible to pursue a 'viral discovery' approach using r-signatures created to detect viruses at the family or genus level that were related to those species already represented on the microarray. Specifically, we binned probes into family- or genus-level r-signatures by relaxing our similarity criteria (to HD ≤ 5 or MCM ≥ 25) and selecting probes common to genome sequences within families and genera for the picornaviridae family, paramyxoviridae family, rhinovirus genus (HRV) and pneumovirus genus (inclusive of RSV and hMPV).
Upon re-analysis of all 36 samples, we identified the presence of pneumovirus in 17 specimens as expected (1 false positive, patient 283), and additionally detected the presence of HRV in 9 specimens (Table 2). As HRV was a novel discovery, we re-screened all 36 samples by PCR and found HRV in 11 spec-imens. All nine HRV calls by microarray were confirmed by PCR except for one. This finding was intriguing given that the genomic diversity of the over 100 known rhinovirus serotypes makes detection by PCR notoriously difficult [28]. As the real-time PCR primers were capable of identifying only approximately 70% of rhinovirus strains, it is possible that
the microarray correctly detected a rhinovirus strain that PCR failed to detect. Similarly, the pneumovirus genus detected in patient 283 could not be verified by RT-PCR, possibly owing to subtle genetic variations that prevented primer annealing. Thus, the greater genomic coverage afforded by the microar-ray might, in some cases, provide a more sensitive and accu-rate detection capability than pathogen-specific PCR.
Though the microarray identified the majority of HRV and RSV A samples using the genus-level r-signatures, it failed to detect three samples positive for HRV and three positive for RSV A by real-time PCR. These false negatives had an average Ct value >32, again suggesting a detection threshold close to that of real-time PCR. However, that the microarray also made a number of accurate discoveries in the 30-35 Ct range suggests a considerable degree of detection variability in the titre range above an approximately 30 Ct equivalency. Nota-bly, the microarray correctly detected the presence of co-infecting pathogens in two samples (337 and 832), demon-strating the unique potential of this microarray platform to reveal complex disease etiologies.
Alternative methods of array design and pathogen detection
[image:10.612.59.558.118.356.2]Though pathogen detection by microarray is a young field, a number of different platforms and approaches have been described, each with important attributes. For example, the array described by Wang et al. [9] is based on probes designed to recognize the most conserved viral domains, facilitating the detection of a taxonomic fingerprint that provides power-ful clues to viral identity with minimal probe usage. Lin et al. Table 3
Comparison of microarray and real-time PCR performance in detecting RSV B or hMPV
Patient ID Array WKL P value PDA diagnosis PCR diagnosis PCR Ct value Virus copy no.
122 35887 20.87 2.47 × 10⁻²⁹ hMPV hMPV 24.8 5.0 × 10⁴
133 71180 22.33 6.93 × 10-62 hMPV hMPV 25.1 4.0 × 10⁴
165 66691 16.95 3.49 × 10⁻⁴ hMPV hMPV 27.9 3.9 × 10³
254 70935 25.02 2.87 × 10-39 hMPV hMPV 22 5.4 × 10⁵
769 73067 24.62 3.70 × 10-52 hMPV hMPV 25.7 2.5 × 10⁴
832 73068 13.52 4.54 × 10⁻⁶ hMPV hMPV 28.2 3.1 × 10³
892* 68359 ND hMPV 34 27
324* 35259 20.61 3.55 × 10-94 RSV B RSV B 21.4 3.0 × 10⁶
355 35662 18.00 2.97 × 10-40 RSV B RSV B 20.3 6.7 × 10⁶
374 66695 ND RSV B 34.1 500
378 70933 13.82 7.77 × 10⁻¹⁷ RSV B RSV B 23.9 5.4 × 10⁵
412 35890 19.66 2.42 × 10-49 RSV B RSV B 23.5 6.9 × 10⁵
483* 36053 12.17 1.47 × 10⁻¹² RSV B RSV B 24.8 2.9 × 10⁵
924* 66703 ND RSV B 33.7 630
337 71192 21.73 3.49 × 10⁻¹⁴ RSV B RSV B 1.1 × 10⁵
841 73070 22.66 4.21 × 10-50 RSV B RSV B 20.9 4.4 × 10⁶
hMPV 35.4 8
comm
en
t
re
v
ie
w
s
re
ports
refer
e
e
d
re
sear
ch
de
p
o
si
te
d r
e
se
a
rch
interacti
o
ns
inf
o
rmation
[8], on the other hand, described a probe-dense resequencing array capable of detecting a smaller set of predefined patho-gens, but with higher detection specificity, including the abil-ity to discern highly related subtypes. The microarray described herein represents a blend of these two concepts, integrating a probe tiling approach for substantial genomic coverage (though with lower probe density than a resequenc-ing array), with a taxonomy-based strategy for binnresequenc-ing probes into pathogen recognition signatures. Thus, our analytical output includes both family- and genus-level predictions (for r-signatures restricted to conserved probes) as well as spe-cies-specific predictions (for r-signatures composed of con-served and unique probes). Indeed, this capability allowed us to detect and accurately identify viruses in clinical samples (Table 2).
Central to pathogen prediction are the algorithms that weigh the microarray data against pre-defined recognition signatures. Unfortunately, few such algorithms exist, and only one algorithm, E-Predict, has been reported and vali-dated [5,29,30]. E-Predict matches hybridization signatures with predicted pathogen signatures derived from the theoret-ical free energy of hybridization for each microarray probe. To examine the performance of E-predict on our microarray platform, we analyzed a number of samples with both E-pre-dict and our PDA algorithm. When applied to our microarray data, E-Predict performed well, with its first prediction tend-ing to be the correct one (Table S2 in Additional data file 1). However, for each specimen, a number of false positive calls were also made, which seemed to reflect species with considerable sequence similarity to the true infecting patho-gen (Table S2 in Additional data file 1). For example, in patient sample 412, E-Predict detected RSV (the correct path-ogen), but also multiple species of coronavirus (which share some sequence similarity with RSV), yet real-time PCR using pancoronavirus primers as well as primers specific for strains OC43 and 229E indicated the absence of coronavirus from this sample (Figure S4 in Additional data file 1). These false positive calls can be explained by the fact that the function of E-Predict is less geared towards identifying and distinguish-ing specific pathogen strains, and aimed more at elucidatdistinguish-ing the best possible candidates as supported by the available probes. Thus, E-Predict is particularly advantageous in situa-tions where a pathogen's sequence is not fully known [5]. In contrast, our PDA algorithm is designed to make calls with greater species-level resolution. A major strength of PDA is its ability to specifically identify sequence-characterized and co-infecting pathogens with low false positivity. This is aptly demonstrated by the ability of PDA to detect specifically the presence of Dengue 1 in the clinical sample, where 7/35 viruses on the array are from the Flaviviridae family, includ-ing 4 dengue serotypes that share 70% sequence homology. The benefits of using both algorithms simultaneously for detecting both known and novel pathogens should be further evaluated.
An important discovery in this study was that the composi-tion of the random primer tag has a significant impact on the efficiency of viral genome amplification, as assessed by an amplification efficiency score. The measurement of amplifi-cation efficiency allowed us to predict which probes would provide the most informative recognition signatures, mark-edly improving our pathogen prediction capability. Moreo-ver, this finding allowed us to design AES-optimized primers that increased the amplification efficiency of our samples, resulting in greater sensitivity of pathogen detection. Whether multiplex RT-PCR using a variety of AES-designed primer tags can further increase amplification efficiency war-rants further investigation. Additionally, it is feasible that other tag-based PCR applications, such as the generation of DNA libraries and enrichment of RNA for resequencing, may benefit from primer optimization using the AES algorithm.
DNA microarrays have the potential to revolutionize clinical diagnostics through their ability to simultaneously investi-gate thousands of potential pathogens in order to make a diagnosis. However, questions remain regarding their sensi-tivity and reliability. In this work, we investigated the myriad factors that influence microarray performance in the context of virus detection in clinical specimens, and describe an opti-mized platform capable of identifying individual and co-infecting viruses with high accuracy and sensitivity that brings microarray technology closer to the clinic. Future improvements will include significant reductions in microar-ray manufacturing and usage costs. Multiplex microarmicroar-ray for-mats and 're-usable' arrays are developing technologies that promise to drive down these costs. Furthermore, alternative technologies, such as beads [31], microfluidics [32,33] and nanotube microarrays [34], might provide advantages in both assay cost and speed relative to traditional microarray plat-forms. Technology considerations aside, the advantages of a highly parallel, nucleic acid-based screening approach for detecting disease pathogens are clear. Validations in larger patient cohorts and in diverse clinical settings will be an important next step towards establishing the clinical role of pathogen detection microarrays.
Materials and methods
Microarray synthesis
plant virus, PMMV (negative control). In total, 390,482 probes were synthesized on the array.
Sample preparation, microarray hybridization and staining
Dengue (ATCC #VR-1254) was cultured as per ATCC recom-mendations and Sin850 SARS was cultured as described [36]. Clinical specimens (nasopharyngeal washes) were obtained from an Indonesian pediatric population using a standard-ized WHO protocol as described [37]. The patients were all aged between 0 and 48 months, showed symptoms of LRTI, and were diagnosed with bronchiolitis or pneumonia when they visited the clinic between February 1999 and February 2001. Of these patients, 14 were subsequently hospitalized. The samples were stored at -80°C in RNAzol (Leedo Medical Laboratories, Inc., Friendswood, TX, USA). RNA was later extracted from samples with RNAzol according to the manu-facturer's instructions [38,39], resuspended in RNA storage solution (Ambion, Inc., Austin, TX, USA) and frozen at -80°C until further use. A detailed protocol is provided in the sup-plemental methods in Additional data file 1. Briefly, RNA was reverse transcribed to cDNA using tagged random primers as described [9,40]. The original primer A1 was 5' GTTTC-CCAGTCACGATANNNNNNNNN; and the AES-optimized primer A2 was 5' GATGAGGGAAGATGGGGNNNNNNNNN. The cDNA was then amplified by random PCR, fragmented, end-labeled with biotin, hybridized onto the microarray and stained as previously described [19] with 1 exception: the addition of 0.82 M tetramethylammonium chloride (TMAC) to Nimblegen's hybridization buffer to minimize nonspecific hybridization.
Real-time PCR for clinical samples
A 20 μl reaction mixture containing 2 μl of the purified patient RNA, 5 U of MuLV reverse transcriptase, 8 U of recombinant RNase inhibitor, 10 μl of 2X universal PCR Mas-ter Mix with no UNG (all from Applied Biosystems, FosMas-ter City, CA, USA) was combined with 0.9 μM primer and 0.2 μM (RSV B and hMPV), 0.3 μM (HRV) or 0.5 μM (RSV A) probe. The primers and probe sequences for hMPV were: 5'-AGCAAAGCAGAAAGTTTA TTCGTTAA-3'; 5'-ACCCCCCAC-CTCAGCATT-3'; and 5'-FAM-ATTCATGCAA GCTTATGGT-GCTGGTCAAA-TAMRA-3'. Primers and probes for RSV [41] and HRV [42] have been described. Samples underwent reverse transcription at 48°C for 30 minutes, then were heated at 95°C for 10 minutes and amplified by 40 cycles of 15 s at 95°C and 1 minute at 60°C on an ABI Prism 7900HT Sequence Detection System (Applied Biosystems). During amplification, fluorescence emissions were monitored at every thermal cycle. The threshold (Ct) represents the cycle at which significant fluorescence is first detected. Ct value was converted to copy number using a control plasmid of known concentration: RSV A, 5.06 × 10⁹ copies had a Ct value of 10.469; RSV B, 2.61 × 10⁹ copies had a Ct value of 11.897; hMPV, 7.51 × 10⁹ copies had a Ct value of 10.51; HRV, 1.73 × 10⁷ copies had a Ct value of 20.20.
One-step real-time PCR for coronavirus
Frozen live cultures of human coronavirus OC43 and 229E were purchased from ATCC (Cat #VR-1558, VR-740) for use as positive controls. RNA was extracted from these cultures using RNA Mini Kit (Qiagen, Hilden, Germany) in accord-ance with the manufacturer's instructions. The samples were amplified using diagnostic primer pairs for pancoronavirus, OC43 and 229E as previously described [43].
Data analysis
Microarrays were scanned at 5 μm resolution using an Axon 4000b scanner and Genepix 4 software (Molecular Devices, Sunnyvale, CA, USA). Signal intensities were extracted using Nimblescan 2.1 software (NimbleGen Systems, Madison, WI, USA). Using an automated script (J George and V Vega), we calculated the median signal intensity and standard deviation from the seven replicates of each probe. The probe signal intensities were sorted by genome and arranged in sequence order, then reformatted into CDT format for graphical view-ing of signal intensities in Java Treeview [44]. In parallel, the probe median signal intensities were analyzed using PDA to determine which pathogen was present, and the associated confidence level of prediction. The AES and PDA algorithms are described in detail in the Results section and all algo-rithms, formulae, software and microarray data are available on the supplemental website [25] and in Additional data file 1.
Additional data files
The following additional data are available with the online version of this paper. Additional data file 1 includes supple-mentary materials and methods, figures, tables, pathogen microarray data and software.
Additional data file 1
Supplementary materials and methods, figures, tables, pathogen microarray data and software
All files are available for download in PDF, JPG, GIF, TIFF, HTML or ZIP formats as indicated on the webpage [25]. Supplementary methods: sample amplification and microarray protocols (PDF); RT-PCR modeling and amplification efficiency score (AES); patho-gen detection algorithm (PDA). Supplementary figures. Figure S1: Probe design schema. Probes (40-mers) were tiled at an average 8-base resolution across each of the 35 viral genomes in the manner depicted above. Numbers represent the start and end positions of each probe. Figure S2: Choice of primer tag in random RT-PCR has significant effect on PCR efficiency. Heatmap of probe signal inten-sities for a clinical hMPV sample following random RT-PCR using original primer (a) A1 or (b) AES-optimized primer A2. Figure S3: Comparison of amplification efficiency of original primer A1 and AES-optimized primer A2. RNA from patients infected with RSV B (n = 5) or hMPV (n = 3) were reverse-transcribed and amplified using primer A1 or A2 and the percentage of r-signature probes with signal above detection threshold was determined. Figure S4: Diagnostic PCR results for RSV patient 412 show that the patient does not have a coronavirus infection. (a) PCR using pancoronavi-rus primers. Lane 1, 1 kb ladder; lane 2, blank; lane 3, OC43 coro-navirus positive control; lane 4, 229E corocoro-navirus positive control; lane 5, RSV patient 412; lane 6, PCR primers and reagents only, as a negative control. (b) PCR using OC43 specific primers. Lane 1, 50 bp ladder; lane 2, blank; lane 3, OC43 coronavirus positive control; lane 4, RSV patient 412; lane 5, purified RSV from ATCC; lane 6, PCR negative control. (c) PCR using 229E specific primers. Lane 1, 229E coronavirus positive control; lane 2, RSV patient 412; lane 3, PCR negative control; lane 4, 1 kb ladder. Supplementary tables. Table S1: List of genomes represented on the pathogen detection microarray. Table S2: Comparison of E-Predict and PDA algo-rithms. Pathogen microarray data: data have been deposited in NCBI's Gene Expression Omnibus and are accessible through GEO accession number GSE3779 [45]. Software downloads. Amplifica-tion efficiency score software: Primerselect Readme.txt; Primerse-lect.java. Pathogen detection algorithm (PDA): WKL Readme.txt; WKL.cpp.
Click here for file
Acknowledgements
We thank Pauline Aw for technical assistance, Joshy George and Vinsensius Vega for the median signal intensity script, Kuswandewi Mutyara and the RSV study group. This study and ethical compliance was approved by the Ministry of Health, National Institute of Health Research and Development No. KS.02.01.2.1, April, 1997, Jakarta, Indonesia. Shirlena Soh is undertak-ing her PhD at GIS through a scholarship from the Queensland University of Technology, Australia. This work was supported by funding from Singa-pore's Agency for Science, Technology and Research (A*STAR) and the World Health Organization (WHO). A*STAR and WHO had no role in study design, data collection and analysis, decision to publish, or prepara-tion of the manuscript. WHO was involved in designing the clinical arm of the study performed in Bandung, Indonesia.
References
1. Zhang T, Breitbart M, Lee WH, Run J-Q, Wei CL, Soh SWL, Hibberd ML, Liu ET, Rohwer F, Ruan Y: RNA viral community in human feces: prevalence of plant pathogenic viruses. PLoS Biol 2006, 4:e3.
2. Robertson BH, Nicholson JK: New microbiology tools for public health and their implications. Annu Rev Public Health 2005, 26:281-302.
3. Peters RP, van Agtmael MA, Danner SA, Savelkoul PH, Vanden-broucke-Grauls CM: New developments in the diagnosis of bloodstream infections. Lancet Infect Dis 2004, 4:751-760. 4. Wang D, Coscoy L, Zylberberg M, Avila PC, Boushey HA, Ganem D,
comm
en
t
re
v
ie
w
s
re
ports
refer
e
e
d
re
sear
ch
de
p
o
si
te
d r
e
se
a
rch
interacti
o
ns
inf
o
rmation
pathogens. Proc Natl Acad Sci USA 2002, 99:15687-15692. 5. Urisman A, Fischer KF, Chiu CY, Kistler AL, Beck S, Wang D, DeRisi
JL: E-Predict: a computational strategy for species identifica-tion based on observed DNA microarray hybridizaidentifica-tion patterns. Genome Biol 2005, 6:R78.
6. Hong BX, Jiang LF, Hu YS, Fang DY, Guo HY: Application of oligo-nucleotide array technology for the rapid detection of path-ogenic bacteria of foodborne infections. J Microbiol Methods 2004, 58:403-411.
7. Sergeev N, Distler M, Courtney S, Al-Khaldi SF, Volokhov D, Chizhikov V, Rasooly A: Multipathogen oligonucleotide micro-array for environmental and biodefense applications. Biosens Bioelectron 2004, 20:684-698.
8. Lin B, Wang Z, Vora GJ, Thornton JA, Schnur JM, Thach DC, Blaney KM, Ligler AG, Malanoski AP, Santiago J, et al.: Broad-spectrum respiratory tract pathogen identification using resequencing DNA microarrays. Genome Res 2006, 16:527-535.
9. Wang D, Urisman A, Liu Y-T, Springer M, Ksiazek TG, Erdman DD, Mardis ER, Hickenbotham M, Magrini V, Eldred J, et al.: Viral discov-ery and sequence recovdiscov-ery using DNA microarrays. PLoS Biol 2003, 1:e2.
10. Striebel HM, Birch-Hirschfeld E, Egerer R, Foldes-Papp Z: Virus diagnostics on microarrays. Curr Pharm Biotechnol 2003, 4:401-415.
11. Bodrossy L, Sessitsch A: Oligonucleotide microarrays in micro-bial diagnostics. Curr Opin Microbiol 2004, 7:245-254.
12. Vora GJ, Meador CE, Stenger DA, Andreadis JD: Nucleic acid amplification strategies for DNA microarray-based patho-gen detection. Appl Environ Microbiol 2004, 70:3047-3054. 13. Nuwaysir EF, Huang W, Albert TJ, Singh J, Nuwaysir K, Pitas A,
Rich-mond T, Gorski T, Berg JP, Ballin J, et al.: Gene expression analysis using oligonucleotide arrays produced by maskless photolithography. Genome Res 2002, 12:1749-1755.
14. Ksiazek TG, Erdman D, Goldsmith CS, Zaki SR, Peret T, Emery S, Tong S, Urbani C, Comer JA, Lim W, et al.: A novel coronavirus associated with severe acute respiratory syndrome. N Engl J Med 2003, 348:1953-1966.
15. Fu J, Tan BH, Yap EH, Chan YC, Tan YH: Full-length cDNA sequence of dengue type 1 virus (Singapore strain S275/90). Virology 1992, 188:953-958.
16. Hamming RW: Error detecting and error correcting codes. Bell Syst Tech J 1950, 29:147-160.
17. Sung WK, Lee WH: Fast and accurate probe selection algorithm for large genomes. Proc IEEE Comput Soc Bioinform Conf 2003, 2:65-74.
18. Kane MD, Jatkoe TA, Stumpf CR, Lu J, Thomas JD, Madore SJ: Assessment of the sensitivity and specificity of oligonucle-otide (50mer) microarrays. Nucleic Acids Res 2000, 28:4552-4557.
19. Wong CW, Albert TJ, Vega VB, Norton JE, Cutler DJ, Richmond TA, Stanton LW, Liu ET, Miller LD: Tracking the evolution of the SARS coronavirus using high-throughput, high-density rese-quencing arrays. Genome Res 2004, 14:398-405.
20. Maskos U, Southern EM: A study of oligonucleotide reassocia-tion using large arrays of oligonucleotides synthesised on a glass support. Nucleic Acids Res 1993, 21:4663-4669.
21. Altschul SF, Madden TL, Schaffer AA, Zhang J, Zhang Z, Miller W, Lip-man DJ: Gapped BLAST and PSI-BLAST: a new generation of protein database search programs. Nucleic Acids Res 1997, 25:3389-3402.
22. Pang XL, Preiksaitis JK, Lee B: Multiplex real time RT-PCR for the detection and quantitation of norovirus genogroups I and II in patients with acute gastroenteritis. J Clin Virol 2005, 33:168-171.
23. Nguyen HK, Southern EM: Minimising the secondary structure of DNA targets by incorporation of a modified deoxynucleo-side: implications for nucleic acid analysis by hybridisation. Nucleic Acids Res 2000, 28:3904-3909.
24. Ratushna VG, Weller JW, Gibas CJ: Secondary structure in the target as a confounding factor in synthetic oligomer micro-array design. BMC Genomics 2005, 6:31.
25. Pathogen Diagnostic Microarray [http://www.gis.a-star.edu.sg/ pathchip]
26. Kullback S, Leibler RA: On information and sufficiency. Ann Math Statist 1951, 22:79-86.
27. Anderson TW, Darling DA: Asymptotic theory of certain good-ness of fit criteria based on stochastic processes. Ann Math Statist 1952, 23:192-212.
28. Deffernez C, Wunderli W, Thomas Y, Yerly S, Perrin L, Kaiser L: Amplicon sequencing and improved detection of human rhi-novirus in respiratory samples. J Clin Microbiol 2004, 42:3212-3218.
29. Chen YA, Chou CC, Lu X, Slate EH, Peck K, Xu W, Voit EO, Almeida JS: A multivariate prediction model for microarray cross-hybridization. BMC Bioinformatics 2006, 7:101.
30. Li X, He Z, Zhou J: Selection of optimal oligonucleotide probes for microarrays using multiple criteria, global alignment and parameter estimation. Nucleic Acids Res 2005, 33:6114-6123. 31. Steemers FJ, Gunderson KL: Illumina, Inc. Pharmacogenomics 2005,
6:777-782.
32. Kessler N, Ferraris O, Palmer K, Marsh W, Steel A: Use of the DNA flow-thru chip, a three-dimensional biochip, for typing and subtyping of influenza viruses. J Clin Microbiol 2004, 42:2173-2185.
33. McGlennen RC: Miniaturization technologies for molecular diagnostics. Clin Chem 2001, 47:393-402.
34. Koehne JE, Chen H, Cassell AM, Ye Q, Han J, Meyyappan M, Li J: Min-iaturized multiplex label-free electronic chip for rapid nucleic acid analysis based on carbon nanotube nanoelec-trode arrays. Clin Chem 2004, 50:1886-1893.
35. NCBI Taxonomy Database [http://www.ncbi.nlm.nih.gov/Taxon omy/taxonomyhome.html/]
36. Lim PL, Kurup A, Gopalakrishna G, Chan KP, Wong CW, Ng LC, Se-Thoe SY, Oon L, Bai X, Stanton LW, et al.: Laboratory-acquired severe acute respiratory syndrome. N Engl J Med 2004, 350:1740-1745.
37. Robertson SE, Roca A, Alonso P, Simoes EA, Kartasasmita CB, Olal-eye DO, Odaibo GN, Collinson M, Venter M, Zhu Y, Wright PF: Res-piratory syncytial virus infection: denominator-based studies in Indonesia, Mozambique, Nigeria and South Africa. Bull World Health Organ 2004, 82:914-922.
38. Smalling TW, Sefers SE, Li H, Tang YW: Molecular approaches to detecting herpes simplex virus and enteroviruses in the cen-tral nervous system. J Clin Microbiol 2002, 40:2317-2322. 39. Tang YW, Heimgartner PJ, Tollefson SJ, Berg TJ, Rys PN, Li H, Smith
TF, Persing DH, Wright PF: A colorimetric microtiter plate PCR system detects respiratory syncytial virus in nasal aspirates and discriminates subtypes A and B. Diagn Microbiol Infect Dis 1999, 34:333-337.
40. Bohlander SK, Espinosa I, Rafael , Le Beau MM, Rowley JD, Diaz MO: A method for the rapid sequence-independent amplification of microdissected chromosomal material. Genomics 1992, 13:1322-1324.
41. Hu A, Colella M, Tam JS, Rappaport R, Cheng SM: Simultaneous detection, subgrouping, and quantitation of respiratory syn-cytial virus A and B by real-time PCR. J Clin Microbiol 2003, 41:149-154.
42. Contoli M, Message SD, Laza-Stanca V, Edwards MR, Wark PA, Bar-tlett NW, Kebadze T, Mallia P, Stanciu LA, Parker HL, et al.: Role of deficient type III interferon-lambda production in asthma exacerbations. Nat Med 2006, 12:1023-1026.
43. Moës E, Vijgen L, Keyaerts E, Zlateva K, Li S, Maes P, Pyrc K, Berkhout B, van der Hoek L, Van Ranst M: A novel pancoronavirus RT-PCR assay: frequent detection of human coronavirus NL63 in chil-dren hospitalized with respiratory tract infections in Belgium. BMC Infect Dis 2005, 5:6.
44. Saldanha AJ: Java Treeview - extensible visualization of micro-array data. Bioinformatics 2004, 20:3246-3248.