http://dx.doi.org/10.4236/me.2015.69092
How to cite this paper: Li, Z.H. (2015) Real Estate Enterprise Capital Structure Analysis and Optimization. Modern Economy,
6, 971-976. http://dx.doi.org/10.4236/me.2015.69092
Real Estate Enterprise Capital Structure
Analysis and Optimization
—The Case Study of Kaisa Group
Zhaohui Li
Management School, Jinan University, Guangzhou, China Email: [email protected]
Received 2 September 2015; accepted 15 September 2015; published 18 September 2015
Copyright © 2015 by author and Scientific Research Publishing Inc.
This work is licensed under the Creative Commons Attribution International License (CC BY).
http://creativecommons.org/licenses/by/4.0/
Abstract
Real estate industry is one of the pillar industries of the national economy. As the real estate in-dustry develops rapidly, this capital-intensive inin-dustry’s funds demand is soaring. Therefore, in order to guarantee the healthy development of the real estate industry, a reasonable structure of enterprise capital is very important. From the perspective of corporate capital structure, this ar-ticle takes Kaisa as an example for analysis. Kaisa’s financing activities in recent years are com-bined to understand the overall financing situation, and then adopt relevant financial indicators to analyze Kaisa’s solvency comprehensively. After the defects of capital structures are identified, several suggestions in optimizing capital structure will be given.
Keywords
Real Estate Industry, Capital Structure, Solvency
1. Introduction
972
services, urban renewal and other services. Kaisa has developed rapidly in recent years; in 2013 for the first time Kaisa replaced Vanke overwhelmingly becoming the Shenzhen residential turnover and trade volume double champions. In 2014, Kaisa ranked 17th among top 500 China’s Real Estate Development Enterprises, with total assets of over one hundred billion yuan.
Even such a strong company almost came to debt restricting at the end of 2014. In November 2014, a large number of houses in Shenzhen were locked. On December 10, Kaisa announced that its chairman YingCheng Kwok would resign at December 31; on the other hand, the Kwok family actively planned to transfer 576 mil-lion shares for a consideration of HK $1.668 bilmil-lion to Life Insurance, through its subsidiary investment Taisho Life Insurance Co. This series of behaviors caused to a moment of panic which made the share price continue to fall. What was worse, an announcement on January 1, 2015 said that YingCheng Kwok’s resignation triggered a financing agreement that contained mandatory prepayment provisions, involving a total of HK $400 million of loan principal and accrued interest. Kaisa failed to repay the money and triggered the cross default. In the week from January 6 to January 13, 2015, about 20 financial institutions raised more than 20 pieces of property pre-servation to Kaisa. On February 5, HKEx disclosed that Sunac China (01918. HK) purchased more than 2529 billion shares of Kaisa at an average price of HK $1.8/share, got 49.25% stake of Kaisa. According to the an-nouncement on April 20, Kaisa couldn’t pay its two overseas bills that should pay on March 18 and 19 on time, which made its default in dollar bonds be a fact. A bankruptcy crisis came to Kaisa.
The rest of this paper is organized as follows. Section 2 uses different monetary indicators to analyze Kaisa’s financial status and financial structure, and try to find out the problems that Kaisa get. Section 3 presents some suggestions that are given to improve the capital structure of the real estate industry. Section 4 concludes.
2. Kaisa Capital Structure Analysis
2.1. Current Funding Sources of Chinese Real Estate Enterprises
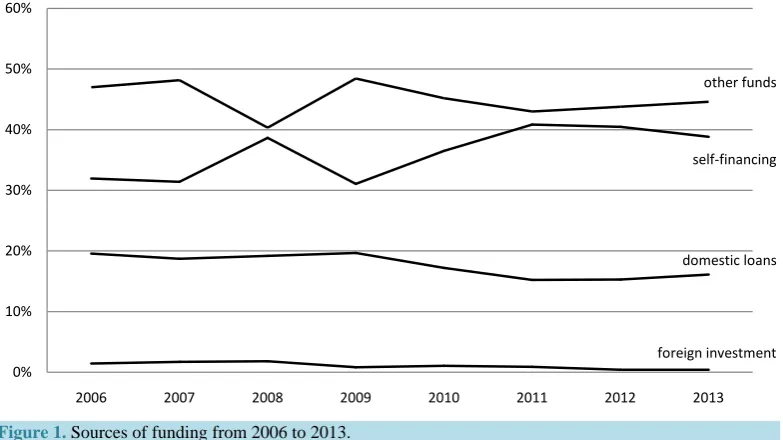
Real estate is a typical capital-intensive industry with long operation cycle, large capital input, high risk and is vulnerable to national macro-policy changes. Therefore in the process of production, it needs more stable finan-cial support. National Bureau of Statistics of China divides funding sources of real estate enterprises into four categories: domestic loans, foreign investment, self-financing and other funds. Sources of funding from 2006 to 2013 are shown in Figure 11.
[image:2.595.118.510.483.703.2]From 2006 to 2013, the actual funds of China’s real estate industry are rising year by year. In the four catego-ries, except the use of foreign capital changed repeatedly, the remaining three parts kept increasing. The figure above describes the detail changes of proportion of each source of funds, it can be seen self-financing and other
Figure 1. Sources of funding from 2006 to 2013.
domestic loans
foreign investment self-financing other funds
0% 10% 20% 30% 40% 50% 60%
2006 2007 2008 2009 2010 2011 2012 2013
1
973
funds account for the most of all the funds, the amount of domestic loans declined slightly in recent years, the proportion of foreign investment is low.
2.2. Capital Structure Changes in Kaisa
There are many factors that would affect a company’s capital structure. Li Pengyan, Luo Qingsheng, AoLifeng
[1] build up a model explored that profitability, size, growth etc. will affect the capital structure. Wang Bin and Chen Huixin [2] thought that the capital structure of real estate companies’ factors affecting has internal factors and external factors. Yang Shue [3] try to find out the reference value of capital structure for Chinese companies in her paper.
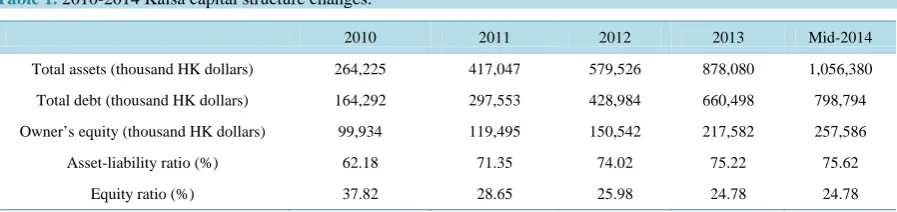
As Kaisa grows rapidly in recent years, there is a big capital expansion in the company. From 2010 to 2014, the growth rates of total assets had exceeded 20% per year. By the mid-2014, Kaisa’s total assets had reached 1.056 billion Hong Kong dollars, which is four times as much as the number in 2010. Under the pressure of ex-treme growth speed, to meet huge capital requirements, Kaisa’s debt can’t stop to increase. In 2014, the debt- to-assets ratio reached up to 75.62%. The equity part dropped fall 37.82% to only 24.38%, has dropped about 14% in those years. Specific capital structure changes were present in Table 1.
2.3. Kaisa Solvency Analysis
The Kaisa events happened at the end of 2014 can be concluded to be a chain of events: Kaisa listings locked for no reason causing the stock price fell, then the resignation of Chairman of Board Yingcheng Kwok triggered mandatory repayment treaty, which again triggered a series of chain events of debt default. Those chains of events happened so quickly that bring us to think whether if Kaisa really don’t have the ability to repay the money early as a real estate magnate? Is Kaisa’s capital structure if reasonable? Is insufficient solvency or oper-ational difficulties leading to this event? Following will discuss those problems from the perspective of capital structure.
2.3.1. Asset-Liability Ratio
Asset-liability ratio means the proportion of the capital provided by creditors in total capital. It is not only a comprehensive index for evaluating the company’s debt levels, but also can reflect the degree of safety of credi-tor loans. In the process of operation, the higher the index, the higher reliance on debt capital, thus the company is required to bear higher financial risk. Wang Bin and Chen Huixin [2] collate 69 real estate companies’ as-set-liability ratio from 2006 to 2010 and find that most companies are in between 50% - 70%.
It is shown Table 1 that Kaisa’s asset-liability ratio continued to rise from 62.18% in 2010 to 75.62% in mid-2014, especially in 2011 the ratio increased over 10% than last year. Until the mid-2014, Kaisa’s asset- liability ratio reached up to 75.62%, which was still far ahead in the real estate industry that has the feather of a high ratio at about 60%. Such high asset-liability bring Kaisa a high degree of financial risk. When facing emergency, such as a mandatory repayment, without enough funds, Kaisa can go to bankruptcy.
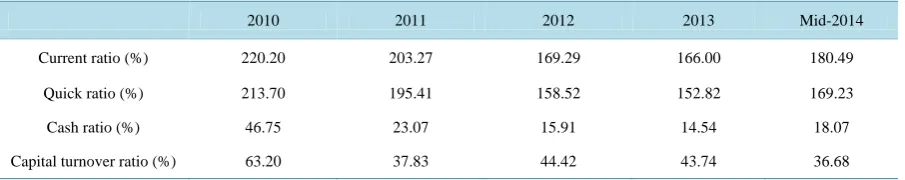
To increase the reliability of the analysis, this paper also calculated other four solvency indicators: current ra-tio, quick rara-tio, cash ratio and the capital turnover ratio. Specific data are shown in Table 2.
[image:3.595.89.538.601.707.2]From the table, we can see the current ratio is highest in 2010, as the number of 220.20%, indicating the company’s paying ability was well. In the following two years, the current ratio fell sharply to 169.29% and
Table 1. 2010-2014 Kaisa capital structure changes.
2010 2011 2012 2013 Mid-2014
Total assets (thousand HK dollars) 264,225 417,047 579,526 878,080 1,056,380
Total debt (thousand HK dollars) 164,292 297,553 428,984 660,498 798,794
Owner’s equity (thousand HK dollars) 99,934 119,495 150,542 217,582 257,586
Asset-liability ratio (%) 62.18 71.35 74.02 75.22 75.62
Equity ratio (%) 37.82 28.65 25.98 24.78 24.78
Table 2. 2010-2014 Kaisa solvency indicators.
2010 2011 2012 2013 Mid-2014
Current ratio (%) 220.20 203.27 169.29 166.00 180.49
Quick ratio (%) 213.70 195.41 158.52 152.82 169.23
Cash ratio (%) 46.75 23.07 15.91 14.54 18.07
Capital turnover ratio (%) 63.20 37.83 44.42 43.74 36.68
All the data come from financial statements of Kaisa from 2010 to 2014.
166.00%. In the mid-2014, the ratio rose to 180.49%, but still at a low level. Going trends of quick ratio and current ratio are the same in general. The cash ratio was 46.75% in 2010, which means that for every dollar of current liabilities, Kaisa had 46.75 dollars in cash or cash equivalents as the guarantee of repayment. Kaisa’s cash ratio was still at a high level in 2010, but in the next three years, the cash ratio plunged to less than 20%, which revealed the financial risk exists in Kaisa. The current ratio, quick ratio, cash ratio are different financial ratios that can reflect a company’s debt paying ability in the short term. All the three ratios prove Kaisa’s in-adequate solvency in recent years. The capital turnover ratio is utilized to reflect a company’s long-term sol-vency. The higher the capital turnover rate is, the stronger long-term solvency, the better the creditor’s security. The capital turnover ratio dropped significantly from 63.20% to 37.83% in 2011. In the next three years, this rate fluctuated at the level of 40%. From the sharp decrease in capital turnover rate, we can forecast there was some problem with the company’s future development.
2.3.2. Financial Leverage
Financial leverage is to take advantage of the debt interest that can be deducted pre-tax. A large number of companies use financial leverage to make additional revenue. If the financial leverage is used properly, it can increase corporate value, which is called the positive effect of financial leverage; if use undeserved, debt crisis will come with excessive debt, making companies hard to survive. Kaisa Group’s degree of financial leverage (DFL) from 2010 to 2014 is shown in Table 3.
Since the real estate industry requires large capital investment in early, the asset-liability ratio is generally between 60% to 70%. From Table 1 we can see Kaisa’s asset-liability ratio has gone beyond the average level, as much as 75.62%. According to the high financial risk, DFL should also be high. But the fact is the DFLs re-main at the level of 1for five years except for a slight rose in 2013 and mid-2014. DFL reached the peak in 2013 at the number of 1.12 which means EBIT rose 1 times its earnings per share will increase by 1.12 times. The overall DFLs are too small to show the positive effect of financial leverage. Why such an inconsistent happen? After careful analysis of financial data, it is found that the proportion of capitalized interest is very large in Kai-sa that lead to smaller DFL. Meanwhile, large deposit received increase the asset-liability ratio to a certain ex-tent. The effect of both result in the deviation between the asset-liability ratio and DFL, but it cannot deny the fact that Kaisa Group’s debt level is too high. It is more cautious to combine different indicators when analyzing.
2.3.3. Liability Structure
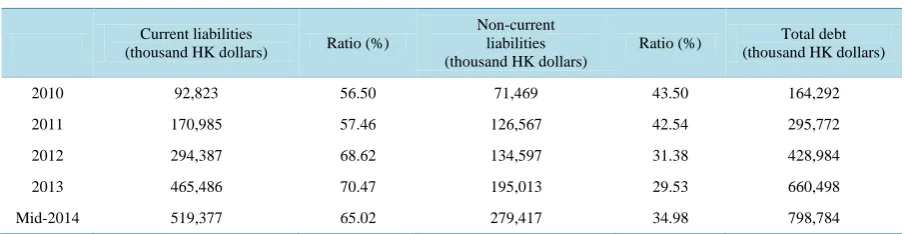
From Table 4 we can see current liabilities accounts for a high proportion of the total liabilities in Kaisa Group and current liabilities are mainly bank loans. In contrast, non-current liabilities are far less than current liabilities. The current liabilities ratio in five years reached to a maximum of 70.47%, non-current liabilities ratio is only 29.53%. If a company needs to borrow lots of money to make sure the normal operation, the current liabilities ratio will be high and will bring company high financial risk. Once the market environment changes, the com-pany may face the risk of funding strand breaks and makes it difficult to repay current liabilities. Kaisa encoun-tered their listings being locked and triggered the prepayment treaty, thus fell into crisis. Borrowing and debt frequently will increase companies’ financing difficulties, resulting in cash flow instability.
975
Table 3. Kaisa group’s degree of financial leverage (DFL) from 2010 to mid-2014.
2010 2011 2012 2013 Mid-2014
DFL 1.02 1.02 1.01 1.12 1.07
DFL = EBIT/(EBIT-I), are calculated based on Kaisa’s annual and semi annual financial reports.
Table 4. 2010-2014 Kaisa liabilities structure changes.
Current liabilities
(thousand HK dollars) Ratio (%)
Non-current liabilities (thousand HK dollars)
Ratio (%) Total debt
(thousand HK dollars)
2010 92,823 56.50 71,469 43.50 164,292
2011 170,985 57.46 126,567 42.54 295,772
2012 294,387 68.62 134,597 31.38 428,984
2013 465,486 70.47 195,013 29.53 660,498
Mid-2014 519,377 65.02 279,417 34.98 798,784
All the data come from financial statements of Kaisa from 2010 to 2014.
3. Suggestions to Optimize Capital Structure in Real Estate Enterprises
3.1. Diversify Financing ChannelsKaisa’s financing mainly rely on bank loans, the real estate industry as a whole depends on self-financing funds, seldom use foreign capital. To reduce the financial risk of both the companies and the banks, it is imminent to diversify financing channels. First, government should join the visible hand with the invisible one of the market to facilitate the development of the financing market. The financing costs can be increased by raising bank’s re-serve ratio and interest rates and improving the threshold of corporate banking loans. Establish a unified credit rating system can strengthen the reliability of companies’ credit rating, improve the bond market. Then lower the difficulty of corporate equity financing and increase the share of equity financing through implementing new measures in the national capital market reform. Except for debt and equity financing, other financing ways, such as real estate trust fund and private equity, should be developed to diversify financing channels. Abundant fi-nancing channels can bring enterprises with stable capital sources and lower fifi-nancing costs.
3.2. Capital Structure Adjustment
From the above analysis of Kaisa Group’s capital structure, there exist many problems which also existing in most real estate companies. Good capital structure can create value, but unreasonable capital structure will result in disaster as same as Kaisa. Carryout rational financing activities, control financing costs, optimize financing structure are measures that enterprise managers should take to avoid blind company expansion and financial trouble.
When adjust the capital structure, various financial analysis indicators should be used to predict companies’ financial status and financial risk in a reasonable manner. The enterprises should pay attention to financial leve-rage which has an extremely important impact on making financing decisions. Use financial leveleve-rage properly can improve the return on investment and enhance market competitiveness. Asset-liability ratio, current ratio, quick ratio and other indexes also have the function of analysis. As an accountant in real estate enterprises, he (she) needs to have a further understanding of different financial indicators so that accountant can ensure the accuracy of analysis based on the combination of financial leverage and other indicators. What’s more, enter-prises could obtain optimum capital structure and realize the sustainable development through practicing the fi-nancial contingency theory [4].
3.3. Intensify Market Reform
way lacks intense competition lead to the formation of debt financing constraints. In the background of unrea-sonable debt financing, it becomes more difficult to financing through the stock market for real estate enterprises. Zhao Dongqing, Zhu Wuxiang, Wang Zhengwei [5] proved macroeconomic policy and the capital market supply are probably the most important determinants of the capital structure of Chinese firms. To change this situation, government must promote the reform of the banking system and financial system to commercialize state-owned banks and cultivate a competitive market environment. Effort should also be made to further pro-mote the reform of non-tradable shares to speed up the circulation of stocks and improve the ownership structure. Establish a sound property rights system and internal financial control system is important too.
3.4. Establish an Early Warning Mechanism
The real estate industry is in the influence of external environment, especially affected by federal macroeco-nomic policies. The external market environment is unpredictable, which brought a threat to the development of real estate business. The real estate companies should establish emergency early warning mechanism in internal, simulated emergency situations and come up with a variety of contingency plans, could be unruffled in the event of unexpected events. It is more pop to possess appropriate cash flow to reduce the risk in case of temporary funding requirements. Management should train employees’ emergency response capacity, increase their sense of collective honor and loyalty. The staff will gather together to tide over the crisis when they have problems.
4. Conclusion
In recent years, the development of the real estate industry has been the country’s concern. China has published macro-control policies on the real estate industry to curb housing prices and regulate the market. Undoubtedly, the Kaisa event sounded the alarm to the real estate enterprises. No matter it is a large company as powerful as Kaisa Group, or still a new business in growth, should face the problems of its own. The right way is to optimize capital structure, strengthen the capital chain and ensure sufficient cash reserves. Don’t be anxious for success; maintaining a reasonable growth speed is conducive to companies’ long-term development.
References
[1] Li, P.Y., Luo, Q.S. and Ao, L.F. (2005) The Analysis of Capital Structure of Chinese Real Estate Listed Companies.
Journal of Harbin Institute of Technology, 3, 291-294.
[2] Wang, B. and Chen, H.X. (2012) The Capital Structure of Chinese Listed Real Estate Companies. The DUT 4th Inter-national Conference on Financial Risk and Corporate Finance Management, Dalian, 7 July 2012, 567-573.
[3] Yang, S. (1995) The Analysis of Companies’ Capital Structure. Accounting Research, 4, 29-32.
[4] Wang, X. and Wang, L. (2012) A Research on Financial Contingency Theory of Capital Structure Adjustment—The Case Study of J Group. Accounting Research, 10, 65-96.