and Counting
ANIS AZWANI BINTI MUHD SUBERI
COMPUTER AIDED SYSTEM FOR DENDRITIC CELLS DETECTION AND COUNTING
ANIS AZWANI BINTI MUHD SUBERI
A thesis submitted in
fulfillment of the requirement for the award of the Degree of Master of Electrical Engineering
Faculty of Electrical and Electronic Engineering Universiti Tun Hussein Onn Malaysia
DEDICATION
For my beloved mother and father, My supervisor,
Lecturers, Sisters, Best friends,
Friends,
And everyone who involved in inspired me throughout my journey of completing this project.
ACKNOWLEDGEMENT
I would like to thank my advisor, Dr. Wan Nurshazwani binti Wan Zakaria, for all the guidance and encouragement she provided me since the very beginning of my graduate program. Her invaluable suggestions and expertise in the field have helped me immensely in attaining the goals I set out to achieve with my research. I am also very grateful to my committee member, Dr. Mohd Razali bin Md Tomari for being so supportive and giving me important feedback over the course of this thesis. I am deeply indebted to Nicolas Jaccard and Marko Usaj from University College London (UCL) and University of Ljubljana, Slovenia respectively for taking time off their busy schedules to help with my research. Their inputs on the identification of various cells in the data set have helped in shaping a lot of my research work. I would also like to thank the members of the Cancer Research Malaysia (CRM) especially Dr Lim Kue Peng and Ms. San Jiun for providing the sample images of Dendritic Cells and clear explanation on the culturing process. Finally, I would like to thank my parents and my friends for all the smiles along the way that made the many months of my research a lot more pleasant and enjoyable.
This research was supported by the Fundamental Research Grant (FRGS)
ABSTRACT
ABSTRAK
TABLE OF CONTENTS
DECLARATION ii
DEDICATION iii
ACKNOWLEDGEMENT iv
ABSTRACT v
ABSTRAK vi
TABLE OF CONTENTS vii
LIST OF TABLES x
LIST OF FIGURES xi
LIST OF SYMBOLS AND ABBREVIATIONS xiv
LIST OF APPENDICES xv
LIST OF PUBLICATIONS xvi
LIST OF AWARDS xvii
CHAPTER 1 INTRODUCTION 1
1.1 Problem Statement 3
1.2 Aim 4
1.3 Objectives 4
1.4 Scopes and Limitations 5
1.5 Research Contributions 5
CHAPTER 2 LITERATURE REVIEW 8
2.1 Introduction to Immune Cell Subsets 8 2.2 The Significance of Identification of
Dendritic Cells (DCs) 11
2.3 Dendritic Cells (DCs) Culture and Imaging 11 2.3.1 Commercial System for Dendritic
Cells (DCs) Classifier 15
2.4 Current Technology in Cell Identification
for PCM Image 17
2.4.1 Image Preprocessing and
Segmentation in PCM Imaging 18
2.4.2 Feature Extraction 25
2.4.3 Classification 28
2.5 Limitation of Existing Work and Research
Opportunities 29
2.6 Summary 31
CHAPTER 3 RESEARCH METHODOLOGY 32
3.1 Image Acquisition (Cell Imaging) 33
3.2 Grayscale Normalization 35
3.3 Pre-processing Stage 35
3.3.1 Local Contrast Threshold (LCT) and
Halo Removal 37
3.3.2 H-GUILAT and Halo Removal 39
3.3.3 H-GLAT and Halo Removal 41
3.4 Segmentation Stage 42
3.4.1 Morphological Operators 43
3.4.2 Canny Edge Segmentation 43
3.5 Feature Extraction 44
3.5.1 Main Feature of Dendritic Cells
(DCs) 44
3.5.2 One Dimensional (1D) Fourier
Descriptors (FDs) 46
3.7 Graphical User Interface (GUI) 49 3.8 Image Processing Performance Measures 51
3.8.1 Quantitative Analysis 51
3.8.2 Qualitative Analysis 53
3.9 Feasibility Study 53
3.9.1 Statistical Analysis 54
3.10 Summary 55
CHAPTER 4 RESULT AND ANALYSIS 58
4.1 Preliminary Result and Analysis 58
4.1.1 Grayscale Normalization 58
4.1.2 Pre-processing Stage 59
4.1.3 Segmentation Stage 66
4.1.4 Evaluation of Pre-processing and
Segmentation Performances 66
4.1.5 Feature Extraction 68
4.1.6 DCs Classification 72
4.2 Experimental Result and Analysis 79
4.2.1 Image Pre-processing, Cells
Segmentation and DCs Classification 80
4.2.2 CasDC System Performance 83
4.3 Summary 88
CHAPTER 5 CONCLUSION AND RECOMMENDATION 89
5.1 Overview 89
5.2 Achievements 89
5.3 Recommendation 91
REFERENCES 93
APPENDICES 101
LIST OF TABLES
2.1 WBCs specification 9
2.2 Type of microscopy in DCs visualisation 13
2.3 Correlation of texture features 27
2.4 Previous methods applied to solve PCM imaging artifacts 30 2.5 Previous works method in feature extraction and classification 31
3.1 CasDC modules and settings 49
3.2 Manual counting in 100X magnification (Day 4) 53 3.3 Summary of group variances between two pathologists 54 3.4 One-way ANOVA analysis between two pathologists 54 3.5 Types of performance measure used to evaluate the developed
method 57
4.1 Comparative performances of parametric setting in sigma, σ 61 4.2 Qualitative results of MAE on three proposed frameworks in
pre-processing and segmentation stage 67
4.3 Comparison between proposed pre-processing method 68 4.4 Cell classification according to calculated parameters 69 4.5 Classification of DCs based on TM dissimilarity 72 4.6 Comparison results for the automatic detection of DCs with
manual results (100X magnification) 76
4.7 Comparison results for the automatic detection of DCs with
manual results (200X magnification) 77
4.8 Performance results of CasDC system 78
LIST OF FIGURES
1.1 DCs immunotherapy procedure 1
1.2 Component of immune cells in human blood system 2
1.3 Overall research methods and contributions 6
2.1 Types of blood smear under Light Microscope 8
2.2 Differentiation of Monocytes 9
2.3 Morphology states of DCs 10
2.4 DCs cultivated through several passages 12
2.5 Process in Flow Cytometry 14
2.6 Basic cell imaging steps for systems and software 15
2.7 Cell size histogram in blood smear 16
2.8 Example of Cellometer system output 16
2.9 Current trend on PCM image processing 17
2.10 Basic stages in PCM image processing 17
2.11 Imaging artifacts in PCM image 18
2.12 Application of Histogram Equalization 19
2.13 Results in: (a) Image Reconstruction and (b) Semi-Supervised
Clustering 20
2.14 Results of Gaussian Kernel Filtering method 21 2.15 Application of Active Contour method in PCM image 21 2.16 Comparison of PCM cell segmentation in overlapping condition 22
2.17 Segmentation result of K-means method 23
2.18 Threshold segmentation result using intensity profile curve 24
2.19 Result of Halo Removal method in PCM image 24
2.20 The procedure of cell features analysis 25
3.2 DCs counting workflow using Template Matching based on
1D Fourier Descriptors (FDs) 33
3.3 DCs imaging under PCM 34
3.4 Process of DCs culture from PBMC samples 35
3.5 Proposed pre-processing methods 36
3.6 Cell region surrounded by bright halo ring 38
3.7 Edge detection compass mask 38
3.8 Comparison between Global and Local Adaptive Threshold 40
3.9 H-GLAT and Halo Removal workflow 42
3.10 Segmentation methods to isolate cell shape 42
3.11 Proposed morphological operators 43
3.12 Sample of DCs image 45
3.13 Geometric features of each measured cell 46
3.14 a) Translation b) Scaling and c) Orientation invariances 47 3.15 General concept of Template Matching (TM) method 48
3.16 CasDC: DCs recognition and counting GUI 50
3.17 Result of batch mode 50
3.18 Evaluation measures of proposed framework 51
3.19 Correlation between two pathologists counting 55 3.20 Proposed framework in image processing part 56 4.1 Test output of grayscale normalization stage 59
4.2 Test output in profile intensity 60
4.3 MAE with standard deviation of 27.3%, 7.6% and 3.2% for
σ = 0.8, 1.0 and 1.2 respectively 61
4.4 Test output in a) Halo Removal and b) Cell outline 62
4.5 Types of kernel in Halo Removal 62
4.6 Proposed pre-processing framework using a) LCT and
b) Halo Removal 63
4.7 Results of H-GUILAT implementation in pre-processing stage 64
4.8 Halo Removal 64
4.9 Gaussian filtering 65
4.10 Local Adaptive Threshold applied on a) Low sigma
b) High sigma and c) Logical operator AND 65
4.12 Test output in segmentation stage 66 4.13 Quantitative of cell segmentation error with standard deviations
reading for each proposed framework 67
4.14 Scatter plot between circularity and area from T-cells, debris
and DCs 69
4.15 Scatter plot between a) area/perimeter ratio and FDs
b) moment invariant and FDs 70
4.16 Extraction of shape signatures in templates 71
4.17 Test output of DCs recognition 72
4.18 10 templates of DCs 73
4.19 Correlation between manual and automated counts using
different types of template 74
4.20 Counting performance in function of the local window size (w) for different combination of image magnification of 100X and
200X 75
4.21 System performance for the first image data-set 79
4.22 Example of second image data set 80
4.23 Result of image processing stages 81
4.24 Result of image processing stages 82
4.25 Comparison result for CasDC and manual 84
4.26 Complex overlapping constraint in clumps cells region 85
4.27 Multiple counting occur on DCs region 86
LIST OF SYMBOLS AND ABBREVIATIONS
μ - Mean around each pixel
𝜎2 - Variance around each pixel M - Number of rows of pixel in image N - Number of columns of pixel in image
∑ - Sigma
ɳ - N by M local neighborhood of each pixel in image
∈ - Epsilon
𝛩 - Theta
⊕ - \bigoplus
𝐴𝑡𝑐 - Area of T-cell
𝐴𝑑𝑏 - Area debris
𝐴𝑚𝑐 - Area of Monocyte cell
𝐴𝑑𝑐 - Area of Dendritic Cell
𝑃𝑡𝑐 - Perimeter of T-cell
𝑃𝑑𝑏 - Perimeter of debris
𝑃𝑚𝑐 - Perimeter of Monocyte cell
𝑃𝑑𝑐 - Perimeter of Dendritic Cell
𝐷𝑡𝑐 - Diameter of T-cell
𝐷𝑑𝑏 - Diameter of debris
𝐷𝑚𝑐 - Diameter of Monocyte
LIST OF APPENDICES
APPENDIX TITLE PAGE
LIST OF PUBLICATIONS
1. Anis Azwani Muhd Suberi; Wan Nurshazwani Wan Zakaria; Razali Tomari and Mei Xia Lau. Dendritic cell recognition using template matching based on one-dimensional (1D) fourier descriptors (FD). First International Workshop on
Pattern Recognition. Proc. SPIE. 2016. pp.100110K.
2. Anis Azwani Muhd Suberi; Wan Nurshazwani Wan Zakaria, Razali Tomariand Kue Peng Lim. Optimization of overlapping dendritic cell segmentation in phase contrast microscopy images. In 2016 IEEE-EMBS Conference on Biomedical
Engineering and Science. IEEE. pp.246-250.
3. Anis Azwani Muhd Suberi; Wan Nurshazwani Wan Zakaria, Razali Tomari. Dendritic cell recognition in computer aided system for cancer immunotherapy.
Procedia Computer Science. Elsevier. 105C: 177-182.
4. Anis Azwani Muhd Suberi; Wan Nurshazwani Wan Zakaria, Razali Tomari. Dendritic cells feature extraction using geometric features and 1D fourier descriptors. In the 9th Int. Conference on Computer and Automation Engineering
(ICCAE 2017). Accepted
5. Anis Azwani Muhd Suberi; Wan Nurshazwani Wan Zakaria, Razali Tomari. An Automated Detection and Quantitative Analysis of Dendritic Cells in Phase Contrast Microscopy Images. Journal of the International Measurement
LIST OF AWARDS
1. Best Poster Award in the 1st FKEE Postgraduate Research Conference 2016, Faculty of Electrical and Electronic Engineering, Universiti Tun Hussein Onn Malaysia.
2. Gold medal (Higher institution category) in the International Invention and Innovative Competition (INIIC-Series 2), Puteri Beach Resort, Port Dickson, Negeri Sembilan, 2016.
3. Bronze medal (Applied Research under staff category) in the Research and Innovation (R&I) Festival, Universiti Tun Hussein Onn Malaysia, 2016.
4. Silver medal in the 2017 Malaysia Technology Expo (MTE), Kuala Lumpur.
5. Gold medal in the 2017 Innovation Design Research International Symposium (IDRIS).
1CHAPTER 1
INTRODUCTION
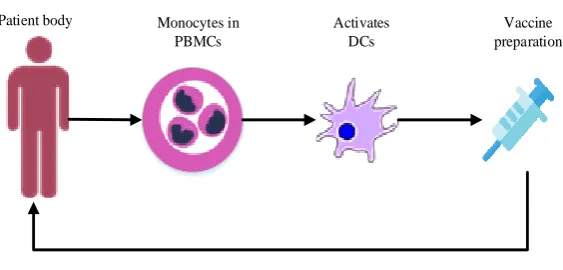
Most of the established therapies such as surgery, chemotherapy and radiotherapy are widely used to treat cancer patients. Surgery is often considered as the first therapy option to remove the tumour (Sasada et al., 2015). Nevertheless, there is a tendency of removing only parts of the tumour. Following that, a combination of surgery with radiotherapy or chemotherapy is typically used in patients to kill the cancer cells (Sasada et al., 2015). However, both radiotherapy and chemotherapy can introduce non-favourable outcomes towards the patient, such as serious bleeding, lack of energy and experience depression (Mellman et al. 2011). Recently, Dendritic Cells (DCs) immunotherapy has been widely explored and introduced as an advanced approach to boost the immune system to fight cancer (Raïch-Regué et al., 2014; Sasada et al., 2015). DCs immunotherapy employs and activates the body’s own immune cells to fight the cancer cells as shown in Figure 1.1.
Patient body Monocytes in PBMCs
Activates DCs
Vaccine preparation
[image:18.595.174.456.542.677.2]Infuse back
Figure 1.1: DCs immunotherapy procedure
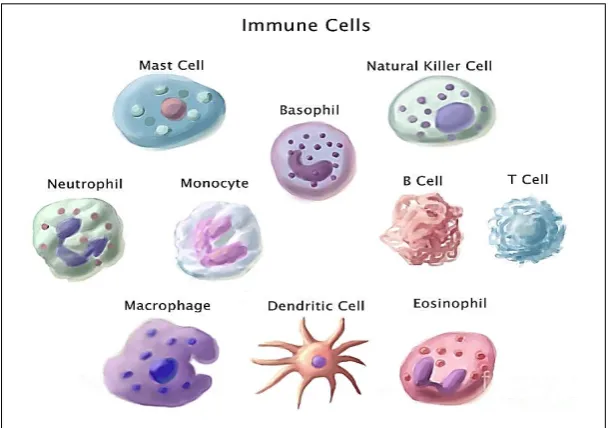
(Raïch-Regué et al., 2014; Tan et al., 2010). DCs can be generated in vitro from Peripheral Blood Mononuclear Cells (PBMCs) (Tan et al., 2010). On top of that, DCs have long and numerous tentacles as their main characteristic as shown in Figure 1.2. The identification of DCs in immunotherapy is important as the phenotype of DCs can determine the type of immune reaction in autoimmunity response. In brief, morphological cell analysis is a key issue for the preparation of cancer immunotherapy as the DCs are trained to recognise cancer antigens.
Figure 1.2: Component of immune cells in human blood system (IMDC, 2015)
During the cell culture, DCs can be characterised and recognised using Flow Cytometry (Rovati et al., 2008; Tan et al., 2010). However, this method involves a staining process which can affect the DC viabilities. Therefore, another promising microscopy technique called, Phase Contrast Microscopy (PCM) is used to visualise, recognise and count the amount of DCs manually before the sample is infused back into the patient body. Even though PCM is a label-free imaging modality, the identification purpose becomes challenging as the image is constituted with a variation of imaging artifacts such as halo region, low contrast and overlapping DCs (Jaccard et al., 2014;
Ra et al., 2013; Usenik et al., 2011). Such procedure is laborious, time-consuming and
very dependent on the expert’s skill to recognise and count DCs which can introduce
human errors.
the initial condition, pre-processing schemes are applied to remove any imaging artifacts from the testing image. The complexity between DCs boundary and other cells can be considered distinctive to visually distinguish. Therefore, Fourier Descriptors (FDs), which are derived from One-Dimensional (1D) shape signatures is proposed in which the method has been applied in several studies particularly in shape-based image retrieval (Dalitz et al., 2013; Sokic & Konjicija 2016; Yuan et al., 2014). This proposed approach is capable to identify DCs with a label-free detection and low computational resources.
The overall process of DCs counting scheme of PCM image microscopy encompasses four primary stages namely, 1) Image Acquisition; 2) Pre-processing stage for both templates and testing images; 3) Computation of 1D Fourier Descriptors (FDs) to extract cell contour; and 4) DCs recognition, marking and counting process. Next, the sample images are compared to a set of template images to detect the most approximate target cell based on FDs. The cell templates have been already configured to match similar pattern of DCs to those of the templates.
During the features matching procedure, the cell shape signatures are obtained through the conversion of geometrical pixel information of shape descriptors to 1D FDs, which facilitate an efficient Template Matching (TM) to recognise, mark and count DCs in a pool of blood cells. The details on the DCs imaging classification schemes are described in Chapter 3, followed by the results and analysis in Chapter 4. Towards the end, the conclusion of the entire research with future works are discussed in Chapter 5.
1.1 Problem Statement
However, it involves tedious manual inspection and in certain cases, the DCs tentacles can hardly be identified due to the low image contrast and bright halo outlining the cells. The PCM turns the invisible phase shifts of the light waves emerging from the object into visible intensity by using interference with the 90° phase shifted illumination wave (Bensch & Ronneberger, 2015). Therefore, these would result in decreasing intensity which is proportional to the object thickness. This condition leads to halo region and shade-off artifacts to the image (Jaccard et al., 2014; Bensch & Ronneberger, 2015). In the meantime, PCM has critical issues regarding clumping and overlapping cells which may deteriorate the recognition process (Tan et al., 2010). Apart from imaging artifacts, the cell identification procedure can be very time consuming and qualitatively subjective. Such procedure is very dependent on the expert’s skill to identify and count DCs. To address these circumstances, a Computer
Aided System for DCs identification (CasDC) which involves pattern recognition is proposed to effectively identify and count DCs with a rapid and minimum processing time. The finding of this research would permit rapid, standardized and quantitative analysis for further cancer immunotherapy vaccine preparation.
1.2 Aim
This research aims to develop a Computer Aided System for Dendritic Cells identification (CasDC) for cancer immunotherapy vaccine preparation.
1.3 Objectives
To achieve the aim, the following objectives have been outlined:
1. To develop a pre-processing technique on the PCM images to reduce the image artifacts in preparation for segmentation of DCs.
2. To establish a feature extraction and classification algorithm for detection of DCs.
3. To develop an auxiliary Graphical User Interface (GUI) that supports efficient detection of DCs.
1.4 Scopes and Limitations
The restrictions and limitations during this research are:
1. This study focuses on the cell shape signatures in identifying the main characteristics of DCs for their classification.
2. MATLAB R2015a toolbox which utilizes GUI is developed to identify and count DCs.
3. The experimental studies are conducted and evaluated on selected samples of PBMCs images under PCM. All the selected samples are required to undergo culturing procedure to enhance the visibility of DCs from complex clumping region.
4. The image dataset is provided by Cancer Research Malaysia (CRM). All the ethical standards are conducted by CRM and the images are publicly available for research purposes.
5. The developed algorithm is tested on 1877 × 1408 and 2560 × 1920 size pixels of randomly selected from 135 PCM images to show the feasibility of the developed system.
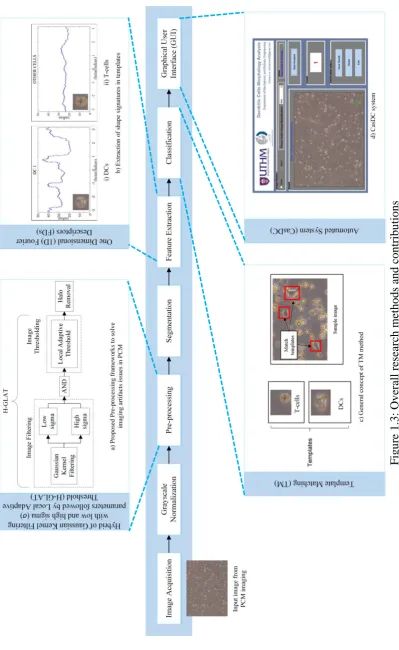
1.5 Research Contributions
F
ig
u
re
1
.3
: Ov
era
ll
re
se
arc
h
methods a
nd
c
ontribu
ti
[image:23.595.112.512.66.717.2]1.6 Summary
This chapter briefly discusses the current issues in DCs identification for cancer immunotherapy purpose. In this procedure, DCs represent an appealing option in vaccine preparation as they have the ability to boost the immune system to fight cancer. DCs can be rapidly identified using a laser based tool called Flow Cytometry. However, this method affects the DCs viability as it acquires staining stage which might kill the tentacles. Therefore, manual counting has been practiced via a label free imaging modality which is PCM. The pathologists face a challenge to identify DCs based on the tentacles using this method due to a variation of imaging artifacts such as halo region, low contrast and clumping cells in the PCM image.
2CHAPTER 2
LITERATURE REVIEW
Many studies have discussed the motivation of carrying an in depth study on Dendritic Cells (DCs) in cancer immunotherapy by the clinical practitioners. In brief, this review focuses on four areas: 1) Introduction to Immune Cell Subsets; 2) Significance of Identifying DCs; 3) DCs Culture and Imaging; and 4) Current Technology in Identification for PCM Image.
2.1 Introduction to Immune Cell Subsets
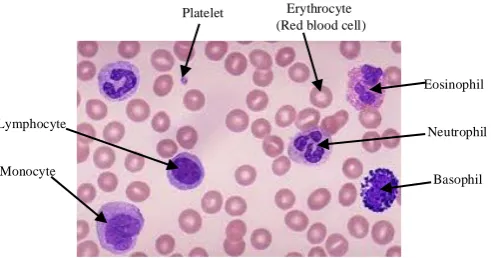
White Blood Cells (WBCs) or known as Leukocytes involve in maintaining immune system by protecting the body against any diseases and sensing foreign organism. Besides that, they are essential in the diagnosis of cancer as the information about any diseases can be extracted from them (O'Neill et al., 2015; Ma et al., 2013). The production of WBCs is derived from multipotent cell in the bone marrow. There are five types of WBCs which are Monocyte, Lymphocyte, Neutrophil, Basophil, and Eosinophil as shown in Figure 2.1.
Platelet Erythrocyte
(Red blood cell)
Lymphocyte
Monocyte
Eosinophil
Neutrophil
[image:25.595.199.445.617.746.2]Basophil
Table 2.1 provides specification of each blood components. These are essential and play a crucial role in maintaining healthiness to the human body.
Table 2.1: WBCs specification (Sarrafzadeh et al., 2014)
WBCs (~% in blood)
Nucleus Cytoplasm Size (µm) Neutrophils
(60%)
Divided into 2 to 5 segments and stains dark purple (multi-lobe nucleus).
Pale pink to tan with fine pink-purple granules.
12-16
Eosinophils (3%)
Blue coloured and is divided into 2 segments.
Full of pale pink to tan with large orange and red granules.
14-16
Basophils (1%)
Contains 2 lobes that stains purple and is difficult to see.
Pale pink-tan but contains large purple/blue-black granules obscure nucleus.
14-16
Monocytes (6%)
Singular nucleus, kidney shaped or bean shaped.
Stains a blue gray colour with ‘ground glass’ cytoplasm with tiny granules.
14-20
Lymphocytes (30%)
Large, round or oval, dark staining nucleus.
Little to no cytoplasm with pale blue in colour.
8-15
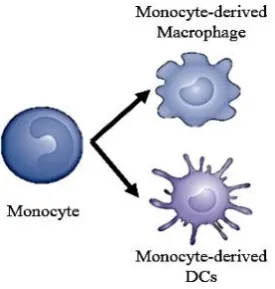
[image:26.595.251.389.588.733.2]Blood Monocytes are the major source of human DCs in vitro (Heine et al., 2012; Silveira et al., 2013). Monocytes appear in amoeboid shape with abundant blue-grey cytoplasm. They have a folded nucleus which is in the form of kidney bean shape. Ordinarily, Monocytes constitute 0.2–1.0 × 10 9/l (2–10%) of blood count in normal adults (Curry, 2012). They are the largest type of WBCs with the diameter of 14 to 20µm. The functions of Monocytes are to replenish resident Macrophages at normal states, response to inflammation signals, subsequently move faster to the site of infection and lastly, able to differentiate into Macrophages and DCs after circulating in the blood for one to three days. The differentiation of Monocytes into Macrophages and Monocyte is illustrated in Figure 2.2.
The migration and differentiation of Monocytes into specific tissues occur at the time of a stimulation of a different Cytokines, Interleukins and other factors (Le Douce et al., 2010). Depend on the location, the Monocytes may become either Macrophages or DCs (Landolt et al., 2011). Macrophages function as a tissue defender from remote substances. In facts, Macrophages have large smooth nucleus, wide area of cytoplasm with internal vesicle compared to DCs which have long tentacles and contain abundant intracellular structures of antigen processing. During an infectious disease, DCs may trigger autoimmune responses and stimulate T-cells with resultant Macrophage activation and subsequently inducing significant tissue injury (Ferenbach & Hughes, 2008).
Wieder (2003) discusses on a population of striking Dendritic-shaped cells which is discovered in the spleen, nearly thirty years ago. It is proved that the DCs clearly exist in either lymphoid or non-lymphoid tissues. DCs exist in a number of places in the body and are mobile, migrating in the blood and lymph from peripheral organs to the lymphoid organs, especially to T-cell areas such as that in the Lymph Nodes (LNs). Generally, DCs will capture the antigens, process and present them on the cell surface along with convenient co-stimulation molecules.
DCs are presented in immature and mature states as illustrated in Figure 2.3. Immature DCs have no tentacles while mature DCs exhibit numerous tentacles or veils. In most tissues, DCs will undergo immature state when they are unable to stimulate T-cells. However, they are still able to capture antigens or viruses in peripheral sites. Once the antigens are captured, DCs will process them and start to migrate to T-cells, area of Lymph Nodes (LNs) and Spleen. This process is called maturation state where immune response will be stimulated.
[image:27.595.148.499.593.737.2]a) Immature DCs b) Mature DCs
2.2 The Significance of Identification of Dendritic Cells (DCs)
This research focuses on DCs morphology analysis due to its significance and impact to the pathologist in enhancing the vaccine preparation for cancer immunotherapy. In DCs vaccine cell preparation, the identification of DCs from PBMCs sample is crucial before the cell can be stimulated. Therefore, it is essential to analyse the amount of DCs at the tumor site of cancer patients as it plays a vital role in inducing immunotherapy against cancer (Ma et al., 2013; O'Neill et. al., 2015;). Apart from that, the analysis of DCs morphology is important as the effect of food toxicology on the immune system and cancer can be assessed (Braiki et al., 2016). The previous and initial studies of DCs are expressed as novel and complex since they are Antigen-Presenting Cells (APCs) and capable in maintaining immunity against cancer by maintaining the B-cell function and recalling responses. Eventually, the intricacy of this disclosure can exhibit the microenvironment activity at the tumor site and provide a superior comprehension of DCs immunobiology as it is vital in designing or enhancing therapeutic approaches.
2.3 Dendritic Cells (DCs) Culture and Imaging
A great deal of attentiveness in DCs has been discovered to endeavor them in vaccine preparation for cancer immunotherapy. DCs are crucial to prompt immunity against cancer due to its roles as adjuvants for vaccines and direct therapy. The majority of experts demonstrate that DCs is beneficial in cancer therapy and thus, animal model has been frequently inspected in this field (Xu et al., 2007). However, several institutions are continuous to utilize DCs in human clinical exploratory to activate immunity to antigens against numerous common cancer (Tuana et al., 2011; Ma et al., 2013; Mohammadi et al., 2015). In perspective of DCs as a robust regulator of the immune system, much research is being directed to diagnose how DCs can be harnessed to induce immunity.
fractionation method is used (Miyahira, 2012). This layer is used to separate the blood to its component and this separation provide an accessible harvest of PBMCs. Since Erythrocytes are denser than 1.077 g/ml, they are removed during the fractionation. However, Basophils may be present in a small degree in the less dense PBMCs fraction. Based on the previous researches and experiences, Lymphocytes are normally in the range of 70-90% of PBMCs, Monocytes with 10-30% and DCs are composed of 1-2% of PBMCs (Miyahira, 2012).
There is a current pathway in observing DCs such as morphological identification. In the first procedure, DCs can be directly isolated from blood or originated in vitro from peripheral blood Monocytes or CD34+ bone marrow cells (Mohammadi et al., 2015; Tan et al., 2010). Consequently, immature DCs are generated with the presence of Granulocyte Macrophage colony-stimulating factor (GM-CSF) and Interleukin (IL)-4 before maturation process is completed by incubation with tumor necrosis factor (TNF)-α, stem cell factor, or FLT3 ligand (Tan
[image:29.595.176.460.401.574.2]et al., 2010). Figure 2.4 presents the passages of cell culture procedure for DCs.
Figure 2.4: DCs cultivated through several passages (Mohammadi et al., 2015)
Tan et al., (2010) conduct a comparison study of three different DCs
artificial means as their viability needs to be ensured. This is because the staining might able to kill the cells.
Therefore, the other possible approaches to view the cells is imagined through PCM. It is possible to observe the unstained DCs in details. PCM images are images that are taken to make highly transparent objects more visible, and it is normally used to visualize the intercellular structures (Tan et al., 2010). However, PCM faces a limitation when it is unable to distinguish the DCs consistently. In some cases, the image has low contrast which increases the difficulties in defining the tentacles of DCs (Yen Ruen et al., 2016). It can be concluded that the manual analysis and counting are time consuming and require a high degree of skill of the pathologist.
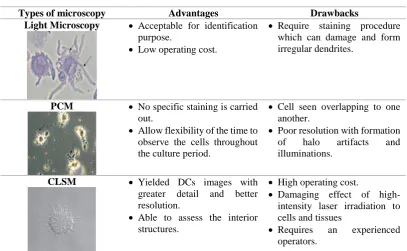
[image:30.595.113.521.499.750.2]Unlike PCM, CLSM can produce a better image as this tool is able to view the visual sections of intracellular structures (Suzuki et al., 1997). Following that, the cell structures and tissues can be explored in depth to acquire more understanding towards the cell study. Besides being a costly tool, CLSM also provides another drawback as this laser based tool is harmful to the cells and tissues (Fellers & Davidson, 2012). Table 2.2 compares the advantages and drawbacks of each modality used. During induction, the growth of DCs increase in term of size and develop into multiple cytoplasmic projections compared to their round and spherical features of precursor cells.
Table 2.2: Type of microscopy in DCs visualisation
Types of microscopy Advantages Drawbacks Light Microscopy Acceptable for identification
purpose.
Low operating cost.
Require staining procedure which can damage and form irregular dendrites.
PCM No specific staining is carried
out.
Allow flexibility of the time to observe the cells throughout the culture period.
Cell seen overlapping to one another.
Poor resolution with formation of halo artifacts and illuminations.
CLSM Yielded DCs images with greater detail and better resolution.
Able to assess the interior structures.
High operating cost.
Damaging effect of high-intensity laser irradiation to cells and tissues
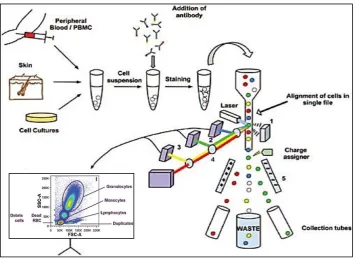
Other than that, the identification of circulating DCs also can be confirmed by using Flow Cytometry and it can be considered as a practical tool either in experimental or clinical studies of several pathological conditions (Hasskamp et al., 2005; Rovati et al., 2008; Mohammadi et al., 2015). Fluorochrome-based Flow Cytometry assays are utilized to analyse the maturation stage and their effects of culturing. The procedure is assessed through cell viability, necrosis, purity, phagocytic capacity and CD11c expression.
[image:31.595.142.498.420.680.2]Figure 2.5 shows the schematic process of Flow Cytometry in identifying and analyzing cells. The samples of PBMCs which are isolated from the patient body are processed and stained with fluorescence antibodies. This process is needed as the characterisation of the interest cells will initiate according to the fluorescent-labelled antibodies specific to cell-surface markers (Jahan-Tigh et al. 2012). Next, the staining cells are introduced to several stage for purpose of cells sorting in the Flow Cytometry such as 1) Forward Scatter Detector, 2) Side Scatter Detector, 3) Fluorescence Detector, 4) Filters and Mirrors and 5) Charged Deflection Plates (Jahan-Tigh et al. 2012).
Figure 2.5: Process in Flow Cytometry (Jahan-Tigh et al., 2012)
blood cells. Besides that, the fluorescence dyes used in the cell markers can contribute to the cell damage (Tan. et al., 2010). Although the utilization of this approach is considered as rapid and sensitive, the analysis of Flow Cytometry usually produces an extensive amount of data and information which can increase the complexity of the flow analysis (Jahan-Tigh et al., 2012).
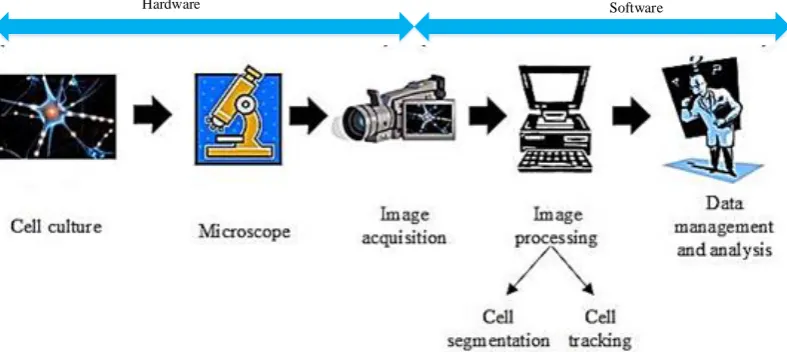
2.3.1 Commercial System for Dendritic Cells (DCs) Classifier
[image:32.595.126.520.346.522.2]Currently, a variety of frameworks is commercially available. These modalities are fundamentally integrated using a few stages of cell imaging as the image acquisition, and image processing as the cell classifier and analysis. The basic stages are shown in Figure 2.6.
Hardware Software
Figure 2.6: Basic cell imaging steps for systems and software (Juneau, 2015)
Figure 2.7: Cell size histogram in blood smear (LLC, 2015)
The processing time taken to perform these tasks is in less than 30 seconds per sample. The system uses an accurate cell membrane outline algorithm which produces the cell outline around each cell when the counting is completed. Figure 2.8 demonstrates the output of the Cellometer system showing counted cells which are indicated by green cell outlines. This practical algorithm provides a consistent identification of the desired cell population with reliable and accurate cell counts and size measurements as well (LLC, 2015). Apart from that, users can customize the cell size parameters, in which they have the capability to count only those cells that fall within the designated cell size.
[image:33.595.176.464.525.731.2]2.4 Current Technology in Cell Identification for PCM Image
In imaging fields, detecting DCs are still one of the novel approaches under investigation since they are unable to be identified through the microscope before staining process is applied. Therefore, other possible approaches are investigated through image processing methods.
Based on Figure 2.9, most of current developed cell recognition can be found in the related works for segmentation and classification of other cells under the PCM imaging (Bradbury & Wan, 2011; Usaj et al., 2011, Kang et al., 2012; Jaccard et al., 2014; Stoklasa et al., 2015. However, far too little attention has been paid to the DCs under PCM image. Currently, there are only one studies related to DCs identification (Yen Ruen et al., 2016). Most of the previous researchers focus on the other cells under PCM imaging. Figure 2.10 shows the basic stages which are applied in the overall process of cell identification in the PCM image.
2009 2017
Other cells DCs
2013
Ra et al., (2013) Chen et al., (2013)
Su et al., (2013)
2012
Kang et al., (2012) Yin et al., (2012) Seroussi et al., (2012)
2014
Jaccard et al., (2014) Alioscha-Perez et al., (2014)
Zhang et al., (2014)
2015
Stoklasa et al., (2015) Bensch & Ronneberger (2015)
Huang & Liu (2015)
2010
Bradbury & Wan (2010)
2011
Xiong et al., (2011)
Usaj et al., (2011) 2016
[image:34.595.119.512.387.517.2]Yen Ruen (2016)
Figure 2.9: Current trend on PCM image processing
Image Acquisition Filtering Thresholding Segmentation Feature Extraction Classification Pre-processing
[image:34.595.243.398.564.742.2]2.4.1 Image Preprocessing and Segmentation in PCM Imaging
[image:35.595.190.452.343.539.2]Acquiring and processing PCM images in cell imaging and high-throughput screening applications is still a challenge as the frameworks and algorithms used must be fast, simple to use and involves minimal intrusive (Juneau, 2015). Various challenges are identified in cell segmentation in PCM images. Overall, the drawbacks of PCM imaging can be categorized into 1) Low Image Contrast (Shade-Off); 2) Overlapping Cells and 3) Halo Region as shown in Figure 2.11. PCM converts small phase shifts in the light passing through a transparent specimen into amplitude or contrast changes in the image (Xiong et al., 2011). Thus, the specimen is visible with medium or dark grey features, surrounded by a bright halo and higher intensity of background for positive PCM.
Figure 2.11: Imaging artifacts in PCM image (Kang et al., 2012; Z. Yin et al., 2012)
2.4.1.1 Low Image Contrast
Generally, PCM images are deteriorated with low contrast between the cell region and image background that hinder image segmentation. Thus, various techniques have been applied to overcome the low image contrast problem. Usaj et al., (2011) apply Histogram Equalization to upgrade the contrast between cells and background. However, the technique provides poor results as noise can be observed in the background of the image as shown in Figure 2.12.
Overlapping cell
Halo region
Figure 2.12: Application of Histogram Equalization (Ambriz-Colin et al., 2006)
Following that, Jaccard et al., (2014) implements Global Threshold through Local Contrast Threshold (LCT) to solve non-illumination and low contrast image. The results found that Global Threshold such as Otsu segmentation is failed to be implemented in this problem as it is unable to discriminate the cell region from the background and tends to produce clumping segmentation between the cells. Based on the other application, Local Adaptive Threshold has a potential to overcome the challenge as it applies different threshold for each pixel according to the boundary information of neighbouring pixels (Singh et al., 2012).
Theoretically, pixel intensity variance recognizes the cells region and discriminate them from the background. However, this technique encounters a problem with clumped cells with a low boundary contrast (Ambriz-Colin et al., 2006). Zhang et al., (2014) has successfully solved the low boundary contrast within clumping cells by training a pixel based classifier to discriminate the boundaries of in-focus cells, out-of-in-focus cells and background. Meanwhile, Stoklasa et al., (2015) combine the classification of superpixels with the Region Growing method to locate cell boundaries. The result shows that the cell is unable to be detected if no detection marker is found for a particular cell and this problem arises whenever the cells exhibit low contrast.
discrimination between the cell background and foreground is clearly visualised. Subsequently, Su et al., (2013) proposes another promising method via a Semi-Supervised Clustering technique over phase retardation features to segment bright cells. The proposed method achieves more accurate segmentation in the variation of stages. However, false detections occur when cells are visualized in partially bright with dark regions. Figure 2.13(b) shows the result of Semi-Supervised Clustering in which the method is unable to detect the cell boundary which is contaminated with the bright region.
[image:37.595.119.523.253.432.2]a) b)
Figure 2.13: Results in: (a) Image Reconstruction (Yin et al., 2012) and (b) Semi-Supervised Clustering (Su et al., 2013)
Jaccard et al., (2014) propose Gaussian Kernel Filtering to smooth the image background and detect poor boundaries on PCM images of Mouse and Human Embryonic Stem Cells. Other cells include Chinese Hamster Ovary Cells, Human Neuroblastoma Cells and Yeast Cells. Figure 2.14(a) shows the result of Gaussian Kernel Filtering which provides a good cell detection in the pre-processing and cell segmentation.
asymmetric boundary cost as shown in Figure 2.14(b). The yellow boundary indicates the ground truth provided by the expert. Meanwhile, the red region refers to the cell segmentation by the proposed method.
a) Jaccard et al., (2014) b) Bensch & Ronneberger (2015) Figure 2.14: Results of Gaussian Kernel Filtering method
Another method which is Active Contour, also faces the problem of low contrast in the PCM images as poor results are retrieved if this method deals with fuzzy boundaries. Li et al., (2009) introduce the Front Vector Flow with Active Contour to guide the initial cell boundaries to the real boundaries. They found that in order to clearly identify the real boundaries, a high level feature of cells must be recognized first. The limitation arises when the noise or imprecise boundary detection exist as the method is normally sensitive to the initial position. Figure 2.15 shows the example of Active Contour application in PCM image in which the cell detection is imprecise due to its deficiency to discriminate the dark cell region from the bright part.
Later, an improvement has been implemented in Gradient Vector Flow (GVF) by Seroussi et al., (2012). They reveal that the gradient directionality of cellular boundaries contributes to a beneficial information towards the performance of cell segmentation. However, the flexibility of initialization is quite restricted for low contrast boundaries. Therefore, Huang & Liu (2015) improvise the method using Laplacian of Gaussian filter to integrate the Morphological Gray-Scale Reconstruction and LoG filter (MGRL-feature map) which is used to compute the external force field for the active contour. This method provides good detection boundaries in PCM images.
2.4.1.2 Overlapping Cells
Normally, cell segmentation faces a complex issue with a variation of cells structure and boundary, particularly in a tightly clumped region. Alioscha-Perez et al., (2014) and Stoklasa et al., (2015) introduce Watershed, which detects inner cell structures and cell membrane to match the geometric cell models. However, all of these studies have been seen to have delivered better results only on one cell population with a similar shape. Figure 2.16 shows the example of Watershed method which is applied in PCM image to solve the overlapping problem. In the type of PCM images, the segmentation of overlapping DCs in PBMCs images has not been explored. Most of the previous works in PCM processing are focused on a single cell detection. Far too little attention has been paid to a variation of cell populations in the PCM image.
[image:39.595.136.508.545.712.2]a) Ground truth b) Watershed
2.4.1.3 Halo Region
PCM images also inherit imaging artifact such as halo regions. The cell ordinarily appears as dark region encompassed by minimal bright halo ring. Segmentation algorithms that treat PCM images as general natural images do not always provide good performances as the imaging mechanisms of microscopy and natural images are completely different in terms of image magnification and noises (Su et al., 2013).
[image:40.595.248.425.398.539.2]Bradbury & Wan (2010) present a robust segmentation approach which combines the Spectral and K-means Clustering approaches to remove halo regions around the cells. The image is modelled as a matrix graph and subsequently divided into the different regions by computing the appropriate eigenvector of the matrix graph with the K-means algorithm. The result shows that the halo region is handled well, but it produces poor segmentation as the cell boundaries are not fully covered. Figure 2.17 shows the segmentation results in which green, red and blue colour indicates the cell boundary detection.
Figure 2.17: Segmentation result of K-means method (Bradbury & Wan, 2010)
a) Original image b) Segmentation result Figure 2.18: Threshold segmentation via intensity profile curve (Kang et al., 2012)
In the present study, Jaccard et al., (2014) introduce Halo Removal method to correct halo artifacts typical of PCM images. Here, the direction of the gradient at each image location is determined through eight Kirsch filters in which they are tuned in four cardinals and four inter-cardinal directions. Next, cell pixels and halo locations are discriminate using an iterative algorithm. The robustness of this method shows that halo artifacts are successfully removed with high accuracy. However, this method is unable to solve the clumping cells in the overlapping condition. The result can be found in Figure 2.19 in which (a) and (b) indicate the original PCM image and halo removal method respectively. In Figure 2.19(b) the True Positive (TP) is labelled with yellow colour to represent the achievable of cell detection through this method.
[image:41.595.121.520.71.257.2]REFERENCES
Ali, J., Ahmad, A.R., George, L.E., Der, C.S. and Aziz, S. Red blood cell recognition using geometrical features. IJCSI Int. Journal of Computer Science Issues. 2013. 10(1): 90-94.
Al-Kubati, A.A.M., Saif, J.A. and Taher, M.A. Evaluation of Canny and Otsu image segmentation. Int. Conference on Emerging Trends in Computer and Electronics
Engineering. PSRC. 2012. pp. 23-25.
Alioscha-Perez, M., Willaert, R. and Sahli, H. A segmentation framework for phase contrast and fluorescence microscopy images. Int. Journal of Pattern Recognition
and Artificial Intelligence. 2014. 28(7): 1460013.
Aljarrah, I.A., Ghorab, A.S. and Khater, I.M. Object recognition system using template matching based on signature and principal component analysis. Int. Journal of
Digital Information and Wireless Communications (IJDIWC). 2012. 2(2):
156-163.
Ambriz-Colin, F., Torres-Cisneros, M. and Debeir, O. Detection of biological cells in phase-contrast microscopy images. Fifth Mexican Int. Conference on Artificial
Intelligence. IEEE. 2006. pp. 68-77.
Avci, E. A new blood cell recognition algorithm based on directed vector method.
Journal of Applied Biological Sciences. 2015. 9(3): 18–20.
Bensch, R. and Ronneberger, O. Cell segmentation and tracking in phase contrast images using graph cut with asymmetric boundary costs. 12th Int. Symposium on
Biomedical Imaging (ISBI). IEEE. 2015. pp. 1220-1223.
Bhonsle, S. and Klinzmann, A., Park, F. Centroid Distance Function and the Fourier
Descriptor with Applications to Cancer Cell Clustering. Undergraduate Report.
University of California; 2011.
Bradbury, L. and Wan, J.W. A spectral k-means approach to bright-field cell image segmentation. Annual Int. Conference of the IEEE Engineering in Medicine and
Braiki, M., Benzinou, A., Nasreddine, K., Labidi, S. and Hymery N. Segmentation of dendritic cells from microscopic images using mathematical morphology. Second Int. Conference on Advanced Technologies for Signal and Image Processing.
IEEE. 2016. pp. 282-287.
Chen, S., Zhao, M., Wu, G., Yao, C. and Zhang, J. Recent advances in morphological cell image analysis. Computational and Mathematical Methods in
Medicine, 2012. 2012: 101536.
Chen, C., Wang, W., Ozolek, J.A. and Rohde, G.K. A flexible and robust approach for segmenting cell nuclei from 2D microscopy images using supervised learning and template matching. Cytometry Part A. 2013. 83(5): 495-507.
Curry MD, Choladda Vejabhuti. (2015). Differential Blood Count: Reference Range,
Interpretation, Collection and Panels [online]. Retrieved on October 20, 2015,
from http://emedicine.medscape.com/article/2085133-overview
Dalitz, C., Brandt, C., Goebbels, S. and Kolanus, D. Fourier descriptors for broken shapes. EURASIP Journal on Advances in Signal Processing. 2013. 2013(1): 1-11.
Davies, E.R. Machine Vision: Theory, Algorithms, Practicalities. Elsevier. 2004. Fellers, T.J. and Davidson M.W. (2012). Introduction to Confocal Microscopy
[online]. Retrieved on March 3, 2016, from http://www.olympusmicro.com/ primer/techniques/confocal/confocalintro.html
Ferenbach, D. and Hughes, J. Macrophages and dendritic cells: what is the difference? Kidney International. 2008. 74(1): 5-7.
Feudjio, C.K., Tiedeu, A., Noubeg, M.L., Gordan, M., Vlaicu, A. and Domngang, S. Extracting and smoothing contours in mammograms using fourier descriptors. Journal of Biomedical Science and Engineering. 2014. 7(3):119-129. Frejlichowski, D. An experimental comparison of seven shape descriptors in the general shape analysis problem. Int. Conference Image Analysis and Recognition. Springer Berlin Heidelberg. 2010. pp. 294-305.
Ghosh, M., Das, D., Mandal, S., Chakraborty, C., Pala, M., Maity, A.K., Pal, S.K. and Ray, A.K. Statistical pattern analysis of white blood cell nuclei morphometry.
Students' Technology Symposium (TechSym), IEEE. 2010. pp. 59-66.
classification. Journal of Theoretical and Applied Computer Science. 2013. 7(1): 20-35.
Hasskamp, J.H., Zapas, J.L. and Elias, E.G. Dendritic cell counts in the peripheral blood of healthy adults. American Journal of Hematology, 2005. 78(4): 314-315. He, K., Sun, J. and Tang, X. Guided image filtering. IEEE Transactions on Pattern
Analysis and Machine Intelligence. 2013. 35(6): 1397-1409.
Heiberger, R.M. and Neuwirth, E. One-way anova. In: R through Excel. Springer New York. pp. 165-179; 2009.
Heine, G.H., Ortiz, A., Massy, Z.A., Lindholm, B., Wiecek, A., Martínez-Castelao, A., Covic, A., Goldsmith, D., Süleymanlar, G., London, G.M. and Parati, G. Monocyte subpopulations and cardiovascular risk in chronic kidney disease. Nature reviews Nephrology. 2012. 8(6): 362-369.
Hiremath, P.S., Bannigidad, P. and Geeta, S. Automated identification and classification of white blood cells (leukocytes) in digital microscopic images. IJCA Special Issue on “Recent Trends in Image Processing and Pattern
Recognition” RTIPPR. 2010. (2): 59-63.
Huang, Y. and Liu, Z. Segmentation and tracking of lymphocytes based on modified active contour models in phase contrast microscopy images. Computational and
Mathematical Methods in Medicine. 2015. 2015:1-9
IMDC, Innovate Malaysia Design Competition. (2015). Cancer Research Malaysia
Design Challenge [online]. Retrieved on September 16, 2015, from
http://innovate.dreamcatcher.asia/ page_01. Html
Jaccard, N., Griffin, L.D., Keser, A., Macown, R.J., Super, A., Veraitch, F.S. and Szita, N. Automated method for the rapid and precise estimation of adherent cell culture characteristics from phase contrast microscopy images. Biotechnology and
Bioengineering. 2014. 111(3): 504-517.
Jafari, A.A., Mardani-Fard, H.A. and Sadooghi-Alvandi, S.M. One-way ANOVA with unequal variances. Communications in Statistics-Theory and Methods. 2012. 41(22): 4200-4221.
Jahan-Tigh, R.R., Ryan, C., Obermoser, G. and Schwarzenberger, K. Flow cytometry. Journal of Investigative Dermatology. 2012. 132(10): e1.
Juneau, P.M. New Algorithms for the Analysis of Live-Cell Images Acquired in Phase
Kang, M.S., Lee, J.E., Kim, H.R. and Kim, M.H. Classification of tumor cells in phase-contrast microscopy image using fourier descriptor. Journal of Biomedical
Engineering Research. 2012 33(4): 169-176.
Kang, M.S., Song, S.M., Lee, H. and Kim, M.H. Cell morphology classification in phase contrast microscopy image reducing halo artifact. In SPIE BiOS. International Society for Optics and Photonics. 2012. pp. 82271I-82271I.
Kaur, H. and Kaur, L. Performance comparison of different feature detection methods with gabor filter. Int. Journal of Science and Research (IJSR). 2014. 3(5): 1879-1886
Kurita, H. and Masuda, R. Application of the gabor filters and k‐means method for characterization of geometrical properties of parenchyma cell walls. Journal of
Texture Studies. 2012. 43(5): 339-349.
Landolt, N.T.K., Lakhonphon, S. and Ananworanich, J. Contraception in HIV-Positive Female Adolescents. AIDS Research and Therapy. 2011. 8(1): 1.
Le Douce, V., Herbein, G., Rohr, O. and Schwartz, C. Molecular mechanisms of HIV-1 persistence in the monocyte-macrophage lineage. Journal of Retrovirology. 2010. 7(32):1-16.
Li, F., Zhou, X., Zhao, H. and Wong, S.T. Cell segmentation using front vector flow guided active contours. Int. Conference on Medical Image Computing and
Computer-Assisted Intervention. Springer Berlin Heidelberg. 2009. pp. 609-616.
LLC, Nexcelom Bioscience (2003). Cell Size Assay and Cell Counting Based on Cell
Size Range [online]. Retrieved on October 23, 2015, from
http://www.nexcelom.com/Applications/cell-size-assay.php
Ma, Y., Shurin, G.V., Peiyuan, Z. and Shurin, M.R. Dendritic cells in the cancer microenvironment. Journal of Cancer. 2013. 4(1): 36-44.
Majurski, M., Zheng, C., Chalfoun, J., Dima, A. and Brady, M. Comparison of shape signature sub-sampling methods for cell tracking. Bioimage Informatics
Conference. NIST. 2015. pp. 3-7.
Mellman, I., Coukos, G. and Dranoff, G. Cancer immunotherapy comes of age. Nature. 2011. 480(7378): 480-489.
Miyahira, A. (2012). Types of Immune Cells Present in Human PBMC - Sanguine Bio
Researcher Blog [online]. Retrieved on October 19, 2015, from http://
Mohammadi, A., Mehrzad, J., Mahmoudi, M., Schneider, M. and Haghparast, A. Effect of culture and maturation on human monocyte-derived dendritic Cell surface markers, necrosis and antigen binding. Biotechnic & Histochemistry. 2015. 90(6): 445-452.
Morse, B.S. Lecture13: Edge Detection. Brigham Young University; 2003.
O'Neill, D.W., Adams, S. and Bhardwaj, N. Manipulating dendritic cell biology for the active immunotherapy of cancer. Blood. 2015. 104(8): 2235-2246.
Phukpattaranont, P., Kayasut, K., Boonyaphiphat, P. and Limsiroratana, S. Computer aided system for nuclear stained breast cancer cell counting. Breast
Cancer-Recent Advances in Biology, Imaging and Therapeutics. INTECH Open Access
Publisher. 2011. pp. 329.
Ra, H.K., Kim, H., Yoon, H.J., Son, S.H., Park, T. and Moon, S. A robust cell Counting approach based on a normalized 2D cross-correlation scheme for in-line holographic images. Lab on a Chip. 2013. 13(17): 3398-3409.
Raïch-Regué, D., Glancy, M. and Thomson, A.W. Regulatory dendritic cell therapy: from rodents to clinical application. Immunology Letters. 2014. 161(2): 216-221. Rovati, B., Mariucci, S., Manzoni, M., Bencardino, K. and Danova, M. Flow
cytometric detection of circulating dendritic cells in healthy subjects. European
Journal of Histochemistry: EJH. 2008. 52(1): 45.
Sarrafzadeh, O., Rabbani, H., Talebi, A. and Banaem, H.U. Selection of the best features for leukocytes classification in blood smear microscopic images. SPIE
Medical Imaging. International Society for Optics and Photonics. 2014. pp.
90410P-90410P.
Sasada, A., Takagi, M., Tabata, S., Abe, M. and Abe, H. A patient with stage IV gastric cancer who acquired complete remission after undergoing multi-peptide dendritic cell immunotherapy in combination with standard therapies. Personalized
Medicine Universe. 2015. 4: 70-72.
Seroussi, I., Veikherman, D., Ofer, N., YehudI‐Resheff, S. and Keren, K. Segmentation and tracking of live cells in phase‐contrast images using directional gradient vector flow for snakes. Journal of Microscopy. 2012. 247(2): 137-146. Sharma, M. and Chouhan, V. Objective Evaluation parameters of image segmentation
Silveira, G.F., Wowk, P.F., Machado, A.M.B., Dos Santos, C.N.D. and Bordignon, J. Immature dendritic cells generated from cryopreserved human monocytes show impaired ability to respond to LPS and to induce allogeneic lymphocyte proliferation. PloS one. 2013. 8(7): e71291.
Singh, T.R., Roy, S., Singh, O.I., Sinam, T. and Singh, K. A new local adaptive thresholding technique in binarization. International Journal of Computer
Science Issues. 2012. 8(6): 271–277.
Sokic, E. and Konjicija, S. Phase preserving fourier descriptor for shape-based image retrieval. In Signal Processing: Image Communication. 2016. 40: 82-96.
Stehman, S.V. Selecting and interpreting measures of thematic classification accuracy. Remote Sensing of Environment. 1997. 62(1): 77-89.
Stoklasa, R., Bálek, L., Krejči, P. and Matula, P. Automated cell segmentation in
phase-contrast images based on classification and region growing. 12th Int.
Symposium on Biomedical Imaging (ISBI). IEEE. 2015. pp. 1447-1451.
Su, H., Yin, Z., Huh, S. and Kanade, T. Cell segmentation in phase contrast microscopy images via semi-supervised classification over optics-related features. Medical Image Analysis. 2013. 17(7): 746-765.
Suzuki, T., Fujikura, K., Higashiyama, T. and Takata, K. DNA staining for fluorescence and laser confocal microscopy. Journal of Histochemistry &
Cytochemistry. 1997. 45(1): 49-53.
Taherisadr, M., Nasirzonouzi, M., Baradaran, B. and Mehdizade, A. New approach to red blood cell classification using morphological image processing. Shiraz
E-Medical Journal. 2013. 14(1): 44-53.
Tan, Y.F., Leong, C.F. and Cheong, S.K. Observation of dendritic cell morphology under light, phase-contrast or confocal laser scanning microscopy. The Malaysian
Journal of Pathology. 2010. 32(2): 97-102.
Tian, D.P. A review on image feature extraction and representation techniques. International Journal of Multimedia and Ubiquitous Engineering. 2013. 8(4): 385-396.
Tomari, R., Zakaria, W.N.W., Jamil, M.M.A., Nor, F.M. and Fuad, N.F.N. Computer aided system for red blood cell classification in blood smear image. Procedia
Computer Science. 2014. 42: 206-213.
Fall; 2006.
Usaj, M., Torkar, D., Kanduser, M. and Miklavcic, D., 2011. Cell counting tool parameters optimization approach for electroporation efficiency determination of attached cells in phase contrast images. Journal of Microscopy. 2011. 241(3): 303-314.
Usenik, P., Vrtovec, T., Pernuš, F. and Likar, B. Automated tracking and analysis of phospholipid vesicle contours in phase contrast microscopy images. Medical &
Biological Engineering & Computing. 2011. 49(8): 957-966.
Vale, A.M.P.G., Guerreiro, A.M.G., Dória Neto, A.D., Cavalvanti Junior, G.B., Leitão, V.C.L.T.D. and Martins, A.M. Automatic segmentation and classification of blood components in microscopic images using a fuzzy approach. Revista
Brasileira de Engenharia Biomédica. 2014. 30(4): 341-354.
Wieder, E. Dendritic Cells: A Basic Review. International Society for Cellular
Therapy. 2003. Retrieved September 23, 2015, from http://c.ymcdn.com/sites/
www.celltherapysociety.org/resource/resmgr/files/PDF/Resources/OnLine_Den dritic_Education_Brochure.pdf
Xiong, W., Chia, S.C., Lim, J.H., Shvetha, S. and Ahmed, S. Detection of unstained living neurospheres from phase contrast images with very large illumination variations. Annual Int. Conference of the IEEE Engineering in Medicine and
Biology Society. IEEE. 2011. pp. 6154-6157.
Xu, H., Dawson, R., Forrester, J.V. and Liversidge, J. Identification of novel dendritic cell populations in normal mouse retina. Investigative Ophthalmology & Visual
Science. 2007. 48(4): 1701-1710.
Yen Ruen, L., En Sheng, L., Hai Seng, O. and Mat Isa, N.A. Dendritic cell classification imaging system. 2016 Innovate Malaysia Design Conference. 2016. IMDCon. pp.145-160.
Yin, J., Li, H., Du, J. and He, P. Low illumination image retinex enhancement algorithm based on guided filtering. 3rd Int. Conference on Cloud Computing and
Intelligence Systems. IEEE. 2014. pp. 639-644.
Yin, Z., Kanade, T. and Chen, M. Understanding the phase contrast optics to restore artifact-free microscopy images for segmentation. Medical Image Analysis. 2012. 16(5):1047-1062.
fourier and wavelet analysis. Chinese Journal of Aeronautics. 2014. 27(1): 160-168.
Zhang, C., Huber, F., Knop, M. and Hamprecht, F.A. Yeast cell detection and segmentation in bright field microscopy. 11th Int. Symposium on Biomedical