ISSN Online: 2333-9721 ISSN Print: 2333-9705
Selection for Litter Size Variability: Effect on
Evolution of Body Condition
María Luz García1*, Eddy Wilfredo Calle2, María José Argente1
1Departamento de Tecnología Agroalimentaria, Universidad Miguel Hernández de Elche, Orihuela, Spain
2Institute for Animal Science and Technology, Universitat Politècnica de València, Valencia, Spain
Abstract
A divergent selection experiment for litter size variability has been carried out suc-cessfully in rabbits. The aim of this work was to determine the evolution of body weight and perirenal fat thickness throughout the productive lifespan of females in the high litter size variability (H) line and the low litter size variability (L) line. The traits measured in females from both the H and L lines were body weight and peri-renal fat thickness at the first mating and delivery, the second mating and delivery, and the last mating. Statistical analyses were performed using Bayesian methods. The H and L lines showed similar body weights in the first and second reproductive cycles. However, the L line exhibited higher perirenal fat thickness than the H line at the second delivery (9.19 mm vs. 9.00 mm, respectively P = 87%), despite having al-most one young rabbit more at birth. At the end of reproductive life, the H line had a 4.4% higher body weight and a 3.4% higher perirenal fat thickness than the L line. In conclusion, decreasing litter size variability improves the mobilisation and manage-ment of body fat reserves in females from the second reproductive cycle.
Subject Areas
Genetics
Keywords
Body Weight, Litter Size Variability, Perirenal Fat Thickness, Reproductive Life
1. Introduction
The body condition is a common reference of the energy status of the animal. In addi-tion to body weight, other measurements have been used to estimate the body condi-tion, such as the body condition score [1], the total body electric conductivity [2], the
How to cite this paper: García, M.L., Calle, E.W. and Argente, M.J. (2016) Selection for Litter Size Variability: Effect on Evolution of Body Condition. Open Access Library Journal, 3: e3006.
http://dx.doi.org/10.4236/oalib.1103006
Received: September 7, 2016 Accepted: September 24, 2016 Published: September 27, 2016
Copyright © 2016 by authors and Open Access Library Inc.
This work is licensed under the Creative Commons Attribution International License (CC BY 4.0).
computer tomography [3], the bioelectrical impedance analysis [4], and the perirenal fat thickness [5]. Several authors have studied the evolution of the body condition of rabbit females to understand their productivity and longevity [1] [6]-[9].
A divergent selection experiment for litter size variability has been carried out suc-cessfully in rabbits. After seven generations of selection, the low line was 30% more homogeneous in terms of litter size than the high line [10]. Our hypothesis is that the low line is more consistent in numerical productivity due to a lower sensitivity to stress and disease [11] and better mobilisation of body reserves. It has been observed that a decline in body condition decreases fertility in rabbit [12], pigs [13], and cows [14]; the quality of oocytes in pigs [13], and cows [14]; and the embryo survival rate in pigs [15], and lactating dairy cows [16]. In order to improve our knowledge of patterns of mobi-lization of body reserves during reproduction, it is necessary to understand the effect of selection for litter size variability on body condition. The aim of this work was therefore to determine the evolution of the body weight and perirenal fat thickness throughout the productive lifespan of females selected to increase and decrease the litter size varia-bility.
2. Materials and Methods
All experimental procedures involving animals were approved by the Miguel Hernández University of Elche Research Ethics Committee (Reference number DTA-MJA-001-11), according to Council Directives 98/58/EC and 2010/63/EU.
2.1. Animals
The animals came from the seventh generation of a divergent selection experiment for litter size variability. Data from 83 females of the high line (H) and 74 females of the low line (L) were used. Variability of litter size was estimated as the phenotypic va-riance of litter size within female after correcting for the effects of year-season and lac-tation status [10]. The H and L lines were selected for increasing and decreasing the va-riability of litter size, respectively. All animals were raised on a farm at the Miguel Hernández University of Elche (Spain), where they were fed with a standard commer-cial diet (218 g acid detergent fibre, 174 g crude protein per kg of dry matter and 11.0 MJ digestible energy; Cunilactal, Nutreco). Food and water were provided ad libitum. Throughout the experiment, the females were kept in individual cages under a constant photoperiod of 16 h of continuous light: 8 h of continuous darkness with controlled ventilation. They were first mated at 18 wk of age and at 10 d after parturition thereaf-ter. The litters were not standardised.
2.2. Traits
ultra-sound equipment.
2.3. Statistical Analysis
Differences between lines were estimated using a model including the effects of the line-physiological stage (10 levels: first mating and delivery, second mating and delivery and last mating for the H and L lines); season (4 levels: winter, summer, spring, au-tumn); lactation status at mating (nulliparous, lactating and non-lactating); permanent effect of the doe; and the error.
All analyses were performed using Bayesian methodology. Bounded uniform priors were used for all effects with the exception of the permanent doe effect, considered in-dependently normally distributed with mean 0 and variance 2
p
Iσ . Residuals were a
priori independently normally distributed with mean 0 and variance 2
e
Iσ . The priors
for the variances were also bounded uniform. Features of the marginal posterior distri-butions for all unknowns were estimated using Gibbs sampling. The program Rabbit developed by the Institute for Animal Science and Technology (Valencia, Spain) was used for all procedures. After some exploratory analyses, we used a chain of 60,000 samples, with a bur-in period of 10,000. Only 1 of every 10 samples was saved for infe-rences. Convergence was tested using the Z criterion of Geweke [18], and Monte Carlo sampling errors were computed using the time-series procedures described in [19].
3. Results and Discussion
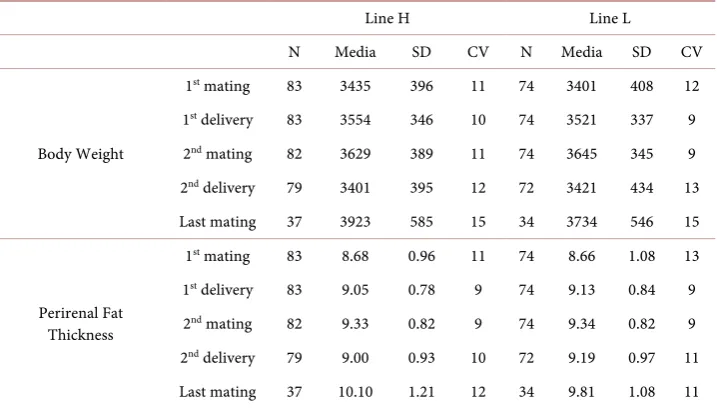
Table 1 shows the descriptive parameters of the H and L lines selected for litter size va-riability. The body weight ranged from 3401 g to 3923 g, and the perirenal fat thickness ranged from 9.0 mm to 10.10 mm. The females were lighter than other maternal lines [8] [20]. Nevertheless, the perirenal fat thickness was higher [8]. Body weight and peri-renal fat thickness showed low variability (CV) throughout the reproductive lives of the doe.
Table 2 displays the features of the estimated marginal posterior distributions of the differences between lines for body weight and perirenal fat thickness. Marginal post-erior distributions were approximately normal, so mode, mean and median were therefore similar. All Monte Carlo standard errors were very low, and the Geweke test did not detect a lack of convergence. After seven generations of selection for litter size variability, the body condition was similar in both lines from the first mating to the second mating. Nevertheless, the L line showed a higher perirenal fat thickness than the H line (DH−L = −0.17 mm; P = 87%) at the second delivery. Note that the L line
Figure 1 and Figure 2 show the body weight and perirenal fat thickness throughout the rabbits’ reproductive lives in each line. The body weight and perirenal fat thickness increased in both lines from the first mating to the first delivery (3.1% and 3.8% in the H line; 2.7% and 4.6% in the L line, respectively) and from the first delivery to the second mating (4.8% and 12.6% in the H line and 6.1% and 11.4% in the L line). Fe-males were first mated at 18 weeks of age when they reached 75% of their adult body weight. During the first and second reproductive cycles, the females therefore contin-ued to grow, with increased body weight and accumulated body reserves.
Table 1. Media, standard deviation (SD) and coefficient of variance (CV) of body weight (g) and perirenal fat thickness (mm) for the High (H) and the Low (L) lines selected on litter size varia-bility.
Line H Line L
N Media SD CV N Media SD CV
Body Weight
1st mating 83 3435 396 11 74 3401 408 12
1st delivery 83 3554 346 10 74 3521 337 9
2nd mating 82 3629 389 11 74 3645 345 9
2nd delivery 79 3401 395 12 72 3421 434 13
Last mating 37 3923 585 15 34 3734 546 15
Perirenal Fat Thickness
1st mating 83 8.68 0.96 11 74 8.66 1.08 13
1st delivery 83 9.05 0.78 9 74 9.13 0.84 9
2nd mating 82 9.33 0.82 9 74 9.34 0.82 9
2nd delivery 79 9.00 0.93 10 72 9.19 0.97 11
[image:4.595.194.555.493.682.2]Last mating 37 10.10 1.21 12 34 9.81 1.08 11
Table 2. Features of the estimated marginal posterior distribution of the differences between the high (H) and low (L) lines selected for litter size variability.
DH−L HPD95% P(%)
Body Weight (g)
1st mating 24 −105, 147 65
1st delivery 36 −93, 158 71
2nd mating −5 −130, 121 53
2nd delivery −18 −147, 108 61
Last mating 167 9, 330 98
Perirenal Fat Thickness (mm)
1st mating −0.01 −0.28, 0.29 53
1st delivery −0.09 −0.37, 0.19 73
2nd mating 0.01 −0.27, 0.29 53
2nd delivery −0.17 −0.46, 0.12 87
Last mating 0.34 −0.05, 0.74 95
DH−L: median of difference between the high and low lines. HPD95%: highest posterior density region at 95%. P:
Figure 1. Median of the estimated marginal posterior distributions and highest posterior density region at 95% (bars)of body weight at first mating and delivery (BW1m, BW1d), at second mating and delivery (BW2m, BW2d) and at last mating (BWlm) in the high (H) and low (L) lines selected for litter size variability.
Figure 2. Median of the estimated marginal posterior distributions and highest posterior density region at 95% (bars) of perirenal fat thickness at first mating and delivery (PFT1m, PFT1d), at second mating and delivery (PFT2m, PFT2d) and at last mating (BWlm) in the high (H) and low (L) lines selected for litter size variability.
[image:5.595.207.543.342.555.2]de-creased 4.3% in the H line and 2.4% in the L line. As a result, the L line had more body reserves to cope with the demands of the second lactation.
This is the first time that a divergent selection experiment for litter size variability in rabbits has being carried out, so it is not possible to compare results with other experi-ments. Nevertheless, selection for increasing longevity and litter size at weaning has resulted in animals with more robustness or lower environmental sensitivity [8], which may have been mediated by higher body energy reserves such as the line selected by lower litter size variability. Sánchez et al. [7] showed that the body condition greatly in-fluences the risk of getting any disease as coryza, mastitis and ulcerative pododermati-tis, thus an increase in the body energy reserves leads to reductions in prevalence of these diseases. Moreover, we know that the resilience of the females, their ability to face an aggression, is genetically related to litter size variability, the homogenous line copes with the aggression of external agents better than the heterogeneous one [11], and it has consequences in animal welfare [23].
4. Conclusion
Selection for litter size variability did not affect the female’s body condition in the first reproductive cycle. In the second reproductive cycle, however, decreased litter size va-riability improved the mobilisation and management of body fat reserves. These results are consistent with the higher resilience in females selected to decrease litter size varia-bility.
Acknowledgements
This work was supported by projects of the Plan Nacional de Investigación AGL2011- 29831-C03-02 and AGL2014-55921-C2-2-P. Eddy W. Calle was supported by a research grant within the Babel project from Erasmus Mundus programme.
References
[1] Cardinali, R., Dal Bosco, A., Bonanno, A., Di Grigoli, A., Rebollar, P.G., Lorenzo, P.L. and Castellini, C. (2008) Connection Between Body Condition Score, Chemical Characteristics of Body and Reproductive Traits of Rabbit Does. Livestock Science, 116, 209-215.
http://dx.doi.org/10.1016/j.livsci.2007.10.004
[2] Fortun-Lamothe, L., Lamboley-Gaüzère, B. and Bannelier, C. (2002) Prediction of Body Composition in Rabbit Females Using Total Body Electrical Conductivity (TOBEC). Lives-tock Production Science, 78, 133-142. http://dx.doi.org/10.1016/S0301-6226(02)00087-8
[3] Romvári, R., Szendro, Z.S., Jensen, J.F., Sβrensen, P., Milisits, G., Bogner, P., Horn, P. and Csapó, J. (1998) Noninvasive Measurements of Body Composition of Two Populations be-tween 6 and 16 Weeks of Age by Computer Tomography. Journal of Animal Breeding and Genetics, 115, 383-395. http://dx.doi.org/10.1111/j.1439-0388.1998.tb00359.x
[4] Nicodemus, N., Pereda, N., Romero, C. and Rebollar, P.G. (2009) Évaluation de la Tech-nique D’impédance Bioélectrique (IBE) Pour Estimer la Composition Corporelle de Lapi-nesReproductrices. Proceedings 13 èmes Journées de la Recherche Cunicole, Le Mans, France, 109-112.
Ultrasound Measurement of Perirenal Fat Thickness to Estimate Changes in Body Condi-tion of Young Rabbits. Animal Science, 70, 435-442.
http://dx.doi.org/10.1017/S135772980005178X
[6] Rebollar, P.G., Pérez-Cabal, M.A., Pereda, N., Lorenzo, P.L., Arias-Álvarez, M. and García- Rebollar, P. (2009) Effects of Parity Order and Reproductive Management on the Efficiency of Rabbit Productive System. Livestock Science, 121, 227-233.
http://dx.doi.org/10.1016/j.livsci.2008.06.018
[7] Sanchez, J.P., de la Fuente, L.F. and Rosell, J.M. (2012)Health and Body Condition of Lac-tating Females on Rabbit Farms. Journal Animal Science, 90, 2353-2361.
http://dx.doi.org/10.2527/jas.2011-4065
[8] Theilgaard, P., Sánchez, J.P., Pascual, J.J., Berg, P., Friggens, N.C. and Baselga A. (2007) Late Reproductive Senescence in a Rabbit Line Hyper Selected for Reproductive Longevity, and Its Association with Body Reserves. Genetic Selection Evolution, 39, 207-223.
http://dx.doi.org/10.1186/1297-9686-39-2-207
[9] Theilgaard, P., Baselga A., Blas E., Friggens, N.C., Cervera, C. and Pascual, J.J. (2009) Dif-ferences in Productive Robustness in Rabbits Selected for Reproductive Longevity or Litter Size. Animal, 3, 637-646. http://dx.doi.org/10.1017/S1751731109003838
[10] Argente, M.J., García, M.L., Muelas, R. and Blasco, A. (2014) Effect of Selection for Residual Variance of Litter Size on Components of Litter Size in Rabbits. Proceedings of 10th World Congress on Genetics Applied to Livestock Production, Vancouver, 149.
[11] Argente, M.J., García, M.L., Zbynovska, K., Petruska, P., Capcarova, M. and Blasco, A. (2014) Effect of Selection for Residual Variance of Litter Size on Hematology Parameters as Immunology Indicators in Rabbits. Proceedings of 10th World Congress on Genetics Ap-plied to Livestock Production, Vancouver, 631.
[12] Castellini, C., Dal Bosco, A., Arias-Alvarez, M., Lorenzo, P.L., Cardinali, R. and Rebollar, P.G. (2010) The Main Factors Affecting the Reproductive Performance of Rabbit Roes: A Review. Animal Reproduction Science, 122, 174-182.
http://dx.doi.org/10.1016/j.anireprosci.2010.10.003
[13] Zak, L.J., Xu, X., Hardin, R.T. and Foxcrot, G.R. (1997) Impact of Different Patterns of Feed Intake during Lactation in the Primiparous Sow on Follicular Development and Oocyte Maturation. Journal of Reproduction and Fertility, 110, 99-106.
http://dx.doi.org/10.1530/jrf.0.1100099
[14] Van Hoeck, V., Bols, P.E., Binelli, M. and Leroy, J.L. (2014) Reduced Oocyte and Embryo Quality in Response to Elevated Non-Esterified Fatty Acid Concentrations: A Possible Pathway to Subfertility? Animal Reproduction Science, 149, 9-29.
http://dx.doi.org/10.1016/j.anireprosci.2014.07.015
[15] Hoving, L.L., Soede, N.M., Feitsm, H. and Kemp, B. (2012) Lactation Weight Loss in Pri-miparous Sows: Consequences for Embryo Survival and Progesterone and Relations with Metabolic Profiles. Reproduction in Domestic Animals, 47, 1009-1016.
http://dx.doi.org/10.1111/j.1439-0531.2012.02007.x
[16] Carvalho, P.D., Souza, A.H., Amundson, M.C., Hackbart, K.S., Fuenzalida, M.J., Herlihy, M.M., Ayres, H., Dresch, A.R., Vieira, L.M., Guenther, J.N., Grummer, R.R., Fricke, P.M., Shaver, R.D. and Wiltbank, M.C. (2014) Relationships between Fertility and Postpartum Changes in Body Condition and Body Weight in Lactating Dairy Cows. Journal of Dairy Science, 97, 1-18. http://dx.doi.org/10.3168/jds.2013-7809
[18] Sorensen, D. and Gianola, D. (2002) Likelihood, Bayesian, and MCMC Methods in Quan-titative Genetics. Springer Science and Business Media, New York.
http://dx.doi.org/10.1007/b98952
[19] Geyer, C.J. (1992) Practical Markow Chain Monte Carlo. Statistical Science, 7, 473-483.
http://dx.doi.org/10.1214/ss/1177011137
[20] Pascual, M., Calle, E.W. and Blasco, A. (2015) Comparison of Degrees of Maturity of Rabbit Lines Selected for Different Traits. World Rabbit Science, 23, 155-144.
http://dx.doi.org/10.4995/wrs.2015.3964
[21] Pascual, J.J., Cervera, C., Blas, E. and Fernández-Carmona, J. (2003) High-Energy Diets for Reproductive Rabbit Does: Effect of Energy Source. Nutrition Abstracts and Reviews Series B: Livestock Feeds and Feeding, 73, 27R-39R.
[22] Buchmiller-Crair, T.L., Gregg, J.P., Rivera Jr., F.A., Choi, R.S., Diamond, J.M. and Fonkal-srud, E.W. (2001) Delayed Disaccharides Development in a Rabbit Model of Intrauterine Growth Retardation. Pediatric Research, 50, 520-524.
http://dx.doi.org/10.1203/00006450-200110000-00016
[23] Broom, D.M. (2008) Welfare Assessment and Relevant Ethical Decisions: Key Concepts. Annual Review of Biomedical Sciences, 20, 79-90.
http://dx.doi.org/10.5016/1806-8774.2008.v10pt79
Submit or recommend next manuscript to OALib Journal and we will provide best service for you:
Publication frequency: Monthly
9 subject areas of science, technology and medicine Fair and rigorous peer-review system
Fast publication process
Article promotion in various social networking sites (LinkedIn, Facebook, Twitter, etc.) Maximum dissemination of your research work
Submit Your Paper Online: Click Here to Submit