© 2018, IRJET | Impact Factor value: 6.171 | ISO 9001:2008 Certified Journal | Page 1335
HYDROLOGIC ANALYSIS ON INSTANTANEOUS UINT HYDROGRAPH
USING CLARK’S METHOD
S. SatyaPriya
Senior Assistant Professor, Department of Civil Engineering, New Horizon college of Engineering, Bangalore, India
---***---
Abstract:
The scope of the study to develop a method to estimate Time of Concentration (Tc) and Storage Coefficient (R) to
develop Clark’s Instantaneous Unit Hydrograph (CIUH). Tc is estimated from Time Area Diagram of the catchment and R is
determined using optimization approach based on Downhill Simplex technique (code written in FORTRAN). Four different objective functions are used in optimization to determine R. The sum of least squares objective function is used in a novel way by relating it to slope of a linear regression best fit line drawn between observed and simulated peak discharge values to find R. Physical parameters (delineation, land slope, stream lengths and associated drainage areas) of the catchment are derived from SPOT satellite imageries of the basin using ERDAS: Arc GIS is used for geographic data processing. Ten randomly selected rainfall–runoff events are used for calibration and five for validation. Using CIUH, a Direct surface runoff hydrograph (DSRH) is developed. Kaha catchment (5,598 km2), part of Indus river system, located in semi-arid region of Pakistan and dominated by hill torrent flows is
used to demonstrate the applicability of proposed approach. Model results during validation are very good with model efficiency of more than 95% and root mean square error of less than 6%. Impact of variation in model parameters Tc and R on DSRH is
investigated. It is identified that DSRH is more sensitive to R compared to Tc. Relatively equal values of R and Tc reveal that shape
of DSRH for a large catchment depends on both runoff diffusion and translation flow effects. The runoff diffusion effect is found to be dominant.
Keywords:
Time of Concentration, Storage Coefficient, ERDAS, Arc GIS, DSRHINTRODUCTION
Unit hydrograph is a hydrograph for which the height of runoff is equal to one. It means that if we divide the volume of the runoff to the related basin area we get "one" for height of the runoff. The special thing about the Unit Hydrograph is that it enables us to derive the Hydrograph of design flood, based on which the hydraulic structure is to be designed. In Instantaneous Unit Hydrograph the effect of time is neglected (duration=0 h) and a unique Unit Hydrograph for the given basin would be constructed[1]. The advantage of using Instantaneous Unit Hydrographs over the Unit Hydrographs is that Instantaneous Unit
Hydrographs are only related to the effective rainfall, therefore in the process of analysis one of the parameters would be eliminated. As the result, using Instantaneous Unit Hydrographs, for investigation on the rainfall-runoff of a basin, is much suitable than using Unit Hydrographs. Making use of GIS in river engineering has gained extreme development in recent decays, in such a way that all softwares used in this branch has the direct capability of GIS, or the capability of connecting to one of the softwares that GIS has provided[2]. With respect to what has been said and taking into consideration the importance of the two
subjects of Instantaneous Unit Hydrograph and GIS, it is possible to provide an instrument with the ability of combining the two mentioned subjects as a unique and compatible system. This can be considered as an important step toward developing data systems, which can be used to improve the quality of services given to the clients. The aim of this research was to derive the Clark's Instantaneous Unit Hydrograph for the Kardeh river basin, in Khorasan province located in the northeast part of Iran, using the arcview GIS software.
Clark's instantaneous unit hydrograph
:
Clark has proposed a model for deriving Instantaneous Unit Hydrograph by using the idea of that the outflow hydrograph from any rainstorm will be transported directly in the river path while taking into account the storage effects of separate sub basins. By modeling the transportation of runoff directly through the river path up to the outflow point and using the results for finding the travel time, we can derive a hydrograph for which the storage effects has been eliminated. Then using this hydrograph for an imaginary basin having linear storage characteristic will include storage effects. Using these assumptions and the principal of continuity, Clark has derived an Instantaneous Unit Hydrograph for a basin while the value of inflow is provided by the following development of Unit Hydrograph using Clark modelThe routing equation takes the following form:
Oi = CIi + (1-C) Oi-1
© 2018, IRJET | Impact Factor value: 6.171 | ISO 9001:2008 Certified Journal | Page 1336 Ii = Inflow in cumecs from each area at the end of the period I and
C = Dimensionless routing constant.
The value of constant C is given by,
C = t/(R+0.5t)
Where t = Computational time interval in hours and
R = Storage coefficient in hours.
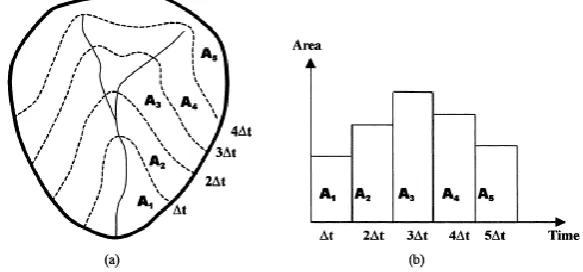
[image:2.596.151.443.247.383.2]R can be assigned average value of Q/d, Q/dt at the point of inflexion computed from observed flood hydrographs.
Figure 1: Calculation of runoff from catchment area
MATERIALS AND METHODS
The CWC Unit Hydrograph for Indian watersheds:
The various steps necessary to estimate the design flood hydrographs per recommendations of CWC (1986) are as given below:
Preparation of catchment Area plan: The point of interest is located on the survey of India toposheet and catchment boundary is delineated using ARC-GIS software. A catchment area delineated from the toposheet.
Determination of physiographic parameters: The following physiographic parameters were determined from the catchment area using ARC-GIS software.
Catchment Area(A)
Length of the main stream(L)
Length of the main stream from center of gravity of the catchment(Lc)
Equivalent stream slope(S)
S is to be determined using the elevation of the main stream at a number of significant points along it. Usually, the length of the stream from a point where an important tributary joins it up to another where the next tributary joins it called as a stream segment. S calculated as the average slope of all the stream segments and calculated using the expression
S= (∑Li (Di-1+Di))/L2 … (2.1)
Where Li is the length of ith segment in km, Di, Di-1 are the height above the datum (RL of the outlet of the basin) with respect of
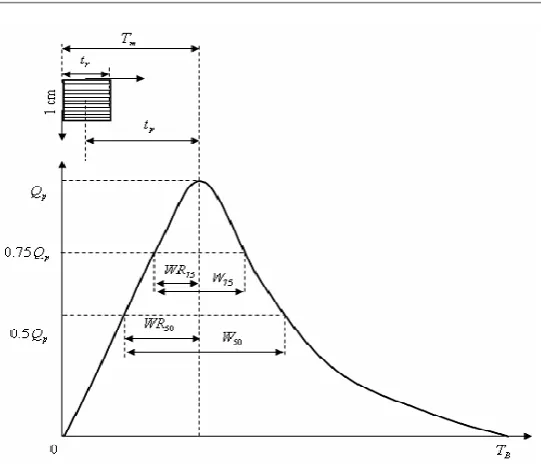
© 2018, IRJET | Impact Factor value: 6.171 | ISO 9001:2008 Certified Journal | Page 1337 Figure 2: Unit Hydrograph estimation
Unit graph produced due to one-centimeter depth of rainfall excess in tr-hr duration has been considered. The tr-hr synthetic
U.G parameters (fig 2) may be found out by using the following approach:
By using the Synthetic Relations
The following relationships have been used for estimating the 1-hr unit graph parameters of a catchment in the kaveri subzone-3(i):
Preparation of tr-hr Synthetic unit graph
As in the Snyder’s method, an approximate unit hydrograph is first drawn using the values of tp, QP, TB, etc. the ordinates at
suitable intervals are then determined from the graph. The Direct runoff (DRO) is then computed (as equal to area under the UHG divided by catchment area, A). If this is not equal to 1 cm, some minor changes is made in the ordinates to obtain the final synthetic UHG.
Assumptions and Limitations of CWC method
Assumptions
1. It is assumed that 50-year return period storm rainfall produces 50-year flood.
2. A generalized conclusion regarding the base flow and loss rate are assumed to hold good during the design flood event.
Limitations
1. The method is applicable for the catchment area ranging from 25sq.km to 1500 sq.km.
2. The data of 20 catchments has been considered for developing a generalized approach for large subzone. However, for more reliable relationships the data of more suitable catchments would be desirable.
3. The method would be applicable for reasonably free catchments with interception, if any, limited to 20% of the total catchment. For calculating the discharge, the total area of the catchment has to be considered.
© 2018, IRJET | Impact Factor value: 6.171 | ISO 9001:2008 Certified Journal | Page 1338 The above calculated trhr unit graph parameters are tabulated in the table below.
Table 1.0: Parameters of tr- hr. Unit Hydrograph for Suryanagara Watershed
The parameters got in the step 3 above were plotted to scale on a graph paper. The points were joined to fit a trial synthetic unit graph.
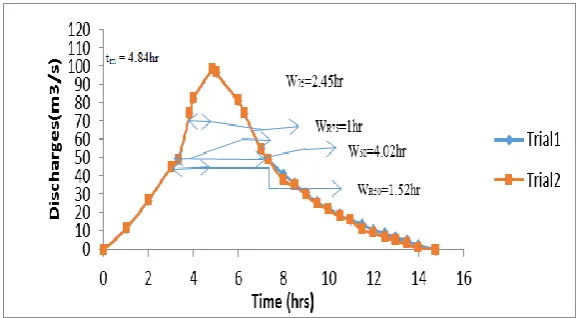
Preparation of tr-hr Synthetic unit graph: A unit hydrograph is drawn using the parameters of table 7. Recession curve is
[image:4.596.158.449.265.424.2]smoothened to obtain the direct runoff depth equal to 1cm as shown fig 6.5 below:
Figure 3: CWC Unit Hydrograph for the Suryanagara watershed
Table 1.1 : Dimensionless Unit Hydrograph
Suryanagara watershed
Time, T (hrs) Discharge, Q (m3/s) t/tp Q/Qp
0.00 0.00 0.00 0.00
1 11.5 0.23 0.12
2 27 0.46 0.27
3 45 0.69 0.46
3.32 49 0.76 0.50
3.84 74 0.88 0.75
4 82.5 0.92 0.84
4.84 98.28 1.12 1.00
5 96.5 1.15 0.98
6 81 1.38 0.82
6.29 74 1.45 0.75
7 55 1.69 0.56
7.34 49 1.84 0.50
8 41.5 1.96 0.39
8.5 36 2.07 0.36
9 31 2.19 0.31
9.5 26 2.30 0.25
10 22.5 2.42 0.22
10.5 19 2.53 0.18
11 16 2.65 0.16
11.5 14 2.76 0.11
12 11 2.88 0.09
12.5 9 3.00 0.07
13 6.5 3.11 0.05
13.5 5 3.23 0.03
14 2.5 3.41 0.01
14.78 0 0.00 0.00
tp (hr) qp m3/sec/km2 W50 (hr) W75 (hr) WR50 (hr) WR75 (hr) TB (hr) Tm (hr) Qp m3/sec
© 2018, IRJET | Impact Factor value: 6.171 | ISO 9001:2008 Certified Journal | Page 1339
CONCLUSION
In this study Instantaneous Unit Hydrograph was obtained using the capabilities of GIS. Time of basin concentration and slope of the basin were calculated more easily and accurately using GIS techniques in comparison with traditional methods. Curve-Number map was constructed using two types of maps, land-use and soil. Required parameters for determination of Clark's IUH were calculated with high precision using GIS techniques. Finally by comparison of calculated values by real observed values it was shown a good match between the two results.
REFERENCES
1. Alizadeh, A., 1995. Principles of Applied Hydrology. 1st Edn., Emam Reza Press, Mashhad, Iran.
2. Dayani, Sh. and K. Mohamadi, 2002. Estimation of river discharge in ungauged regions using GIS. Proceedings of the 6th International River Engineering Conference, (IREC'02), Ahvaz, Iran, pp: 1341-1348.
3. R. J. Dawson, L. Speight, J. W. Hall, S. Djordjevic, D. Savic and J. Leandro,2008, Attribution of flood risk in urban areas,Journal of Hydroinfirmatics10.4
4. Rahnama, M.B. and A. Karimi, 2001. GIS applications in water network. Proceedings of 1st National Conference on Water Crisis Mitigation Strategies, Mar. 9-10, Zabol University Sistan, Iran, pp: 165-165.
5. Vanrolleghem p.a,benedetti l ,meirlien l (2005) modelling and real-time control of the integrated urban wastewater system,enviromental modeling software, volume 20.issue 4 april