Partial Transmit Sequence used in OFDM to
Increase PAPR and Analysis of Phase Sequences
and Data Blocks
Ajay Kumar Jaiswa
M.Tech student Electronics & Telecom. Engg .
RCET, Bhilai
Chandrakant Kshyap
Assistant Professor
Electronics & Telecom. Engg RCET, Bhilai, India
Sunil R Gupta
Associate Professor
Electronics & Telecom. Engg RCET, Bhilai , India,
ABSTRACT
The high data rate transmission is the today’s most demanding parameter hence one of the popular technique used in the communication is OFDM. Partial transmit sequence (PTS) combining can improve the PAR statistics of an OFDM signal. For PTS, the search complexity increases exponentially with the num-ber of subblocks. Here, we present a new algorithm for computing the phase factors that achieves better performance than the exhaustive bi-nary search approach. We also investigate the effects of non-linear am-plifiers on the performance of the new algorithm, including the power spectral density and in-band distortion. In this paper with the help of new algorithm the PAPR reduction with the PTS technique is about 1.78 dB for 0.01 % of input symbols. This reduction in PAPR with PTS can be increased by increasing the number of phase sequences and the size of input data block. The simulation results show that PAPR is reduced to 2.69 dB for 0.01 % of input symbols for increasing the number of phase sequences from 16 to 36.
Keywords
— CCDF, PTS. PAPR, OFDM1. INTRODUCTION
[image:1.595.336.515.266.414.2]Future mobile communications systems reaching for ever increasing data rates require higher bandwidths than those typical used in today’s cellular systems. By going to higher bandwidth (for low bandwidth) the flat fading radio channel becomes frequency selective and time dispersive. Due to its inherent robustness against time dispersion Orthogonal Frequency Division Multiplexing (OFDM) is an attractive candidate for such future mobile communication systems[1].The common representation of the multipath channel is the Channel Impulse Response (CIR) of the channel which is the Figure 2 shows the general structure of a multicarrier system. Owing to the high spectral efficiency and the immunity to multipath channels, orthogonal frequency-division multiplexing (OFDM) is a promising technique for high-rate data transmission. But the high Peak-to-Average Power Ratio (PAPR) is one of the main obstacles to limit wide applications.
Figure 1: Effective Length of CIR
The original data stream of rate R is multiplexed into N parallel data streams of rate Rmc= =1/Tmc = R/N each of the data streams is modulated with a different frequency and the resulting signals are transmitted together in the same band. Correspondingly the receiver consists of N parallel receiver paths. Due to the prolonged distance in between transmitted symbols the ISI for each sub system reduces. Even if small ISI remains then such little ISI can often be tolerated and no extra counter measure such as an equalizer is needed. Also as far as the complexity of a receiver is concerned a system with more number of parallel paths still isn't feasible. This asks for a slight modification of the approach, which leads us to the concept of Orthogonal Frequency Division Multiplexing (OFDM).
[image:1.595.329.528.602.674.2]3 .OFDM SYSTEM MODEL
[image:2.595.57.295.144.284.2]OFDM [2] transmitters generate both the carrier and the data signal simultaneously with purely digital circuits residing in the specialized DSP (Digital Signal Processor) MICROCHIPS AS SHOWN IN FIGURE 3.
Figure 3: Basic Structure of OFDM
4. GENRATION OF OFDM SIGNAL
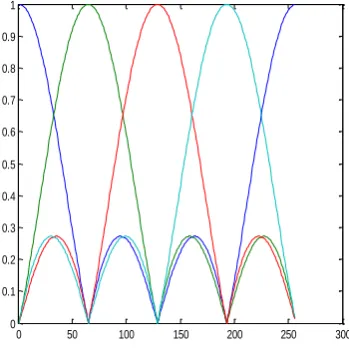
All carriers are orthogonal to each other, which means when one particular subcarrier is at its peak other are at zero All four carriers are orthogonal to each other, that means when one particular subcarrier is at its peak other are at zero as shown in the figure 4.
0 50 100 150 200 250 300
0 0.1 0.2 0.3 0.4 0.5 0.6 0.7 0.8 0.9 1
Figure 4: OFDM Signal
5. EXPRESSION OF
PEAK-TO-AVERAGE POWER RATIO
PAPR is alternately referred to as the peak-to-average power ratio and PMEPR (peak to mean envelope power ratio). PAPR is also directly related to the crest factor (CF) of a signal where CF = √PAR
The PAR of an OFDM signal can be defined as,
PAPR = (1)
(2)
Where X Be Any Signal Representation (Critically Sampled Baseband, Oversampled Baseband, Continuous-Time Pass Band, Etc.) Defined Over One Symbol Period. Issues Concerned With PAPR
A High PAPR Is Undesirable, As It Requires A Large Dynamic Range Of The D/A And A/D Converters And The Amplifiers Used. Consequently They Are Used Very Inefficiently, As Most Of The Signal Amplitudes Are Only A Fraction Of This Dynamic Range. In Order To Keep The Quantization Noise At An Acceptable Level, A Large Precision Is Required, Meaning A Large Number Of Bits. Reduction Of PAPR
[image:2.595.80.255.445.622.2]0 2 4 6 8 10 12 14 10-5
10-4 10-3 10-2 10-1 100
clipping level in dB
Pr
P
A
R
x
(n
)>
c
li
p
p
in
g
l
e
v
e
l
[image:3.595.64.277.75.288.2]plot of PAR of x(n)for various values of N
Figure 5.Plot of Complementary Cumulative Distribution Function (CCDF) of PAPR
In particular, a OFDM signal with N sub channels has PAPRmax =10log10 N. From the central limit theorem, it follows that for large values of N, the real and imaginary values of x(t) become Gaussian distributed. Therefore the amplitude of the OFDM signal has a Rayleigh distribution, with a cumulative distribution given by F(z)= (1− e-z) .The probability that the PAPR is below some threshold level can be written as P(PAPR≤ z) =(1−e-z)N
0 2 4 6 8 10 12 14
10-5
10-4
10-3
10-2
10-1
100
clipping level in dB
Pr
P
A
R
x
(n
)>
c
li
p
p
in
g
l
e
v
e
l
plot of PAPR of x(n)for various values of N
[image:3.595.333.582.82.311.2]N=16 N=128 N=256 N=1024
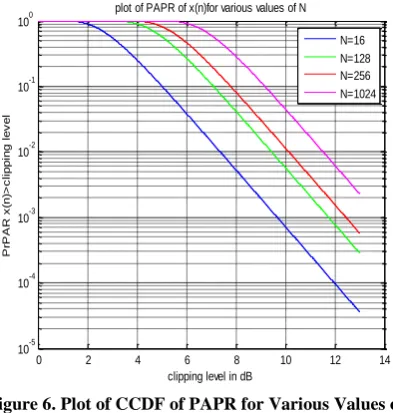
Figure 6. Plot of CCDF of PAPR for Various Values of N
In fact, the complementary cumulative distribution function
of PAPR of an OFDM is usually used, and can be expressed as P(PAPR > z) = 1−(1− e-z)N and is shown in figure 4 and figure 5 respectively.
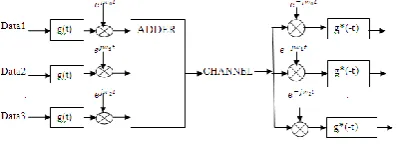
6. PTS METHOD
In the Partial Transmit Sequences (PTS) technique, an input data block of N symbols is partitioned into disjoint sub blocks. The sub carriers in each sub block are weighted by a phase factor for that sub block as shown in figure. The phase factors are selected such that the PAPR of the signal is minimized.
Figure 6 shows the block diagram of the PTS technique. In the PTS technique [9,10] input data block X is partitioned into V disjoint sub blocks Xv = [Xv,0, Xv,1, …, Xv,N-1], v = 1, 2, …, V,as shown in figure in 11. The sub blocks are combined to minimize the PAPR in the time domain. The set of phase factors is denoted as a vector b = [b1, b2, …, bv]. The time domain signal after combining is given by
x′(b) = ∑ b(v).x(v) 0≤v≤V (3)
x′(b) = [x′0(b), x′1(b). … x′N-1(b)] (4)
The objective is to find the set of phase factors that minimizes the PAPR. Minimization of PAPR is related to the minimization of max [x′ (b)]. In general, the selection of the phase factors is limited to a set with a finite number of elements to reduce the search complexity. The set of allowed phase factors is written as P = {0, 1, …, W – 1}, where W is the number of allowed phase factors. So, we should perform an exhaustive search for V phase factors. Hence, WV sets of phase factors are searched to find the optimum set of phase factors. The search complexity increases exponentially with the number of sub blocks V. PTS needs V IDFT operations for each data block.
Simulation Parameter
Type/ValueNu Number of Sub block 2, 4, 8, 16
Number of Sub carries(N) 64, 128, 256, 1024
Over sampling Factor 2, 4, 8, 16
Roll-of factor 0, 0.2, 0.4, 0.6, 0.8, 1
Pulse Shaping Filter Raised-Cosine filter
Phase Weighting factor 1, -1, j, -j
Modulation Scheme QPSK
[image:3.595.333.583.83.312.2] [image:3.595.73.270.437.644.2]The amount of PAPR reduction depends on the
Figure 7. A Block Diagram of the PTS Technique
So, we should perform an exhaustive search for V phase factors. Hence, WV sets of phase factors are searched to find the optimum set of phase factors. The search complexity increases exponentially with the number of sub blocks V. PTS needs V IDFT operations for each data block. The amount of PAPR reduction depends on the number of sub blocks V and the number of allowed phase factors W.
In PTS, the number of rotation factor {b (v)} may be limited in a certain range. WV accessorial information sequences is required in PTS-OFDM, where V denotes the number of sub blocks and W denotes the number of the phase factors. PTS needs V IDFT operations for each data block and the redundant bits of side information are as follows: R= (V-1) log2 W. Note that PTS-OFDM with V=4 sub blocks and W= 4 phase factors for each, corresponds to a redundancy of 6 bit. PTS works with little additional redundancy and moderate transmitter complexity. But PTS performs better than others with the same number of sub blocks. The side information must be transmitted to the receiver to recover the original data block. One way to do this is to transmit these side information bits with a separate channel other than the data channel. It is also possible to include the side information within the data block; however, this results in data rate loss.
There are three kinds of sub block partitioning schemes: adjacent, interleaved, and pseudo-random partitioning [6]. Among them, pseudo-random partitioning has been found to be the best choice. The PTS technique works with an arbitrary number of sub carriers and any modulation scheme.
Example: Here, I show a simple example of the PTS technique for an OFDM system with eight subcarriers that are divided into four sub blocks. The phase factors are selected in P = {±1}. Figure 6 shows the adjacent sub block partitioning for a data block X of length 8. The side information must be transmitted to the receiver to recover the original data block. One way to do this is to transmit these side information bits with a separate channel other than the data channel. It is also possible to include the side information within the data block; however, this results in data rate loss. Furthermore, the PAPR
reduction process can be made more efficient by increasing the number of phase sequences and the number of sub blocks, although there may be a little bit increment of calculation complexity. Following figure shows the comparison of PAPR for original unmodified OFDM signal and by using PTS technique for different phase sequences and variation in number of sub blocks.
7. RESULTS
[image:4.595.330.530.267.462.2]The CCDFs are usually compared in a graph such as Figure 8, which shows the CCDFs of the PAPR of an OFDM signal with 16,128,256 and 1024 subcarriers (N =16,128, 256,1024) for quaternary phase shift keying (QPSK) modulation. The horizontal and vertical axes represent the threshold for the PAPR and the probability that the PAPR of a data block exceeds the threshold, respectively.
0 2 4 6 8 10 12 14
10-5
10-4
10-3
10-2
10-1
100
clipping level in dB
Pr
P
A
R
x
(n
)>
c
li
p
p
in
g
l
e
v
e
l
plot of PAPR of x(n)for various values of N
N=16 N=128 N=256 N=1024
Figure 8. CCDF of PAPR of OFDM for Various N
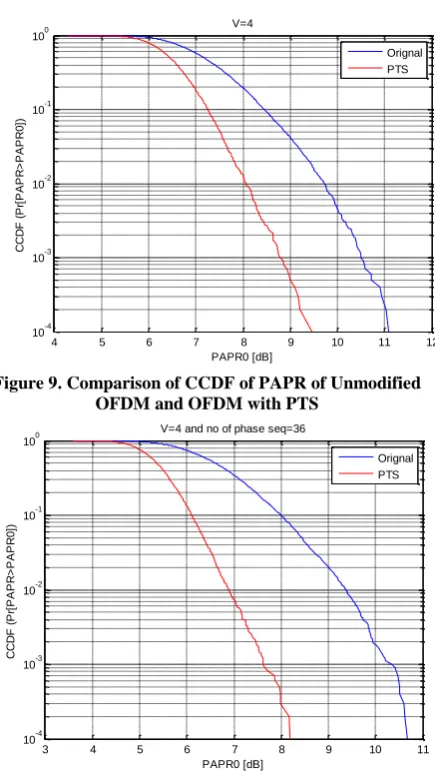
Figure 9 shows the Comparison of CCDF of PAPR of unmodified OFDM and OFDM with PTS technique. The figure shows that when is used as a PAPR reduction technique, the 0.1 percent PAPR reduce to 8.8 dB, resulting in 1.8 dB reductions. Speaking roughly, the closer the CCDF curve is to the vertical axis, the better its PAPR characteristic.
4 5 6 7 8 9 10 11 12 10-4
10-3 10-2 10-1 100
PAPR0 [dB]
C
C
D
F
(P
r[
P
A
P
R
>
P
A
P
R
0
])
V=4
[image:5.595.63.281.68.454.2]Orignal PTS
Figure 9. Comparison of CCDF of PAPR of Unmodified OFDM and OFDM with PTS
3 4 5 6 7 8 9 10 11
10-4 10-3 10-2 10-1 100
PAPR0 [dB]
C
C
D
F
(P
r[
P
A
P
R
>
P
A
P
R
0
])
V=4 and no of phase seq=36
Orignal PTS
Figure 10. Comparison of CCDF of PAPR of Unmodified OFDM and OFDM with PTS for 36 Phase
Sequences
Figure 10 shows the Comparison of CCDF of PAPR of unmodified OFDM and OFDM with PTS technique with 36 phase sequences. The figure shows that when is used as a PAPR reduction technique, the 0.1 percent PAPR reduce to 7.6 dB, resulting in 2.8 dB reductions.
8.
CONCLUSIONS
The PAPR reduction with the PTS technique is about 1.8 dB for 0.01 % of input symbols. This reduction in PAPR with PTS can be increased by increasing the number of phase sequences and the size of input data block. The simulation results show that PAPR is reduced to 2.8 dB for 0.01 % of input symbols for increasing the number of phase sequences from 16 to 36. Also, PAPR is reduced to 2.7 dB for 0.01 % of input symbols for increasing the size of input data block from 4 to 8.
But the cost paid for this reduction in PAPR is increase in calculation complexity. It may be any method
9. REFERENCES
[1] C. V. Chong and V. Tarokh, “A Simple Encodable/Decodable OFDM QPSK Code with Low Peak-to-Mean Envelope Power Ration,”IEEE Trans. Info. Theory,vol. 47, no. 7, Nov. 2001, pp. 3025–29.
[2] J. Tellado, Peak to Average Power Reduction for Multicarrier Modulation, Ph.D. dissertation, Stanford Univ., 2000.
[3] B. S. Krongold and D. L. Jones, “PAR Reduction in OFDM via Active Constellation Extension,” IEEE Trans. Broadcast., vol. 49, no. 3, Sept. 2003, pp. 258– 68.
[4] Heung-Gyoon Ryu, Jae-Eun Lee, and Jin-Soo Park, "Dummy sequence insertion (DSI) for PAPR reduction in the OFDM communication system," IEEE Transactions on Consumer Electronics, vol. 50, pp.89-94, Feb. 2004
[5] J. Armstrong, “Peak-to-Average Power Reduction for OFDM by Repeated Clipping and Frequency Domain Filtering,” Elect. Lett., vol. 38, no. 8, Feb. 2002, pp. 246–47.
[6] A. E. Jones, T. A. Wilkinson, and S. K. Barton, “Block Coding Scheme for Reduction of Peak to Mean Envelope Power Ratio of Multicarrier Transmission Scheme,” Elect. Lett., vol. 30, no. 22, Dec. 1994, pp. 2098–99
[7] Ben Slimane, S., “Peak-to-average power ratio reduction of OFDM signals using pulse shaping”, Proceedings of IEEE Vehicular Technology Conference, USA, September 2002, pp.889-893.
[8] Xiuyan, Z., and Guobin,T., “The research of improved PTS method for peak-to-average power ratio reduction”, Proceedings of IEEE 3rd international conference on wireless, mobile and multimedia networks, Beijing, China, September 2010, pp. 104-107.
[9] Xinchun Wu, Zhigang Mao, Jinxiang Wang, Bin Zho, “ A novel PTS technique with combinative optimization in real part and imaginary part for PAPR reduction in OFDM systems”, Proceedings of Third International Conference on Next Generation Mobile Applications, Services and Technologies, Cardiff, Wales, UK, September 2009, pp. 215-218.
[10] Mukunthan, P., and Dananjayan, P., “Modified PTS with interleaving and pulse shaping method for PAPR reduction of OFDM signal with QPSK subcarriers”, Proceedings of International Conference on Information and Communication Technology, Chennai, India, 24th December 2011, pp. 65-71.
[11] Sharif, M., Gharayi-Alkhansari, M., and Khalaj, B.H., “On the peak-to-average power of OFDM signals based on oversampling”, IEEE Transactions on
Communications, January 2003, pp. 72-78.
[12] Tellambura, C., “Improved phase factor computation for the PAP reduction of an OFDM signal using PTS”, IEEE Communications Letters, vol.5, no.4, April 2001,pp.135- 137.