An Efficient Objects Discrimination and
Noise Reduction on Hyperspectral Images
Sarath Babu
1, S. John Livingston
2Department of Computer Science and Engineering, Karunya University
1
[email protected] [email protected]
Abstract— Hyperspectral imaging (HSI) combines conventional imaging and spectroscopy to attain both spatial and spectral information from an object. But the main drawback in HSI is inheritance of noise while their acquisition or transmission. The amount of noise included in a hyperspectral image limits its application and has a negative impact on hyperspectral image classification, discrimination, target detection, and so on. Denoising algorithm is Choice of application dependent and depends upon the type of noise present in the object. Every algorithm has its own assumptions, advantages and limitations. Here comparative analysis of various noise suppression algorithms of spatial noise reduction on hyperspectral images. Noise reduction will increase the performance of discrimination on hyperspectral images with Principal Component Analysis (PCA).
Keywords— Discrimination, Hyperspectral imaging, Principal component analysis, Segmentation, Denoising.
I.IINTRODUCTION
Nowadays, image analysis is becoming more important because of its ability to perform fast and non-invasive low-cost analysis on products and processes. Hyperspectral imaging collects and processes information from across the electromagnetic spectrum. It will provide increased sensitivity and discrimination capabilities over traditional imaging and detection methods.
Image denoising is still a challenging problem for researchers as image denoising causes blurring and degrading the performance. Different types of images inherit different types of noise and different noise models [1] are used. Denoising method tends to be problem specific and depends upon the type of image and noise model. The existence of noise in a hyperspectral image not only influences the visual effect of these images but also limits the precision of the subsequent processing, for example, in classification [2], unmixing, subpixel mapping, target detection, etc. Therefore, it is critical to reduce the noise in the hyperspectral image and improve its quality before the subsequent image interpretation processes.
The classification and discrimination of objects image is the one of the problem in image analysis. Counting white and red blood cells on a microscopic image of a blood smear [3, 4], detection of spoiled or unripe fruits [5, 6], evaluating individual components in a untreated waste for further recycling [7, 8], damage detection on white mushrooms [9] maize kernel hardness classification [10] and fusarium damaged wheat detection [11] – all these and many other similar tasks need the same procedure for solving: take an image, segment objects of the interest and classify or discriminate them.
high can also be utilized for these purposes in hyperspectral image. Feature extraction is the important process for hyperspectral image discrimination. The accuracy rate of the classification and discrimination relies on the number of extracted feature as well as the characteristic of feature. Feature of image can be classified into three groups: (1) morphological feature [13], (2) color feature [14, 15] and (3) texture feature [2].
In this paper, make a comparative study on different hyperspectral images with different noise reduction methods. The noise reduction of hyperspectral images will increase the performance of discrimination. And emphasize on feature extraction and discrimination of hyperspectral images based on using the combination of principal component analysis and quantitative evaluation of the patterns as the object’s features. In Fig. 1and Fig. 2 are the images of chemical pills from two different classes (denoted as A and B). It can be seen that most of the pills from both images can be chemical pills distinguished by an unarmed eye most of the pixels are very similar (in the case have similar color components).
II.MATERIALSANDMETHODS
A. Hyperspectral Image Samples
Selected hyperspectral image samples of two different chemical pills (400 mg of calcium carbonate, 19 µg of cholecalciferol (vitamin D3) and 400 mg calcium carbonate, 10 µg of cholecalciferol plus 150 mg of magnesium), apple image (spectral region between 1000 and 1340 nm), flower image, leaf image and field images, An example of the analyzed samples shown in Fig. 1, Fig. 2 and Fig. 3.
B. Noise Reduction Methods
Various denoising techniques have been proposed so far and their application depends upon the type of image and noise present in the image. To make a comparative analysis of various noise suppression algorithms on different hyperspectral images.
[image:3.612.324.558.142.295.2]Mean filter acts on a hyperspectral image by smoothing it. It reduces the intensity variations between the adjacent pixels. It will sliding window spatial filter that replaces the centre value of the window with the average values of its all neighboring pixels values including itself.
[image:3.612.323.559.322.474.2]Figure. 1 1440 nm images of chemical pills from class
Figure. 2. 1440 nm images of chemical pills from class B
[image:3.612.324.558.504.669.2]The Wiener filter is to produce an estimate of a desired or target random process by linear time invariant filtering an observed noisy process, assuming known stationary signal and noise spectra, and additive noise.
[image:4.612.97.262.378.660.2]The median filter is a nonlinear digital filtering technique, such noise reduction is a typical pre-processing step to improve the results of later processing. Under certain conditions, it preserves edges while removing noise. The idea of the median filter is to run through the image entry by entry, replacing each entry with the median of neighboring entries.
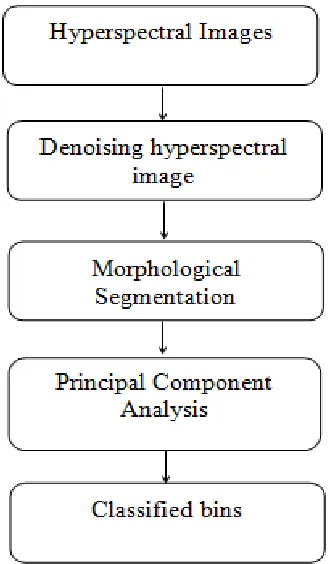
Figure. 4 Flow diagram of noise reduction and discrimination
C. Image Segmentation
For every image create binary mask for objects, using proper segmentation algorithm. Image Segmentation done with morphological approach. The field of mathematical morphology contributes a wide range of operators to image processing, all based around a few simple mathematical concepts from set theory. The operators are particularly useful for the analysis of binary images and common usages include edge detection, noise removal, image enhancement and image segmentation. Then label all objects and their pixels. The result of this step is an image masks a matrix, with the same number of elements as the number of pixels on the image, and where each element has an index that corresponds to a particular object.
D. Principal Component Analysis
The hyperspectral image discriminate with following items –mean values and weights for the variables, loadings of the joint principal component space, and vectors with minimum and maximum values for each component. The set of features a PCA [16] model was used for exploring discriminant ability. The number and selection of principal componentsand the number of bins for calculation used for distribution histograms.
All calculations have carried out in MATLAB® 2013asupplemented with image processing toolbox.
III.RESULTSANDDISCUSSIONS
A simple experiment has been carried out, for noise reduction and discrimination hyperspectral images. Several gray scale images were taken for the comparison study of the denoising methods in hyperspectral images. Then check with mean, median, weiner denoising filters. Then check the PSNR (Peak signal-to-noise ratio) and SNR (Signal-to-noise ratio) values expressed in decibels (dB). Table 1 show the comparison of different hyperspectral images with different denoising methods. The weiner filter provides better results compare to others.
For the discrimination process the object chosen for the experiment were two different graysale denoised chemical pills image. First image of 400 mg of calcium carbonate and
Fig. 2. The images were acquired using Spectral Dimensions MatrixNIR chemical imaging system. The spectral range of image is 960-1662 nm and the spatial resolution 320 × 256 pixels. Fig. 4 shows the flow diagram of noise reduction and discrimination of hyperspectral images.
TABLEI
COMPARISON TABLE OF DIFFERENT DENOSING METHODS WITH DIFFERENT HYPERSPECTRAL IMAGES
Figure. 5 Segmentation result 1 -Grayscale image, result 2-Edge detection
[image:5.612.317.554.131.248.2][image:5.612.67.299.262.573.2]
Figure. 6 Segmentation result 3 -Dilation, result 4-Filling and Opening
Figure.7. PCA score plot with denoising image
For the segmentation process using 1440 nm grayscale image of chemical pills and the edge detection using canny filter shows in Fig. 5. Morphological dilation and filling and opening shows in Fig.6. Fig. 7 shows the score plots of PCA method with reduced denoised image. It is shows the PC1 vs. PC2. The chemical pills from the separate classes are discriminate with high accuracy, blue circle denotes the class A and red triangle denotes Class B. To calculate the set of features and the initial number of principal component was estimated using residual variance plots. Input
Images
Noise Ratio
Mean Filter
Median Filter
Weiner Filter
Chemical pills image
PSNR +24.4667 +34.1478 +35.1279
SNR 0.36331 10.04443 11.02446
Apple Image
PSNR +24.4974 +33.7564 +38.3866
SNR -0.24212 9.01691 13.64703
Flower Image
PSNR +33.5265 +38.3556 +39.6114
SNR 9.01005 13.83873 15.09500
Leafs
image
PSNR +27.6157 +28.7234 +31.8233
SNR 3.51625 4.62395 7.73381
Field Image
PSNR +30.1408 +33.0068 +36,3559
[image:5.612.334.552.306.524.2]IV.CONCLUSIONS
The comparative study of various denoising techniques for hyperspectral images shows that weiner filters outperforms other than the standard spatial domain filters. Before the discrimination process denosing the hyperspectral images, that is increase the discrimination performance. The morphological segmentation is used as the preprocessing of PCA for the segmentation of objects in hyperspectral images. In this work the good discrimination of hyperspectral image had been performed using the concept of principal component analysis. In future this approach can be applying for large spatial resolution with millions of pixels, like satellite or aerial hyperspectral images.
ACKNOWLEDGMENT
The authors are very grateful to Prof. Sergey Kucheryavskiy, Aalborg University, Denmark and Prof. Bart M. Nicolai, Flanders Centre of Postharvest Technology, Katholieke Universiteit Leuven, Belgium for providing the hyperspectral images.
REFERENCES
[1] Jappreet Kaur,Manpreet Kaur,Poonamdeep Kaur,Manpreet Kaur,” Comparitive Analysis of Image Denoising Techniques”, International Journal of emerging Technology and Technology Engineering, Vol 2,pp. 296-299,2012
[2] R.M. Haralick, K. Shanmugam, I.H. Dinstein,”Textural features for image classification”, IEEE Transactions on Systems, Man,and Cybernetics, Vol 3 , pp. 610–621,1973.
[3] P. Yampri, C. Pintavirooj, S. Daochai, S. Teartulakarn, “White blood cell classification based on the combination of Eigen cell and parametric feature detection”, 2006 1ST IEEE Conference on Industrial Electronics and Applications, pp. 1–4, 2006.
[4] S. Kucheryavski, “Using hard and soft models for classification of medical images”, Chemometrics and Intelligent Laboratory Systems, Vol 88, pp. 100–106, 2007.
[5] A.A. Gowen, C.P. O'Donnell, P.J. Cullen, G. Downey, J.M. Frias, “Hyperspectral imaging an emerging process analytical tool for food quality and safety control,”Trends in Food Science & Technology, Vol 18, pp. 590–598,2007.
[6] B.M. Nicolaï, E. Lötze, A. Peirs, N. Scheerlinck, K.I. Theron, “Nondestructive measurement of bitter pit in apple fruit using NIR hyperspectral imaging”, Postharvest Biology and Technology , Vol 40, pp. 1–6., 2006.
[7] S.T. Wagland, F. Veltre, P.J. Longhurst, “Development of an image based analysis method to determine the physical composition of a mixed waste material”,Waste Management, Vol 32, pp. 245–248, 2012.
[8] S. Serranti, A. Gargiulo, G. Bonifazi,”Characterization of postconsumer
polyolefin wastes by hyperspectral imaging for quality control in recycling processes”, Waste Management , Vol 31, 2217– 2227, 2011.
[9] A.A. Gowen, C.P. O'Donnell, P.J. Cullen, G. Downey, J.M. Frias, “Hyperspectral imaging combined with principal component analysis for bruise damage detection on white mushrooms (Agaricus bisporus)”, Journal of Chemometrics, Vol 22, 259–267, 2007.
[10] P. Williams, P. Geladi, G. Fox, M. Manley,”Maize kernal hardness classification by near infrared (NIR) hyperspectral imaging and multivariate data analysis”, Analytica Chimica Acta , Vol 653, pp. 121–130, 2009.
[11] Silvia Serranti,Deniela Ceseare,Giuseppe Bonifazi,”The development of a hyperspectral imaging method for the detection of Fusarium-damaged, yellow berry and vitreous Italian duram wheat kernals”,biosystem engineering, Vol .115, pp. 20-30,2013
[12] S. Kucheryavski, “A new approach for discrimination of objects on hyperspectral images”,Chemometrics and Intelligent Laboratory Systems, Vol 120, pp. 126–135, 2013.
[13] .M. Mehtre, M.S. Kankanhalli, “Shape measure for content based image retrieval: a comparison”, Information Processing and Management , Vol 33, pp. 319–337,1997.
[14] R. Huang, N. Sang, D. Luo, Q. Tang, “Image segmentation via coherent clustering in L*a*b* color space”, Pattern Recognition Letters, Vol 32 , pp. 891–902,2011.
[15] A. Brydegaard, A. Runemark, R. Bro,”Chemometric approach to chromatic spatial variance. Case study : patchiness of the skyros wall lizard” , Journal of Chemometrics, Vol 26 , pp.246–255,2011.