University of Huddersfield Repository
Wang, Yan
A knowledgebased intelligent system for surface texture (virtual surf)
Original Citation
Wang, Yan (2008) A knowledgebased intelligent system for surface texture (virtual surf). Doctoral thesis, University of Huddersfield.
This version is available at http://eprints.hud.ac.uk/id/eprint/6956/
The University Repository is a digital collection of the research output of the University, available on Open Access. Copyright and Moral Rights for the items on this site are retained by the individual author and/or other copyright owners. Users may access full items free of charge; copies of full text items generally can be reproduced, displayed or performed and given to third parties in any format or medium for personal research or study, educational or notforprofit purposes without prior permission or charge, provided:
• The authors, title and full bibliographic details is credited in any copy; • A hyperlink and/or URL is included for the original metadata page; and
• The content is not changed in any way.
For more information, including our policy and submission procedure, please contact the Repository Team at: [email protected].
A KNOWLEDGE-BASED INTELLIGENT SYSTEM FOR
SURFACE TEXTURE (VIRTUALSURF)
By
YAN WANG
A thesis submitted to The University of Huddersfield in partial fulfilment of the requirements for the degree of Doctor of Philosophy
Department of Computing & Engineering The University of Huddersfield
ACKNOWLEDGEMENTS
I would like to thank my supervisors for their inspiration and valuable contributions to my work. In particular sincere thanks are directed to my supervisor Professor Xiangqian (Jane) Jiang for her patience, guidance and professional support.
Special thanks are devoted to Prof. Paul Scott for his continued encouragement, guidance and invaluable suggestions during this work. Words really cannot express how grateful I am.
I would also like to thank the following people for their advice and technical assistance throughout the duration of this project:
Professor Liam Blunt Dr. Leigh Brown Dr. Paul Bill Helene Pickles
All of my colleagues and friends in the Centre for Precision Technologies, The University of Huddersfield.
ABSTRACT
The presented thesis documents the investigation and development of the mathematical foundations for a novel knowledge-based system for surface texture (VitualSurf system). This is the first time that this type of novel knowledge-based system has been tried on surface texture knowledge. It is important to realize that surface texture knowledge, based on new generation Geometrical Product Specification (GPS) system, are considered to be too theoretical, abstract, complex and over-elaborate. Also it is not easy for industry to understand and implement them efficiently in a short time.
The VirtualSurf has been developed to link surface function, specification through manufacture and verification, and provide a universal platform for engineers in industry, making it easier for them to understand and use the latest surface texture knowledge. The intelligent knowledge-base should be capable of incorporating knowledge from multiple sources (standards, books, experts, etc), adding new knowledge from these sources and still remain a coherent reliable system. In this research, an object-relationship data model is developed to represent surface texture knowledge. The object-relationship data model generalises the relational and object orientated data models. It has both the flexibility of structures for entities and also good mathematical foundations, based on category theory, that ensures the knowledge-base remains a coherent and reliable system as new knowledge is added.
CONTENTS
List of Figures ... 9
List of Tables ... 14
Chapter 1 Introduction ... 16
1.1 Motivation ... 16
1.2 Objectives and Approaches ... 17
1.3 Novel work ... 18
1.4 Structure of the thesis ... 19
References ... 19
Chapter 2 Knowledge-based system ... 21
2.1 Introduction ... 21
2.2 Knowledge-based System ... 21
2.3 Knowledge representation ... 24
2.3.1 Different data models ... 24
2.3.1.1 Traditional data models (record-based data models) ... 24
2.3.1.2 Object-based data models ... 26
2.3.2 Fuzzy logic ... 32
2.3.3 Pattern language ... 34
2.4 Summary ... 36
References ... 37
Chapter 3 Category Model for Knowledge-based system ... 38
3.1 Introduction ... 38
3.2 Measurement theory applies Category theory ... 38
3.2.1 Three theories of measurement ... 39
3.2.1.1 Representational measurement theory ... 39
3.2.1.2 Operational measurement theory ... 40
3.2.1.3 Classical measurement theory ... 40
3.2.1.4 Comparison of three measurement theories ... 40
3.2.2 Stable measurement procedure ... 41
3.2.3 Category theory applied to Measurement theory ... 45
3.2.3.1 Category ... 46
3.2.3.2 Functor ... 46
3.2.3.3 Natural transformation ... 47
3.2.4 Application in GPS (Geometrical Product Specification and Verification) system ... 48
3.3 Category model approach in knowledge representation ... 51
3.3.1 Introduction of Category model approach ... 51
3.3.2 Category Theory ... 52
3.3.2.1 Category ... 52
3.3.2.2 Products ... 53
3.3.2.3 Pullbacks ... 53
3.3.3 Category model ... 54
3.3.3.1 Relationships in Category Model ... 55
3.3.3.2 Comparison of category model examples with other data models ... 56
3.3.3.4 The queries for the category model ... 60
3.4 Model refinement applies Category theory ... 61
3.4.1 Requirements for refinement ... 62
3.4.2 Category model for data refinement process ... 65
3.4.2.1 Category theory applied to refinement process ... 66
3.4.2.2 Fibration checking rules ... 68
3.4.2.3 Proposition on fibration functors ... 68
3.4.2.4 Refinement guidelines ... 71
3.4.2.5 Adjoint and the refinement requirements ... 71
3.4.2.6 Example ... 75
3.5 Summary ... 77
References ... 78
Chapter 4 GPS – based Surface texture KBS ... 80
4.1 Introduction ... 80
4.2 The GPS (Geometrical Product Specification) system ... 81
4.2.1 Matrix model with chains ... 84
4.2.2 Tolerance = Feature + Characteristics + Condition ... 87
4.2.2.1Features ... 88
4.2.2.2 Characteristics ... 89
4.2.2.3 Condition ... 90
4.2.2.4 Example of a tolerance ... 90
4.2.3 Duality principle ... 90
4.2.3.1 Specification operations ... 92
4.2.3.2 Verification operations ... 93
4.2.3.3 Mirror relation between Specification and Verification ... 94
4.2.4 General GPS model ... 95
4.3 Surface texture knowledge-based system ... 99
4.3.1 The architecture of surface texture knowledge-based system ... 101
4.3.2 Knowledge acquisition ... 102
4.3.3 Knowledge representation - different structures of surface texture knowledge ... 104
4.3.3.1 Function ... 105
4.3.3.2 Specification ... 107
4.3.3.3 Manufacture ... 107
4.3.3.4 Verification ... 108
4.4 Summary ... 109
References ... 110
Chapter 5 Specification Refinement ... 112
5.1 Introduction ... 112
5.1.1 Specification knowledge-base system ... 112
5.1.2 Introduction of 2D surface texture parameters ... 113
5.1.2.1 Parameters from three profiles ... 113
5.1.2.2 Three groups of surface texture parameters ... 115
5.2 Knowledge acquisition ... 116
5.2.1 Partition ... 117
5.2.1.1 Direction: surface texture lay (k) (see figure 5.1) ... 117
5.2.1.2 Manufacture type (j) (see figure 5.1) ... 118
5.2.2 Extraction ... 119
5.2.2.1 Num_cutoff (f) (see figure 5.1) ... 119
5.2.2.2 Sampling length ... 120
5.2.2.3 Evaluation length Ln ... 123
5.2.3 Filtration ... 124
5.2.3.1 Filter type (b) (see figure 5.1) ... 124
5.2.3.2 The transmission band (c) (see figure 5.1) ... 125
5.2.4 Measurand ... 129
5.2.4.1 Tolerance type (a) (see figure 5.1) ... 129
5.2.4.2 Parameter (d – profile indication, e – characteristic indication) (see figure 5.1) ... 129
5.2.4.3 Value (h) (see figure 5.1) ... 130
5.2.4.4 Machining allowance (i) (see figure 5.1) ... 131
5.2.5 Comparison rule ... 132
5.2.5.1 Rule type (g) (see figure 5.1) ... 132
5.2.5.2 Rule interpretation ... 132
5.2.6 Relations in the specification knowledge-base ... 132
5.3 Knowledge representation ... 134
5.3.1 Functional Model of Callout ... 134
5.3.1.1 Entities and functions ... 134
5.3.1.2 Functional Model by P/FDM ... 135
5.3.2 Category Model of Specification ... 136
5.3.2.1 Specification model ... 136
5.3.2.2 Relationships in pullback structure ... 137
5.3.2.3 Operations of the specification knowledge-base ... 140
5.3.2.4 Controlling reasoning ... 140
5.3.2.5 Queries of the specification knowledge-base ... 141
5.4 Interface of the specification knowledge-base ... 143
5.5 Summary ... 145
References ... 146
Chapter 6 Verification Refinement ... 147
6.1 Introduction ... 147
6.2 Knowledge acquisition ... 148
6.2.1 Partition ... 148
6.2.1.1 Traverse length ... 148
6.2.1.2 Traverse direction ... 149
6.2.2 Extraction ... 150
6.2.2.1 Primary profile lower limit λs ... 150
6.2.2.2 Sampling spacing ... 150
6.2.2.3 Sampling length lp, lr, lw ... 151
6.2.3 Filtration ... 152
6.2.3.1 Filter type ... 152
6.2.3.2 Cut-off wavelength ... 152
6.2.4 Measured value ... 154
6.2.5 Instrument ... 154
6.2.5.1 Instrument selection ... 154
6.2.5.2 Characteristics of the instruments ... 156
6.2.5.3 Inserting new instruments ... 157
6.3 Knowledge representation ... 159
6.3.1 Category Model of Verification ... 159
6.3.2 Relationships in pullback structure ... 160
6.3.3 Mirror relationships between the specification and verification knowledge-base ... 169
6.3.4 Functions of the verification knowledge-based system ... 172
6.4 Interface of the verification knowledge-base ... 172
6.5 Summary ... 173
References ... 174
Chapter 7 Function Refinement ... 176
7.1 Introduction ... 176
7.2 Parameters selection for different functions ... 178
7.2.1 Functions ... 178
7.2.1.1 Tribology ... 178
7.2.1.2 Characterization of Function ... 179
7.2.2 Parameters selection ... 182
7.3 Pattern Language to represent the model ... 184
7.3.1 Introduction of Pattern Language ... 184
7.3.2 Comparison with other alternative models ... 186
7.3.3 Function pattern language ... 187
7.4 Category model to represent function pattern language ... 190
7.4.1 Partial order set of the “Contexts” ... 190
7.4.2 Product order of the Posets ... 191
7.4.3 Interfaces of the Function knowledge-base ... 193
7.4.4 Insertion of the new pattern ... 194
7.5 Summary ... 195
References ... 196
Chapter 8 Manufacture Refinement ... 197
8.1 Introduction ... 197
8.1.1 Introduction of manufacturing processes ... 197
8.1.2 General manufacturing processes selection procedures ... 198
8.1.2.1 PRIMA ... 199
8.1.2.2 PRIMA selection matrix ... 201
8.2 Surface texture related to common manufacturing processes ... 202
8.3 Manufacturing processes structure ... 205
8.4 Category model to represent Manufacturing knowledge-base ... 207
8.5 Interfaces of the Manufacturing knowledge-base... 209
8.6 Summary ... 211
References ... 212
Chapter 9 Case Studies ... 213
9.1 Introduction ... 213
9.2 Total hip replacement ... 213
9.2.1 Wear of total hip replacement ... 214
9.2.2 Links surface texture with functional performance ... 215
9.2.2.1 Instrument selection ... 216
9.2.2.2 Relevant surface roughness parameters ... 217
9.2.3.1 Flowchart of the implementation ... 218
9.2.3.2 Interfaces of of the Virtualsurf system ... 219
9.3 Design of a cylinder liner ... 225
9.3.1 Functional performance ... 226
9.3.2 Relation between surface parameters and functional performance 227 9.3.3 Application of Virtualsurf ... 229
9.4 Summary ... 235
References ... 235
Chapter 10 Conclusions and Future work ... 237
10.1 Conclusions ... 237
10.2 Future Work ... 238
References ... 240
LIST OF FIGURES
Figure 2.1 Classifications of KBS ... 22
Figure 2.2 Basic Structure of a KBS ... 23
Figure 2.3 An example of a network schema ... 24
Figure 2.4 An example of a hierarchical schema ... 25
Figure 2.5 An example of an entity-relationship data model ... 27
Figure 2.6 An example of a functional schema ... 28
Figure 2.7 An example of object-oriented schema ... 29
Figure 2.8 Production rules ... 30
Figure 2.9 Sample production rules ... 30
Figure 3.1 Mohs hardness scale for minerals ... 39
Figure 3.2 The set of subsets of {x,y,z}, ordered by inclusion ... 43
Figure 3.3 Reflexive of the category ... 46
Figure 3.4 Transitive of the category ... 46
Figure 3.5 The constant functor ... 47
Figure 3.6 The calibration process – Natural transformation ... 48
Figure 3.7 Stable measurement operations ... 49
Figure 3.8 Filtering processes [13] ... 51
Figure 3.9 Category P ... 53
Figure 3.10 Product cone ... 53
Figure 3.11 An example of a product ... 53
Figure 3.12 Pullback ... 54
Figure 3.13 An example of a pullback ... 54
Figure 3.14 Relationship as a Pullback ... 55
Figure 3.15 A simple Table Relationship put into an equivalent Pullback Structure .. 56
Figure 3.16 The functional diagram of studying with corresponding data definition statements ... 58
Figure 3.17 The category model of studying ... 59
Figure 3.18 Production Rules put into an equivalent Pullback Structure ... 60
Figure 3.19 Illustration of Model Refinement ... 61
Figure 3.20 Illustration of Requirement 4 ... 63
Figure 3.21 Illustration of Requirement 5 ... 64
Figure 3.22 Illustration of Requirement 6 ... 64
Figure 3.23 A category example ... 66
Figure 3.25 Cartesian arrow ... 67
Figure 3.26 The constant functor ... 69
Figure 3.27 Terminal object ... 70
Figure 3.28 Initial object ... 70
Figure 3.29 Adjoint diagram ... 72
Figure 3.30 Adjoint condition 1 ... 72
Figure 3.31 Adjoint condition 2 ... 73
Figure 3.32Refinement Adjoint ... 74
Figure 3.33 Transition of adjoints ... 75
Figure 3.34 Abstract model of the Specification ... 76
Figure 3.35 Concrete model of the Specification ... 77
Figure 4.1 GPS Framework ... 81
Figure 4.2 Three worlds ... 82
Figure 4.3 General concepts of Geometrical Product Specifications [4] ... 83
Figure 4.4 Overview of GPS Masterplan structure ... 85
Figure 4.5 general GPS matrix – layout ... 86
Figure 4.6 The relationships between the chain of standards ... 87
Figure 4.7 Surface models ... 88
Figure 4.8 Examples of geometrical features ... 89
Figure 4.9 Example of tolerance indication on technical drawing ... 90
Figure 4.10 Partition of a skin model [7] ... 91
Figure 4.11 Extracted points from a feature of a skin model [7] ... 91
Figure 4.12 Separation of a profile [7] ... 91
Figure 4.13 Association example [7] ... 92
Figure 4.14 Example of specification operations ... 93
Figure 4.15 Example of verification operations ... 94
Figure 4.16 “mirror” relation between Specification and Verification ... 95
Figure 4.17 Refinement processes of general GPS model ... 96
Figure 4.18 Refinement process 1 ... 97
Figure 4.19 Refinement process 2 ... 98
Figure 4.20 Position of surface texture standards in the GPS matrix model ... 99
Figure 4.21 Surface texture framework ... 99
Figure 4.22 Examples of system operations ... 101
Figure 4.23 Architecture of Surface texture knowledge-based system ... 102
Figure 4.25 Example of a classification of surface function together with a relationship
table for motif parameters taken from ISO 12085 [17] ... 106
Figure 4.26 Tree structure of Function ... 106
Figure 4.27 Hierarchical structure of Callout symbol ... 107
Figure 4.28 Flowchart of simple processes selection ... 108
Figure 4.29 Hierarchical structure of Verification knowledge-base ... 109
Figure 5.1 Surface texture callout symbol [1] ... 113
Figure 5.2 Roughness, waviness and primary profiles ... 114
Figure 5.3 Profile element ... 115
Figure 5.4 Motif parameters ... 116
Figure 5.5 Parameters based on material ratio curve [5] ... 116
Figure 5.6 Indication of type of manufacturing process ... 118
Figure 5.7 Refinement process of Partition ... 119
Figure 5.8 Example of traverse length, evaluation length and sampling length [11] 121 Figure 5.9 Refinement process of Extraction ... 124
Figure 5.10 Transmission band [3] ... 125
Figure 5.11 Roughness motifs ... 126
Figure 5.12 Waviness motifs ... 127
Figure 5.13 Refinement process of Filtration ... 128
Figure 5.14 Refinement process Measurand ... 131
Figure 5.15 Refinement process of Comparison rule ... 132
Figure 5.16 Functional Model of Callout ... 135
Figure 5.17 Schema to define the knowledge-base ... 135
Figure 5.18 Daplex Queries ... 136
Figure 5.19 The Response ... 136
Figure 5.20 Specification model ... 137
Figure 5.21 Relation “equals” in pullback structure ... 138
Figure 5.22 Relation “determines” in pullback structure ... 138
Figure 5.23 Relation “determine” in pullback structure ... 139
Figure 5.24 Product “callout” ... 139
Figure 5.25 Flowchart of controlling reasoning ... 141
Figure 5.26 Interface of specification ... 144
Figure 5.27 Output of the interface ... 145
Figure 6.1 Example of traverse length and evaluation length [6] ... 149
Figure 6.3 Refinement process of Partition ... 150
Figure 6.4 Refinement process of Extraction ... 152
Figure 6.5 Refinement process of Filtration ... 153
Figure 6.6 Refinement process of Measured value ... 154
Figure 6.7 Illustration of a typical instrument ... 155
Figure 6.8 Instrumentation: Amplitude-Wavelength Diagram ... 156
Figure 6.9 Refinement process of Instrument ... 157
Figure 6.10 Verification model ... 159
Figure 6.11 Relation “greater” in pullback structure ... 160
Figure 6.12 Relation “equal” in pullback structure ... 160
Figure 6.13 Relation “equals” in pullback structure ... 161
Figure 6.14 Relation “determine” in pullback structure ... 161
Figure 6.15 An example to illustrate the compare procedures ... 162
Figure 6.16 Polygon of STM ... 163
Figure 6.17 Polygon of AFM ... 164
Figure 6.18 Polygon of SEM ... 165
Figure 6.19 Polygon of Stylus instrument ... 166
Figure 6.20 Polygon of Focus detection instrument ... 167
Figure 6.21 Polygon of Interferometer ... 168
Figure 6.22 relation “compares” in pullback structure ... 169
Figure 6.23 Flowchart of implementation ... 169
Figure 6.24 The relationships between specification and verification ... 172
Figure 6.25 Interface of verification ... 173
Figure 7.1 Engine block ... 176
Figure 7.2 Function map [4] ... 180
Figure 7.3 Examples of function [5] ... 181
Figure 7.4 Parameters selection example [6] ... 183
Figure 7.5 Selection of roughness values according to function [1] ... 183
Figure 7.6 Abstract model for the Function knowledge-base ... 184
Figure 7.7 Diagram of a pattern language ... 186
Figure 7.8 The set of subsets of {x,y,z}, ordered by inclusion ... 190
Figure 7.9 Poset of “Contexts” ... 191
Figure 7.10 Example of Product order ... 192
Figure 7.11 Product order of Function pattern language ... 192
Figure 7.13 Interface of the insertion of a new example ... 194
Figure 7.14 Interface of the insertion of a new Pattern ... 195
Figure 8.1 General process selection flowchart [5] ... 199
Figure 8.2 Example of drilling process ... 200
Figure 8.3 Structure of manufacturing processes ... 206
Figure 8.4 An example of PRIMA form ... 207
Figure 8.5 Category model of Manufacturing Knowledge-base ... 209
Figure 8.6 Interface of Manufacturing knowledge-base ... 210
Figure 8.7 Output Interface of Manufacturing knowledge-base ... 211
Figure 9.1 – Hip replacement system (http://www.hipreplacementinfo.com/hip/treatmentoptions/hipreplacement/hip_replace ment_material_and_technology.cfm) ... 214
Figure 9.2 Schematic of the replacement hip joint in situ (www.hipsandknees.com)214 Figure 9.3 – Femoral head and cup showing an area of severe wear ... 215
Figure 9.4 A-W diagram ... 217
Figure 9.5 Flowchart of metrology procedures ... 219
Figure 9.6 Interface of “Virtualsurf” ... 219
Figure 9.7 Interface of procedures for metrologists ... 220
Figure 9.8 Interface of Function knowledge-base ... 221
Figure 9.9 Interface of Specification knowledge-base ... 222
Figure 9.10 Output of Specification knowledge-base ... 222
Figure 9.11 Output of the Verification knowledge-base ... 223
Figure 9.12 Characteristics of Suggested Instruments ... 224
Figure 9.13 Interface of the insertion of a new example ... 225
Figure 9.14 Cylinder liner with the piston ... 226
Figure 9.15 Piston rings ... 226
Figure 9.16 Interface of “Virtualsurf” ... 229
Figure 9.17 Interface of procedures for designers ... 229
Figure 9.18 Interface of Function knowledge-base ... 230
Figure 9.19 Interface of Specification knowledge-base ... 231
Figure 9.20 Output of specification knowledge-base ... 232
Figure 9.21 Interface of Manufacture knowledge-base ... 233
Figure 9.22 Output of Manufacture knowledge-base ... 233
Figure 9.23 Output of Verification knowledge-base ... 234
LIST OF TABLES
Table 2.1 The relation teaching ... 25
Table 2.2 A set of simple relations ... 26
Table 2.3 Comparison of data models ... 32
Table 3.1Category theory concepts and representational measurement theory concept ... 48
Table 3.2 Comparison of data models ... 55
Table 3.3 The relation studying ... 57
Table 3.4 A set of simple relations ... 57
Table 4.1 Examples of knowledge characteristics ... 104
Table 5.1 Indication of surface lay ... 118
Table 5.2 Num_cutoff for profile parameters ... 120
Table 5.3 Num_cutoff for parameters based on material ratio curve ... 120
Table 5.4 Sampling lengths for profile parameters ... 121
Table 5.5 Roughness sampling lengths for the measurement of Ra, Rq, Rsk, Rku, R∆q and curves and related parameters for non-periodic profiles (for example ground profiles) ... 121
Table 5.6 Roughness sampling lengths for the measurement of Rz, Rv, Rp, Rc and Rt of non-periodic profiles (for example ground profiles) ... 122
Table 5.7 Roughness sampling lengths for the measurement of R-parameters of periodic profiles, and RSm of periodic and non-periodic profiles ... 122
Table 5.8 Sampling lengths for parameters based on material ratio curve ... 122
Table 5.9 Evaluation lengths for profile parameters ... 123
Table 5.10 Evaluation lengths for parameters based on material ratio curve ... 124
Table 5.11 Transmission band for motif parameters ... 126
Table 5.12 Lower limit for profile parameters ... 127
Table 5.13 Relationship between the roughness cut-off wavelength λC, tip radius and roughness cut-off ratio λC/ λs, ISO 3274 [8] ... 127
Table 5.14 Lower limit for motif parameters ... 128
Table 5.15 Lower limit for parameters based on material ratio curve ... 128
Table 5.16 Profile parameter names and types ... 130
Table 5.17 Motif parameter names and types ... 130
Table 5.18 Parameters based on material ratio curve ... 130
Table 6.1 Relationship between the roughness cut-off wavelength λc and maximum sampling spacing [5] ... 151
Table 6.2 Cut-off wavelength for profile parameters ... 152
Table 6.4 The characteristics for typical methods [13] ... 156
Table 7.1 Relationship between surface function and quality [1] ... 178
Table 7.2 Preferred roughness values Ra [1] ... 182
Table 8.1 Example of Manufacturing process PRIMA selection matrix [5] ... 202
Table 8.2 Texture lay with typical manufacturing processes [7] ... 203
Table 8.3 Surface roughness values produced by common production processes [9]204 Table 8.4 choice of cut-off wavelength for a number of common machining operations [10] ... 205
Table 9.1 A comparison of some surface roughness parameters calculation on femoral heads [2] ... 217
Table 9.2 The test plan used in the FDE [13] ... 228
Chapter 1
Introduction
1.1 Motivation
A geometrical product is a manufactured component having shape, dimensional, form and surface properties. Geometrical Product Specification (GPS) impacts all products in terms of these properties, from macro- to nano-scale components, from top-down manufacturing to bottom-up processes [1]. It applies to high-tech, defence, aerospace, automotive, electronics, computing, MEMS, biomedical, domestic and most manufactured products.
GPS is the means of communication in which designers, production engineers and metrologists exchange unambiguous information concerning product GPS requirements [1]. Because of this GPS documentation may be regarded as the basis of a binding legal contract. In such a market, GPS is the only stable means of communication. Consequently, incorrect and ambiguous definitions of GPS-requirements constitute high economical risks to industry and are liable to be subject to disputes between companies. Thus the understanding and implementation of the GPS system is very important to industry.
In order to optimise resources through the scientific and economic management of the variability of all production processes, the next generation GPS system [2&3] has been shown to be a revolutionary breakthrough. However its wide acceptance and application in industry has been a great problem. The next generations of GPS standards are considered to be too theoretical, abstract, complex and over-elaborate. It is proving very difficult for industry to understand and operate them effectively. This point is especially true for small and medium businesses, where resources are not available to interpret and implement GPS correctly.
Interactive Surface Modeling (ISM) developed by Chalmers University of Technology [4] connected the functional demands with the characterization and the manufacturing of the surface together, but since it relies on the relational database, it lacks a fundamental platform for general surface texture knowledge.
In this thesis, the mathematical foundations for a knowledge-based VirtualSurf system are developed. It is envisaged that the VirtualSurf system will overcome the above mentioned problems for surface texture, which is a critical part of the next generation of GPS, and act as a next generation smart standard for surface texture. It aims to advance considerably the current state-of-the-art by creating a virtual knowledge-based intelligent system to solve difficulties in surface texture specification and verification [5]. The VirtualSurf system will be used by designers, production engineers and metrologists as a tool to provide a common language for understanding surface texture.
1.2 Objectives and Approaches
A knowledge-based system is developed which will provide expert knowledge of surface texture to link surface function, specification of micro- and nano-geometry through manufacture, and verification. The intelligent knowledge-base should be capable of incorporating knowledge from multiple sources (standards, books, experts, etc), adding new knowledge from these sources and still remain a coherent reliable system. The system should provide a universal platform for engineers in industry, making it easier for them to understand and use the latest surface texture knowledge. The thesis comprises a number of component studies in order to fulfil the above aim, these studies comprise:
1. An investigation of the different knowledge entities/structures within surface texture and finding suitable categories that describes them. The knowledge-bases cover: function, specification, manufacture and verification of surface texture knowledge for the profile design and metrology; including: functional requirements, parameter selection, filtration, manufacturing methods, instrumentation, and measurement parameters.
using category theory will be applied to define the relationships between the previously identified entities/structures.
3. A specification knowledge-base will be developed, which can be used to provide correct and unambiguous geometrical specifications (the technical specification) relevant to the functional design intent; A verification knowledge-base will be developed to provide appropriate measurement procedures and equipment appropriate to the technical specifications; A function knowledge-base will then be developed to specify the functional design intent of the surface; And a manufacturing knowledge-base will be developed to choose a suitable production process to manufacture surfaces according to the technical specifications;
4. The relationships and structures in knowledge-bases above will be identified and represented using category theory in order to transform them into a computer readable form for an intelligent system to make inferences.
5. Two case studies will illustrate the synthesise of four knowledge-bases into one integrated knowledge-based system.
1.3 Novel work
The novel work in this thesis is applying category theory [6-9] in the following aspects:
Representation of a stable measurement procedure. The stability of measurement
procedures is very important for design and metrology of a product [10-11]. Category theory is used to describe and define the stability of a measurement procedure, which ensures the consistency of knowledge acquisition for knowledge-based system.
Representation of the knowledge stored in the knowledge-based system. The
category model based on category theory [12-16] generates different data models and provides a fundamental formula for knowledge representation in this thesis.
Representation of the data refinement process [17]. Data refinement is used to
convert a simplified abstract data model into a complex implementable data model. During the refinement processes, the initial knowledge-base is refined to produce a high-performance system. Category theory is applied to secure the consistency between simplified abstract models and complex implementable models.
Application of the developed categorical structures to identify and model the
1.4 Structure of the thesis
The various knowledge sources will be investigated in this thesis, not only from the engineering field, but also from computer science and mathematics. Chapter 2 introduces the background of knowledge-based system (KBS). Knowledge representation is the key procedure to the design of a KBS. Different data models for knowledge representation are then investigated and compared. A new data model – category model is introduced in Chapter 3, which is the mathematical foundation in this thesis and applied to represent surface texture knowledge.
Chapter 4 begins to discuss about the GPS system and surface texture general model. Different structures for separate knowledge-bases in the general model are investigated, providing a guideline for refinement processes in next few chapters. Chapters 5 to 8 are focused on the main design of knowledge-based system: specification knowledge-base refinement, verification knowledge-base refinement, function knowledge-base refinement and manufacture knowledge-base refinement respectively. Detailed refinement procedures are described and then knowledge representation models have been provided together with interfaces of the system. Two case studies are discussed in Chapter 9 which provide examples and illustrate the implementation of the integrated Virtualsurf system.
Finally, Chapter 10 provides a summary, conclusions and some future works.
References
[1] X. Jiang (2004), A Knowledge-Based Intelligent System for Engineering and Bio-medical Engineering Surface Texture (VirtualSurf), University Research Project
[2] ISO/TR 14638 (1995), Geometrical Product Specifications (GPS) –Masterplan,
International Organisation for Standardisation, Geneva
[3] ISO TC/213 (2001), Vision Statement, http://isotc213.ds.dk
[4] Robert Ohlsson (1996), A Topographic Study of Functional Surfaces, Thesis for the Degree of Doctor of Philosophy, Chalmers University of Technology, ISBN 91-7197-351-6
[5] ISO/TC213 WG16N084 (2003): Masterplan for the uniform of surface texture for profile and areal standards
[6] William Lawvere & Stephen H. Schanual (1997), Conceptual Mathematics, A first introduction to categories, Cambridge University Press, ISBN 0-521-47817-0
[7] Benjamin C. Pierce (1991), Basic Category Theory for Computer Scientists, MIT press, ISBN 0-262-66071-7
ed, Prentice Hall, ISBN 0-13-323809-1
[9] J. Lambek and P. J. Scott (1986), Introduction to higher order categorical logic, Cambridge University Press, ISBN 0-521-24665-2
[10] Paul J Scott (2006), The case of surface texture parameter RSm, Measurement Science and Technology, 17, 559-564
[11] Paul J Scott (2004), Pattern analysis and metrology: the extraction of stable features from observable measurements, Proc.R.Soc.Lond.A (2004) 460, 2845-2864 [12] Stefan Stanezyk (1993), Theory and Practice of Relational Databases, UCL Press Ltd, ISBN 1-85728-232-9
[13] John G. Hughes (1991), Object-Orientated Databases, Prentice Hall, ISBN 0-13-629874-5
[14] M.Z. Bleyberg (1992), A Categorial View of Databases, Computing and Information Sciences Department, Kanas State University, http://www.cis.ksu.edu/~maria/papers/ara.ps
[15] N.N Rossiter & D.A Nelson (1994), The Categorical Product Data Model as Formalism for Object-Relational Databases, Technical Report 505, Department of Computing Science, University of Newcastle, 1995
[16] D.A Nelson & N.N Rossiter (1995), Prototyping a Categorical Database in P/FDM, Technical Report 532, Department of Computing Science, University of Newcastle, 1995
Chapter 2
Knowledge-based system
2.1 Introduction
It is widely recognized that “Knowledge-based systems (KBSs) are tools for building applications that draw logical inferences from their stored knowledge of the problem domain” [1]. In around sixty years’ development history, KBSs already has several applications, such as modern database and expert systems. All of them have the same KBS framework but also have different emphasis among the components. For example, the database has the advantage of storing large amounts of data information, while the expert system is good at producing inferences.
In general, a KBS has three main components: knowledge-base, inference engine and end-user interface. In the design of a KBS, knowledge acquisition and representation of a knowledge-base is the first and one of the most important procedures. The latter section of this chapter then focuses on introduction of different data models for knowledge representation, including traditional data models, the fuzzy model and the pattern language.
2.2 Knowledge-based System
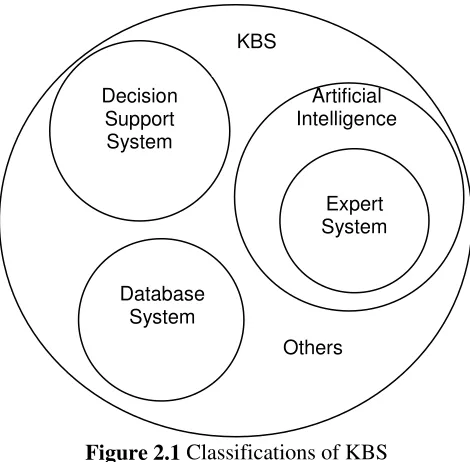
Figure 2.1 Classifications of KBS
Databases are now very commonly used in many commercial areas. A database is a shared collection of structured data, designed to meet the needs of an organization’s information system [4]. In order to convey a designer’s understanding of the information of the enterprise, a high-level data model is used in the design to represent the data information in databases. A data model is a general architecture for describing data, relationships between data and constraints on the data. It normally includes three essential components: the first, a structural part, including a set of rules which are used to construct the database; the second, a manipulative part, i.e. the operations that are allowed on the data; and the third, a set of integrity rules, which ensures the accuracy of the data [4].
Expert system is another technology devoted to representing real world aspects. It came from the development of AI (artificial intelligence). The expert system is a computer system that draws upon knowledge from human experts in a particular domain to solve problems that normally require human expertise in that domain; it must be capable of solving problems directly [5]. Similar to a database system in that an expert system contains a knowledge base, but it also represents another kind of knowledge—namely rules, which is a major component of the expert system. Rules can be used to infer new instances of the objects or new instances of a relationship from previous objects.
In the early days, database and expert systems were developed to represent different aspects of the real world. Database systems had the ability to store large amounts of
Artificial Intelligence KBS
Others Decision
Support System
Expert System Database
structured data, together with sophisticated data management facilities; while expert system aimed to store rules and had the ability to produce inferences. It is clear that the combination of these two technologies would benefit both of them: with expert systems contributing to database systems in areas such as providing a useful reasoning ability and database systems contributing to expert systems in giving them the ability to access large collections of facts [2].
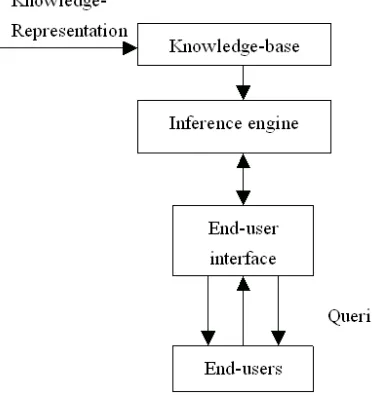
[image:24.595.206.392.396.595.2]Knowledge-based systems are tools for building applications that draw logical inferences from their stored knowledge of the problem domain [1]. Both database systems and expert systems are particular kinds of knowledge-based systems and have the same general framework, see figure 2.2. The main components of the basic structure of a KBS include [3]: Knowledge-base, inference engine and end-user interface. The knowledge-base consists of facts, rules, heuristics, and other relevant information, and is used by the inference mechanism to provide expert opinion and other useful resources for the users through an interface. This interface must be user friendly to allow the user to easily use the systems.
Figure 2.2 Basic Structure of a KBS
SQL server already have the ability to represent knowledge and also use programming language to make inferences, and they all use the traditional data representation model – relational data model. The details are introduced in the next section.
2.3 Knowledge representation
Knowledge-base requires special data models for the knowledge representation. There are some popular data models for data (knowledge) representation at present. They all have some advantages and disadvantages. There are two rules to evaluate a data model for certain knowledge representation: 1) naturally represent the knowledge; 2) needs to be easy to search and modify the knowledge.
2.3.1 Different data models
The following discusses different data models for knowledge representation.
2.3.1.1 Traditional data models (record-based data models)
Traditional data models include: network data model [4], hierarchical data model [4] and the relational data model [4]. They are all record-based logical data models.
Network model
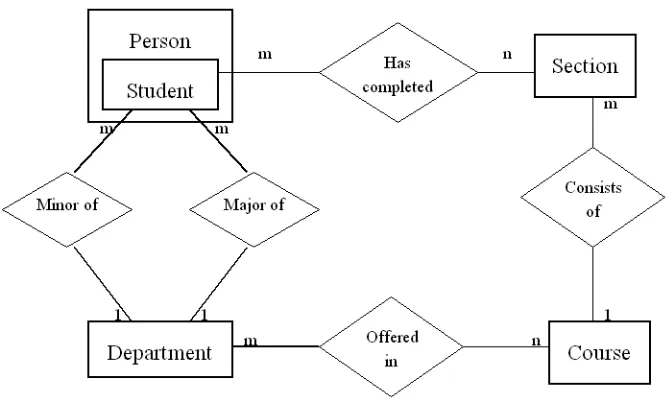
In the network model, data is represented as collections of records and relationships are represented by sets [4]. Figure 2.3 shows an example graph structure of a network model, in which records appear as nodes and sets appear as edges. The set type “major of” links the owner record type “department” together with the member record type “student”.
The hierarchical model
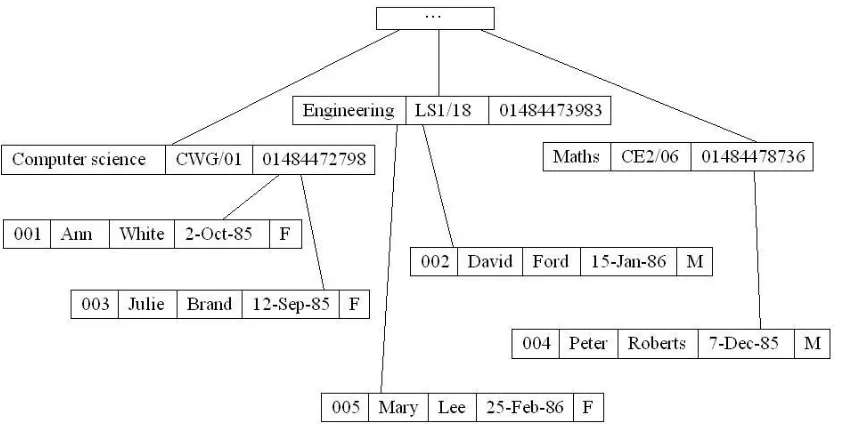
The hierarchical data model is a restricted network model, in which each node is allowed to have only one parent [4], see figure 2.4, it is a general tree structure. Again, data is represented as collections of records and relationships are represented by sets.
Figure 2.4 An example of a hierarchical schema
The relational model
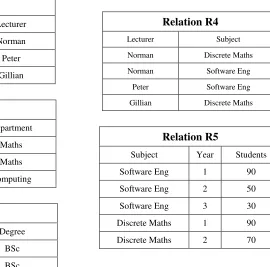
The relational model is based on mathematical relations, in which data and relations are both represented as tables [4]. Table 2.1 and Table 2.2 give a typical relational data model [6].
Location Lecturer Department Degree Subject Year Students
Building A Norman Maths BSc Software Eng 1 90
Building A Norman Maths BSc Software Eng 2 50
Building A Norman Maths BSc Software Eng 3 30
Building A Norman Maths BSc Discrete Maths 1 90
Building A Norman Maths BSc Discrete Maths 2 70
Building B Peter Maths BSc Software Eng 1 90
Building B Peter Maths BSc Software Eng 2 50
Building B Peter Maths BSc Software Eng 3 30
Building B Gillian Computing BSc Discrete Maths 1 90
[image:26.595.93.514.160.373.2]Building B Gillian Computing BSc Discrete Maths 2 70
Relation R1
Location Lecturer
Building A Norman
Building B Peter
Building B Gillian
Relation R2
Lecturer Department
Norman Maths
Peter Maths
Gillian Computing
Relation R3
Subject Degree
Software Eng BSc
Discrete Maths BSc
Relation R4
Lecturer Subject
Norman Discrete Maths
Norman Software Eng
Peter Software Eng
Gillian Discrete Maths
Relation R5
Subject Year Students
Software Eng 1 90
Software Eng 2 50
Software Eng 3 30
Discrete Maths 1 90
[image:27.595.220.490.76.343.2]Discrete Maths 2 70
Table 2.2 A set of simple relations
The relational data model is based on the mathematical theory of sets and relations. In this model, data relationships are represented by tables, each horizontal row describes a record (tuple) and each column describes one of the attributes (data fields) of the record, as illustrated in table 2.1[3]. The relation teaching can be viewed as a model of a particular view of the faculty’s teaching system. Table 2.2 shows a better model representing a set of simple relations that captures the same information as Table 2.1; there is no redundant information here. A number of mathematical operations can then be applied to the relations themselves.
The first two data models were mainly used in early database systems; they still require the users to know how to access the physical database. Now the majority of commercial database systems are based on the relational data model, which provides data independence.
2.3.1.2 Object-based data models
world, object-based data models are used in the design, such as entity relationship data model and some semantical data models: functional data model, object-oriented data model etc.
The entity-relationship model
[image:28.595.129.464.275.475.2]The entity – relationship model is a high-level conceptual data model, and is commonly used as a basis of the logical data model design for the database system [4]. It comprises the entity, the relationship types and the attributes. Figure 2.5 shows an example of an entity-relationship data model.
Figure 2.5 An example of an entity-relationship data model
The functional model
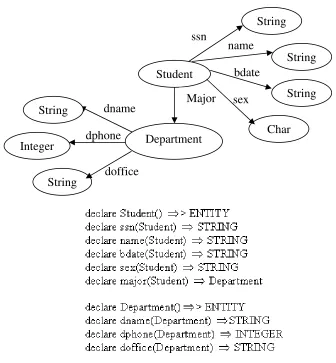
The functional data model is based on entities and functions, and also provides a natural language DAPLEX to give a more natural representation [7]. DAPLEX is a data definition and manipulation language for database systems, attempting to provide a database system interface which allows the users to more directly model the way they think about the problems they are trying to solve [7]. Therefore, the Functional data model has been proposed as a suitable formal and practical basis for object-oriented databases.
each arrow represents the name of the function with each entity, and the entity type at the head of each arrow represents the function’s type. The single headed arrows are single-valued functions, i.e. return one entity, and the double headed arrows are multi-valued functions, i.e. return a set of entities. It is no longer required to create extra tables as in the relational model, multi-valued functions allow a many-to-many, or one-to-many relation to be defined [7].
The object-oriented model
The object-oriented data model receives more and more attention these days with the development of the object-oriented programming [4]. It’s a (logical) data model that captures the semantics of objects supported in object-oriented programming. It allows the real world to be modeled more closely, as it supports the building of complex objects, which are more natural and realistic representation of real-world objects. Figure 2.7 gives an example of object-oriented schema. A relation or table in a relational data model can be considered to be analogous to a class in an object-oriented data model, such as “Department”. A tuple is similar to the attributes of a class, such as attributes “dname”, “doffice” and “dphone”. There are no behaviours represented in the relational data model, which can be defined by a set of operations in the object-oriented data model.
Figure 2.7 An example of object-oriented schema
There are several advantages of object-oriented databases [4]:
1) Enhanced modeling capabilities. The object, which encapsulated both state and behaviour naturally represents real world objects. It provides higher performance management of objects, and enables better management of the complex interrelationships between objects.
2) Removal of impedance mismatch1 .It eliminates many inconveniences that occur in mapping a declarative language such as SQL and an imperative language such as “C”.
3) Support for long duration transactions.
1
The main drawback of the object-orientation database is that there is no universally agreed data model for an object-oriented DBMS, and most models lack a theoretical foundation.
Expert system – production rules
There are three representation formalisms used in conventional expert systems to represent domain knowledge [8]: Production rules, structured objects and predicate logic. Production rules are certainly the most prevalent of the three. Expert system designed using the production rule formalism is said to be a production system. Production rules, also known as “condition-action” rules or “if-then” rules, consist of condition and action pairs of the form “IF condition THEN action", i.e., if there exists conditions 1 to n, then perform actions 1 till n, see figure 2.8.
Figure 2.8 Production rules
The production rules define a set of allowed transformations which move a problem from its initial statement to its solution. The following are some examples of production rules, see figure 2.9.
Figure 2.9 Sample production rules
conditions or IF parts of the rule in the knowledge-base, and then forward the data stored to the goal to be solved.
Traditional expert systems can store few facts, when more facts need to be accessed, the reaction and efficiency of the system will decrease rapidly.
Comparison of different models
The popular methods of the knowledge representation are discussed above, which are relational data model, object-oriented data model and production rules. Although they are most prevalent methods today, they all have their own main drawback.
The dominant paradigm for data models is the “relational data model” [9]. However, the attributes of simplicity, including the minimality (i.e., a small number of data constructs) and nonredundancy make the relational model unrepresentive of the way humans model the world. Therefore, they are not sufficient for some new applications, such as engineering databases, e.g. CAD (computer-aided design), multimedia databases etc. Those applications require new features of the database [4], including: 1) Complex objects: A complex object in the real world contains other objects.
2) Behavioural data: Distinct objects may need to respond in different ways to the same command. This capability is provided by the methods of OODBs and by the rule base of Knowledge based systems.
3) Meta knowledge: General rules about the application rather than specific tuples (i.e., data about data) form an important part of expert databases.
4) Long duration transactions: some applications involve human interaction with the data, which lead to long transactions.
In these situations, the object-oriented data model [10] is appropriate to meet the requirements [4]. The object in the model includes not only the attributes that describe the state but also the actions associated with the object, and its behaviour. The object is said to encapsulate both state and behaviour. But unfortunately this data model lacks a universal formal basis and mathematical foundations to ensure the database remains a coherent and reliable system as new knowledge is added.
Another data representation method - Production rules of expert system have good inference abilities, but lack the ability to store abundant knowledge.
data model has good mathematical foundations, the knowledge must take the structure of a table, making it very inflexible and unnatural when applied to real world problems. The object – orientated data model has the flexibility for knowledge to take any structure but lacks a universal formal basis and mathematical foundations. And the production rules lack the ability to store abundant knowledge.
Universal formal basis
Mathematical foundations
Flexibility of structures
Abundant knowledge
Relational Model √ √ √
Object-oriented Model √ √
Production rules √ √
Table 2.3 Comparison of data models
2.3.2 Fuzzy logic
There is a problem of knowledge representation that the conventional systems have never handled satisfactorily: the ability to handle uncertain or incomplete information. In order to represent vagueness or uncertainty, fuzzy logic is developed, with a continuous range of possibilities from 0 for impossible to 1.0 for certainty [11].
Now the fuzzy logic is applied more and more to the database systems, much work has been done in fuzzy conceptual data modeling, namely fuzzy modeling. Some of them are extended to the entity-relationship models and some are extended to the object-oriented models.
Fuzzy sets
Classical set theory is based on two-valued logic, which says a must either be in set A or in set not-A, there is no situation that is both a in set A and a in set not-A. A fuzzy set is a set without a crisp, clearly defined boundary. It can contain elements with only a partial degree of membership. A fuzzy set is therefore a function, f, from an appropriate domain to the interval [0,1], where f(x) =0 denotes that x is not a member of the set, f(x) = 1 denotes that x is definitely a member, and all other values denote degrees of membership [8].
For example, consider a set S is the results of six students in an exam. S = {50, 48, 65, 70, 85, 95}, which is a classical set.
monotonically increasing values between the two. Thus the good results set can be obtained as follows:
Good-results = {(50, 0.17), (48, 0.13), (65, 0.42), (70, 0.5), (85, 0.75), (95, 0.92)}
Fuzzy logic
Classical set theory is governed by a two-valued logic, while a fuzzy set theory can be represented to a many-valued logic in which propositions such as good-results have a value which is a real number between 0 and 1[8].
In fuzzy logic, the truth of any statement becomes a matter of degree. Fuzzy logic deals with conjuction by taking the minimum value of the disjuncts, thus
f(F/G)(x) = min(fF(x),fG(x))
e.g. good-results(50)^ ¬good-results(50) = 0.17
Fuzzy logic deals with disjuction by taking the maximum value of the disjuncts, thus
f(F/G)(x) = max(fF(x),fG(x))
e.g. good-results(95)v ¬good-results(95) = 0.92
Fuzzy object-oriented model
Fuzzy concepts are considered at different levels of the object-oriented model [12]: a) Attribute values: the probability measures defined within the [0,1]-interval
can be used to express the explicit uncertainty that affects an attribute value. b) Relationships among objects: a new attribute can be used to stand for the belief in the corresponding aggregation, and use the appropriate truth scales for dealing with explicit uncertainty, i.e., add an extra attribute to the class to express the importance or strength in the connection.
c) Class extents: it only needs to add an extra attribute to the class and extend in a fuzzy way. The domain of this attribute could be the interval [0,1]. d) Inheritance relationships: use static variables of the suitable scales to express
these connection degrees.
verifying the following properties:
• For any i ∈ 1..n − 1, Sub{Ci} = {Ci+1} (Sub{Ci} stands for the set of subclasses of Ci).
• For any i ∈ 2..n, Sup{Ci} = {Ci-1} (Sup{Ci} stands for the set of superclasses of Ci).
• A finite sequence of values αi exists, associated with the hierarchy, such that α1 = 1, αn > 0, and αi > αi+1.
Each class of the hierarchy is used to represent an α-cut of the type being defined.
Fuzzy expert system
Fuzzy concepts are also used in the expert system, namely fuzzy expert system or fuzzy inference system. Fuzzy inference is the process of formulating the mapping from a given input to an output using fuzzy logic.
The following is the process to interpret if-then rules with fuzzy logic:
a) Fuzzy inputs: Resolve all fuzzy statements in the inputs to a degree of membership between 0 and 1. If there is only one part to the input, this is the degree of support for the rule.
b) Apply fuzzy operator to multiple part inputs: If there are multiple parts to the inputs, apply fuzzy logic operators and resolve the inputs to a single number between 0 and 1. This is the degree of support for the rule.
c) Apply implication method: Use the degree of support for the entire rule to shape the output fuzzy set. The consequent of a fuzzy rule assigns an entire fuzzy set to the output. This fuzzy set is represented by a membership function that is chosen to indicate the qualities of the consequent. If the input is only partially true, (i.e., is assigned a value less than 1), then the output fuzzy set is truncated according to the implication method.
2.3.3 Pattern language
language gives several solutions under different contexts and forces, and then users can choose the most suitable one matching the current circumstance.
The term ‘Pattern language’ was initially introduced in Christopher Alexander’s book ‘A Pattern Language: Towns, Buildings, Construction’ [13], which is used to refer to common problems of civil and architectural design, from how towns should be laid out to where windows should be placed in a room.
The idea was soon expanded into popular diverse fields, such as computer science patterns used in software engineering, interaction design patterns in human computer interaction and pedagogical patterns in education.
Pattern
‘Each pattern describes a problem that occurs over and over again in our environment and then describes the core of the solution to that problem in such a way that you can use this solution a million times over without ever doing it the same way twice. ’ [13] A single design pattern in pattern language is that a common problem (or decision) in a design process, together with its best solution. Each pattern has a name, a descriptive entry, and some cross-references, much like a dictionary entry.
A pattern language
Just as words must have grammatical and semantic relationships to each other in order to make a spoken language useful, design patterns must be related to each other in order to form a pattern language. The patterns should be organized into a logical or naturally intuitive structure. Each pattern should indicate its relationship to other patterns and to the language as a whole [14].
A pattern language is a linked structure of patterns within a particular domain. It is characterized by
a) Naming the common problems in a field of interest
b) Describing the key characteristics of effective solutions for meeting some stated goals
c) Helping the designer move from problem to problem in a logical way d) Allowing for many different paths through the design process
Pattern form
A pattern is applied to document expertise. The typical pattern form includes the following items [15]:
Name: A word or simple phrase to describe the pattern. Context: When to apply the problem.
Problem: A statement of the problem.
Solution: A solution to the problem. Many problems have more than one solution. The success of a solution is affected by the context or circumstances in which the problem exists.
Force: The often contradictory considerations to be considered when choosing a solution to a problem. Each solution considers certain forces. It optimizes some and may totally ignore others. The relative importance of the forces is determined by the context.
2.4 Summary
The knowledge-based system has been presented in this chapter, including the definition, the classification and the general structure. Some typical applications of KBS are introduced, such as database, expert system, DSS etc. The Knowledge-based System intended to be developed in this research is a new application of KBS, which generalizes both Database System and Expert System. Unlike the DSS, it’s not designed to do decision making itself, it is used to give some suggestions or remind the user what needs to be done and how to do certain procedures. It is like a library or a help document covering all the useful knowledge of surface texture, and also has a friendly user interface to allow the users to make enquires and easily get what they want to know.
order to satisfy the requirements, which not only has a good mathematical foundation, but also has flexible structures for abundant knowledge.
References
[1] D.M. Hembry (1990), Knowledge-based systems in the AD/cycle environment, IBM Systems Journel, 29(2), 274-286
[2] Paul Beynon-Davies (1991), Expert Database Systems: A Gentle Introduction,
McGRAW-HILL Book Company (UK) Limited, ISBN 0-07-707240-5
[3] D. Partridge and K.M.Hussain (1995), Knowledge Based Information Systems,
McGRAW-HILL Book Company Europe, ISBN 0-07-707624-9
[4] Thomas Connolly and Carolyn Begg (1998), Database Systems: A Practical Approach to Design, Implementation, and Management, Addison Wesley, ISBN 0-201-34287-1
[5] J L Alty and M J Coombs (1984), Expert systems: Concepts and examples, NCC publications, ISBN 0-85012-399-2
[6] Norman Fenton and Gillian Hill (1993), Systems Construction and Analysis: A Mathematical and Logical Framework, McGRAW-HILL Book Company Europe, ISBN 0-07-707431-9
[7] Shipman (1981), The Functional Data Model and the Data language DAPLEX,
Computer Corporation of America, ACM Transactions on Database Systems, 6(1981) 140-173
[8] Peter Jackson (1999), Introduction to expert systems, Addison Wesley Longman Limited, ISBN 0-201-87686-8
[9] Stefan Stanezyk (1993), Theory and Practice of Relational Databases, UCL Press Ltd, ISBN 1-85728-232-9
[10] John G. Hughes (1991), Object-Orientated Databases, Prentice Hall, ISBN 0-13-629874-5
[11] John F. Sowa (2000), Knowledge Representation: Logical, Philosophical, and Computational Foundations, Thomson Learning, ISBN 0 534-94965-7
[12] Zongmin Ma (2005), Advances in Fuzzy Object-Oriented Databases: Modeling and Applications,Idea Group Publishing, ISBN 1591403847
[13] Christopher Alexander (1977), A Pattern Language: Towns, Buildings, Construction, New York: Oxford University Press
[14] Pattern language, Wikipedia, the free encyclopedia, http://en.wikipedia.org/wiki/Pattern_language
Chapter 3
Category Model for Knowledge-based system
3.1 Introduction
Category theory is a general mathematical theory that deals in an abstract way with mathematical structures and relationships between them [1]. The basic concepts of category theory include categories, functors, natural transformations etc. In this thesis, category theory is used to resolve three important issues in the design of a knowledge-based system.
The first application of category theory is in the representation of a stable measurement procedure. Measurement can be found everywhere in daily lives, including product manufacturing. The stability of measurement procedures is very important for design and metrology of a product. Category theory is used to describe and define the stability of a measurement procedure.
The second application of category theory is the representation of the knowledge stored in the knowledge-based system. The category model based on category theory generates different data models and provides a fundamental formula for knowledge representation in this thesis.
The third application of category theory is the representation of the data refinement process. Data refinement is used to convert a simplified abstract data model into a complex implementable data model. During the refinement processes, the initial knowledge-base is refined to produce a high-performance system. Category theory, particularly the concepts of fibration and adjointness, is applied to secure the consistency between simplified abstract models and complex implementable models.
3.2 Measurement theory applies Category theory
3.2.1 Three theories of measurement
Different interpretations of measurement can lead to different models. There have been three main theories of measurements: representational measurement theory which is the dominant current measurement paradigm, operational measurement theory and classical measurement theory [3].
3.2.1.1 Representational measurement theory
The representational measurement theory consists of the following [3]:
1) An empirical relational system (ERS) including a set of objects with the relations between them, each of objects has one or more common attributes.
2) A numerical relational system (NRS) comprising numbers and the relationships between them. The numbers form the values of a variable.
3) A set of mappings from ERS to NRS, in such a way that the relationships between objects are matched by relationships between numbers.
Figure 3.1 Mohs hardness scale for minerals
For example the Mohs hardness scale for minerals in figure 3.1 illustrates these ideas: the numbers in NRS match the hardness properties in ERS. It is obvious that Diamond is the hardest as it is designated by the number 10; therefore, it is harder than Corundum which is designated by the number 9, and Corundum is harder than Topaz etc. Talc is the least hard as it is designated by the number 1.
Empirical Relational System
Diamond
Corundum
Topaz
Quartz
Orthoclase
Apatite
Fluorite
Calcite
Gypsum
Talc
Numerical Relational System
10
9
8
7
6
5
4
3
2
3.2.1.2 Operational measurement theory
Operationalism defines scientific concepts in terms of the operations used to identify or measure them. Thus, an attribute is defined by its measuring procedure, no more and no less, and has no ‘real’ existence beyond that. In operationalism the attribute and the variable are one and the same. This approach thus defines a measurement as any precisely specified operation that yields a number. It follows that, to be useful, the numerical assignment procedure has to be well defined. Arbitrariness in the procedure will reflect itself in ambiguity in the results [3]. Operationalism survives to this day with considerable influence in the social and behavioral sciences (especially psychology), where the methodological war cry to "operationalize your variables!" [4].
3.2.1.3 Classical measurement theory
According to classical measurement theory, measurement addresses the question of how much of a particular attribute an object has and thus only refers to attributes that are quantitative, i.e. an attribute whose values satisfy ordinal and additive relationships. Classical measurement theory involves the discovery of the relationship between different quantities of the given attribute. The key word here is “discovery”.
3.2.1.4 Comparison of three measurement theories
Representational measurement theory seeks to represent or model empirical relationships, and so is based on a mapping from an assumed underlying reality; while in operational measurement theory, things start with the measurement procedure. Operationalism avoids assuming an underlying reality and so is fundamentally different from representationalism.
Representational measurement theory assigns numbers to objects to model their relationships, and operational measurement theory assigns numbers according to some consistent measurement procedure, classical measurement theory discovers pre-existing relationships.
The operational theory makes the question impossible to ask, since there is no such thing as "intelligence" as distinct from scores on intelligence tests. The assessment of intelligence is as such measuring what is in the black box. The approach in operationalism defines a measurement as any precisely specified operation that yields a number. However, this number can not always exactly reflect human intelligence. The classical theory allows the question, "What do IQ tests really measure?" [5]. It is the procedure to discover the relationship between different quantities of the given attribute, such as intelligence, but it is difficult to see how intelligence can be regarded as having a magnitude susceptible to classical measurement by Michell's definition [7].
3.2.2 Stable measurement procedure
The representational measurement theory will be used to define the stability of the measurement procedure [8-9]. The measurement consists of the following under the representational measurement theory:
1) An empirical relational system (ERS) including a set of objects on which a measurand is defined together with the relations between measurands.
2) A numerical relational system (NRS) comprising numbers (derived values) and the relationships between them.
3) A set of mappings, called the measurement procedure, from ERS to NRS, in such a way that the relationships between measurands are matched by relationships between numbers.
It is considered here that when a measuring procedure is mathematically stable a “small” difference in the derived values implies a “small” difference in the measurand. Relationships between measurement values should reflect functional significant properties between the measurands or else the measurement has little practical meaning [8].