Will this Course Increase or Decrease Your
GPA? Towards Grade-aware Course
Rec-ommendation
Sara Morsy
and EngineeringUniversity of Minnesota [email protected]
George Karypis
and EngineeringUniversity of Minnesota [email protected]
In order to help undergraduate students towards successfully completing their degrees, developing tools that can assist students during the course selection process is a significant task in the education domain. The optimal set of courses for each student should include courses that help him/her graduate in a timely fashion and for which he/she is well-prepared for so as to get a good grade in. To this end, we propose two differentgrade-aware course recommendationapproaches to recommend to each student his/her optimal set of courses. The first approach ranks the courses by using an objective function that differentiates be-tween courses that are expected to increase or decrease a student’s GPA. The second approach combines the grades predicted by grade prediction methods with the rankings produced by course recommendation methods to improve the final course rankings. To obtain the course rankings in both approaches, we adapt two widely-used representation learning techniques to learn the optimal temporal ordering between courses. Our experiments on a large dataset obtained from the University of Minnesota that includes stu-dents from 23 different majors show that the grade-aware course recommendation methods can do better on recommending more courses in which the students are expected to perform well and recommending fewer courses which they are expected not to perform well in than grade-unaware course recommendation methods.
Keywords:course recommendation, grade prediction, SVD, course2vec, representation learning, GPA
1. I
NTRODUCTIONElbadrawy and Karypis, 2016;Morsy and Karypis, 2017;Hu and Rangwala, 2018), predicting the final grade of the course based on the student’s ongoing performance during the term (Meier et al., 2015), in-class activities grade prediction (Elbadrawy et al., 2015), predicting student’s performance in tutoring systems (Thai-Nghe et al., 2011;Hershkovitz et al., 2013; Hwang and Su, 2015; Romero et al., 2008; Thai-Nghe et al., 2012), and knowledge tracing and student modeling (Reddy et al., 2016;Lan et al., 2014;Gonz´alez-Brenes and Mostow, 2012).
Bothcourse recommendation(Bendakir and A¨ımeur, 2006; Parameswaran et al., 2011; El-badrawy and Karypis, 2016;Bhumichitr et al., 2017;Hagemann et al., 2018) andgrade predic-tion(Sweeney et al., 2016; Elbadrawy and Karypis, 2016; Polyzou and Karypis, 2016;Morsy and Karypis, 2017;Hu and Rangwala, 2018) methods aim to help students during the process of course registration in each semester. By learning from historical registration data, course recom-mendation focuses on recommending courses to students that will help them in completing their degrees. Grade prediction focuses on estimating the students’ expected grades in future courses. Based on what courses they previously took and how well they performed in them, the predicted grades give an estimation of how well students are prepared for future courses. Nearly all of the previous studies have focused on solving each problem separately, though both problems are inter-related in the sense that they both aim to help students graduate in a timely and successful manner.
In this paper, we propose agrade-aware course recommendationframework that focuses on recommending a set of courses that will help students: (i) complete their degrees in a timely fash-ion, and (ii) maintain or improve their GPA. To this end, we propose two different approaches for recommendation. The first approach ranks the courses by using an objective function that differ-entiates between courses that are expected to increase or decrease a student’s GPA. The second approach uses the grades that students are expected to obtain in future courses to improve the ranking of the courses produced by course recommendation methods.
To obtain course rankings in both approaches, we adapt two widely-known representation learning techniques, which have proven successful in many fields, to solve the grade-aware course recommendation problem. The first is based on singular value decomposition, which is a linear model that learns a low-rank approximation of a given matrix. The second, which we refer to as Course2vec, is based on word2vec (Mikolov et al., 2013) that uses a log-linear model to formulate the problem as a maximum likelihood estimation problem. In both approaches, the courses taken by each student are treated as temporally-ordered sets of courses, and each approach is trained to learn these orderings.
1.1. CONTRIBUTIONS
The main contributions of this work are the following:
1. We propose aGrade-aware Course Recommendationframework in higher education that recommends courses to students that the students are most likely to register for in their following terms and that will help maintain or improve their overall GPA. The proposed framework combines the benefits of both course recommendation and grade prediction approaches to better help students graduate in a timely and successful manner.
3. We adapt two-widely used representation learning techniques to solve the grade-aware course recommendation problem, by modeling historical course ordering data and differ-entiating between courses that increase or decrease the student’s GPA.
4. We perform an extensive set of experiments on a dataset spanning 16 years obtained from the University of Minnesota, which includes students who belong to 23 different ma-jors. The results show that: (i) the proposed grade-aware course recommendation ap-proaches outperform grade-unaware course recommendation methods in recommending more courses that increase the students’ GPA and fewer courses that decrease it; and (ii) the proposed representation learning approaches outperform competing approaches for grade-aware course recommendation in terms of recommending courses which students are expected to perform well in, as well as differentiating between courses which students are expected to perform well in and those which they are expected not to perform well in.
5. We provide an in-depth analysis of the recommendation accuracy across different majors and different student groups. We show the effectiveness of our proposed approaches on different majors and student groups over the best competing method. In addition, we ana-lyze two important characteristics for the recommendations: the course difficulty as well as the course popularity. We show that our proposed approaches are not prone to recom-mending easy courses. Furthermore, they are able to recommend courses with different popularity in a similar manner.
2. R
ELATEDW
ORK2.1. COURSERECOMMENDATION
Different machine learning methods have been recently developed for course recommendation. For example, Bendakir and A¨ımeur (2006) used association rule mining to discover signifi-cant rules that associate academic courses from previous students’ data. Lee and Cho (2011) ranked the courses for each student based on the course’s importance within his/her major, its prerequisites, and the extent by which the course adds to the student’s knowledge state.
Another set of recommendation methods proposed in (Parameswaran and Garcia-Molina, 2009; Parameswaran et al., 2010; Parameswaran et al., 2010; Parameswaran et al., 2011) fo-cused on satisfying the degree plan’s requirements that include various complex constraints. The problem was shown to be NP-hard and different heuristic approaches were proposed in order to solve the problem.
Elbadrawy and Karypis (2016) proposed using both student- and course-based academic features, in order to improve the performance of three popular recommendation methods in the education domain, namely popularity-based ranking, user-based collaborative filtering and matrix factorization. These features are used to define finer groups of students and courses and were shown to improve the recommendation performance of the three aforementioned methods than using coarser groups of students.
the students to choose a subset from, and a pre-requisite structure exists among most of these courses.
Pardos et al. (2019) proposed a similar course2vec model that was done in parallel to our proposed work1. They used a skip-gram neural network architecture that takes as input one
course and outputs multiple probability distributions over the courses. The approaches that are presented here differ from that work because their model is unaware, while ours is grade-aware, which is a principal contribution of our work.
Another model (Backenk¨ohler et al., 2018) that is also parallel and most relevant to our work also proposed to combine grade prediction with course recommendation. Our work is different in two aspects. First, Backenk¨ohler et al. (2018) use a course dependency graph constructed using the Mann-Whitney U-test as the course recommendation method. This graph consists of nodes that represent courses and directed edges between them. A directed edge going from course A to course B means that the chance of getting a better grade in B is higher when A is taken before B than when A is not taken before B. One limitation of this approach is that, for pairs (A, B) of courses that do not have sufficient data about A not being taken before B, no directed edge will exist from A to B, despite the fact that there may be sufficient data about A followed by B, which may imply that A is a pre-requisite for B. Our proposed representation learning approaches for course recommendation, described in Section3.1., on the other hand, are able to learn all possible orderings for pairs of courses that have sufficient data. In addition, the course embeddings are learned in a way such that courses taken after a common set of courses are located close in the latent space, which enables discovering new relationships between previous and subsequent courses that do not necessarily exist in the data.
Second, we propose a new additional approach for grade-aware course recommendation, which modifies the course recommendation objective function to differentiate between good and bad sequences of courses and does not require a grade prediction method.
2.2. COURSESEQUENCE DISCOVERY ANDRECOMMENDATION
Though our focus in this paper is to recommend courses for students in their following term, and not to recommend the whole sequence of courses for all terms, our proposed models try to learn the sequencing of courses such that they predict the next good courses based on the previously-taken set of courses.
Cucuringu et al. (2017) utilized several ranking algorithms, e.g., PageRank, to extract a global ranking of the courses, where the rank here denotes the order in which the courses are taken by students. The discovered course sequences were used to infer the hidden dependen-cies, i.e., informal prerequisites, between the courses, and to understand how/if course sequences learned from high- and low-performing students are different from each other. This technique learns only one global ranking of courses from all students, which cannot be used for personal-ized recommendation.
Xu et al. (2016) proposed a course sequence recommendation framework that aimed to mini-mize the time-to-graduate, which is based on satisfying pre-requisite requirements, course avail-ability during the term, the maximum number of courses that can be taken during each term, and degree requirements. They also proposed to do joint optimization of both graduation time and GPA by clustering students based on some contextual information, e.g., their high school rank and SAT scores, and keeping track of each student’s sequence of taken courses as well as his/her
GPA. Then, for a new student, he/she is assigned to a specific cluster based on their contextual information and the sequence of courses from that cluster that has the highest GPA estimate is recommended to him/her. This framework can work well on the more restricted degree pro-grams that have little variability between the degree plans taken by students, given that there is enough support for the different degree plans from past students. However, the more flexible degree programs have much variability in the degree plans taken by their students, as shown inMorsy and Karypis (2019). This makes an exact extraction system like the one above inappli-cable for their students, unless there exists a huge dataset that covers the many different possible sequences with high support.
2.3. REPRESENTATION LEARNING
Representation learning has been an invaluable approach in machine learning and artificial in-telligence for learning from different types of data such as text and graphs. Objects can be represented in a vector space via local or distributed representations. Under local (or one-hot) representations, each object is represented by a binary vector of size equal to the total number of objects, where only one of the values in the vector is one and all the others are set to zero. Under distributed representations, each object is represented by a vector, which can come from hand-engineered features that are usually sparse and high-dimensional, or a learned representa-tion, called “embeddings” in a latent space that preserves the relationships between the objects, which is usually low-dimensional and more practical than the former.
A widely used approach for learning object embeddings is Singular Value Decomposition (SVD) (Golub and Reinsch, 1970). SVD is a traditional low-rank approximation method that has been used in many fields. In recommendation systems, a user-item rating matrix is typically decomposed into the user and item latent factors that recover the observed ratings in the matrix, e.g., (Sarwar et al., 2000;Bell et al., 2007;Paterek, 2007;Koren, 2008).
Recently, neural networks have gained a lot of interest for learning object embeddings in different fields for their ability to handle more complex relationships than SVD. Some of the early well-known architectures include word2vec (Mikolov et al., 2013) and Glove ( Penning-ton et al., 2014), which were proposed for learning distributed representations for words. For instance, neural language models for words, phrases and documents in Natural Language Pro-cessing (Huang et al., 2012; Mikolov et al., 2013; Le and Mikolov, 2014; Pennington et al., 2014;Mikolov et al., 2013) are now widely used for different tasks, such as machine translation and sentiment analysis. Similarly, learning embeddings for graphs, such as DeepWalk (Perozzi et al., 2014), LINE (Tang et al., 2015) and node2vec (Grover and Leskovec, 2016) were shown to have performed well on different applications, such as multi-label classification and link pre-diction. Moreover, learning embeddings for products in e-commerce and music playlists in cloud-based music services has been recently proposed for next basket recommendation (Chen et al., 2012;Grbovic et al., 2015;Wang et al., 2015).
3. G
RADE-
AWAREC
OURSER
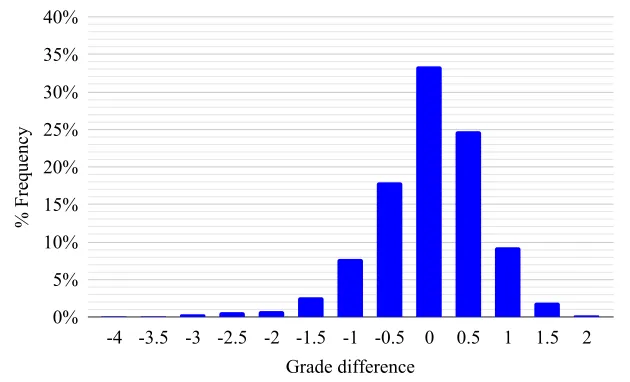
ECOMMENDATIONGrade difference
% Frequency
0% 5% 10% 15% 20% 25% 30% 35% 40%
-4 -3.5 -3 -2.5 -2 -1.5 -1 -0.5 0 0.5 1 1.5 2
Figure 1: Grade difference from the student’s average previous grade.
grades are a full letter grade lower than the corresponding students’ previous average grades2.
The poor performance in some of these courses can result in students having to retake the same courses at a later time or to increase the number of courses that they will have to take in order to graduate with a desired GPA. As a result, this will increase the financial cost associated with obtaining a degree and can incur an opportunity cost by delaying the students’ graduation.
For the cases in which a student’s performance in a course is a result of him/her not be-ing well-prepared for it (i.e., is takbe-ing the course at the wrong time in his/her studies), course recommendation methods can be used to recommend a set of courses for that student that will help (i) him/her in completing his/her degree in a timely fashion and (ii) maintain or improve his/her GPA. We will refer to the methods that do those simultaneously asgrade-aware course recommendationapproaches. Note that the majority of the existing approaches cannot be used to solve this problem as they ignore the performance the student is expected to get in the courses that they recommend.
In this work, we propose two different approaches for grade-aware course recommendation. The first approach (Section 3.1.) uses two representation learning approaches that explicitly differentiate between courses in which the student is expected to perform well and courses in which the student is expected not to perform well. The second approach (Section3.2.) combines grade prediction methods with course recommendation methods to improve the final course rankings. The goal of both approaches is to rank the courses in which the student is expected to perform well higher than those in which he/she is expected not to perform well.
3.1. GRADE-AWARE REPRESENTATION LEARNING APPROACHES
Our first approach for solving the grade-aware course recommendation problem relies on mod-ifying the way we use the previous students’ data to differentiate between courses in which the student is expected to perform well and courses in which the student is expected not to perform
well. As such, for every student, we define a course taken by him/her to bea good (subsequent) courseif the student’s grade in it is equal to or higher than his/her average previous grade, oth-erwise, we define that course to bea bad (subsequent) course. The goal of our method is to recommend to each student a set of good courses.
Motivated by the success of representation learning approaches in recommendation sys-tems (Koren, 2008; Chen et al., 2012; Grbovic et al., 2015; Wang et al., 2015), we adapt two widely-used approaches to solve the grade-aware course recommendation problem. The first approach applies the SVD linear factorization model on a co-occurrence frequency matrix that differentiates between good and bad courses (Section 3.1.1.), while the second one optimizes an objective function of a neural network log-linear model that differentiates between good and bad courses (Section3.1.2.).
In both approaches, the courses taken by each student are treated as temporally-ordered sets of courses, and each approach is trained on these data in order to learn the proper ordering of courses as taken by students. The course representations learned by these models are then used to create personalized rankings of courses for students that are designed to include courses that are relevant to the students’ degree programs and will help them maintain or increase their GPAs.
3.1.1. Singular Value Decomposition
SVD (Golub and Reinsch, 1970) is a traditional low-rank linear model that has been used in many fields. It factorizes a given matrix X by finding a solution to X = UΣVT, where the
columns of Uand V are the left and right singular vectors, respectively, and Σ is a diagonal
matrix containing the singular values of X. The d largest singular values, and corresponding singular vectors from U and V, is the rank d approximation of X (Xd = UdΣdVTd). This
technique is called truncated SVD.
Since we are interested in learning course ordering as taken by past students, we apply SVD on a previous-subsequent co-occurrence frequency matrixF, whereFij is the number of students
in the training data that have previously taken courseibefore they took coursej.
We form two different previous-subsequent co-occurrence frequency matrices, as follows. Letn+
ij andn−ij be the number of students who have taken courseibefore coursej, where course
jis considered a good course for the first group and a bad course for the second one, respectively. The two matrices are:
1. F+: whereF+
ij =n+ij.
2. F+−: whereF+−
ij =n+ij −n−ij.
We scaled the rows of each matrix toL1norm and then applied truncated SVD on them. The
course embeddings are then given by Ud√Σd and Vd√Σd for the previous and subsequent
courses, respectively.
Recommendation. Given the previous and subsequent course embeddings estimated by SVD, course recommendation is performed as follows. Given a studentswith his/her previously-taken set of courses, c1, . . . , ck, who would like to register for his/her following term, we compute
his/her implicit profile by averaging over the embeddings of the courses taken by him/her in all previous terms3. We then compute the dot product between s’s profile and the embeddings of
each candidate coursect ∈ C. Then, we rank the courses in non-increasing order according to
these dot products, and select the top courses as the final recommendations fors.
3.1.2. Course2vec
The above SVD model works on pairwise, one-to-one relationships between previous and sub-sequent courses. We also model course ordering using a many-to-one, log-linear model, which is motivated by the recent word2vec Continuous Bag-Of-Word (CBOW) model (Mikolov et al., 2013). Word2vec works on sequences of individual words in a given text, where a set of nearby (context) words (i.e., words within a pre-defined window size) are used to predict the target word. In our case, the sequences would be the ordered terms taken by each student, where each term contains a set of courses, and the previous set of courses would be used to predict future courses for each student.
MODEL ARCHITECTURE. We formulate the problem as a maximum likelihood estimation
problem. Let Ti = {c1, . . . , cn}be a set of courses taken in some term i. A sequence Qs =
hT1, . . . ,Tmi is an ordered list ofm terms as taken by some student s, where each term can
contain one or more courses. Let W ∈ R|C|×d be the courses’ representations when they are
treated aspreviouscourses, and letW0 ∈Rd×|C|be their representations when they are treated
as “subsequent” courses, where|C|is the number of courses anddis the number of dimensions in the embedding space. We define the probability of observing a future coursectgiven a set of
previously-taken coursesc1, . . . , ckusing the softmax function, i.e.,
P r(ct|c1, . . . , ck) =yt=
exp(w0T cth)
PC
j=1exp(w0
T cjh)
, (1)
wherehdenotes the aggregated vector of the representations of the previous courses, where we
use the average pooling for aggregation, i.e.,
h = 1
kW
T(x
1+x2+· · ·+xk),
where xi is a one-hot encoded vector of size |C| that has 1 in the ci’s position and 0
other-wise. The Architecture for Course2vec is shown in Figure2. Note that one may consider more complex neural network architectures, which is left for future work.
We propose the two following models:
1. Course2vec(+). This model maximizes the log-likelihood of observing only the good subsequent courses that are taken by studentsin some term given his/her previously-taken
x1
x2
xk
hi y
t
Input layer
Hidden layer
Output layer
k×C−dim
d−dim
C−dim W|C|×d
W|C|×d
W|C|×d
W'd×|C|
Figure 2: Neural network architecture for Course2vec.
set of courses. The objective function of Course2vec(+) is thus:
maximize
W,W0
X
s∈S X
Ti∈Qs
logP r(Gs,i|Ps,i)
, (2)
where:S is the set of students,Gs,iis the set of good courses taken by studentsat termi,
andPs,iis the set of courses taken by students prior to termi. Note thatistarts from2,
since the previous set of coursesPs,iwould be empty fori= 1.
2. Course2vec(+-). This model maximizes the log-likelihood of observing good courses and minimizes the log-likelihood of observing bad courses given the set of previously-taken courses. The objective function of Course2vec(+-) is thus:
maximize
W,W0
P s∈S
P
Ti∈Qs
logP r(Gs,i|Ps,i)
−logP r(Bs,i|Ps,i)
,
(3)
where:Bs,iis the set of bad courses taken by studentsat termi, and the rest of the terms
are as defined in Eq.2.
Note that Course2vec(+) is analogous to SVD(+) and Course2vec(+-) is analogous to SVD-(+-) in terms of how they utilize the good and bad courses in the training set.
MODELOPTIMIZATION. The objective functions in Eqs.2and3can be solved using
which requires knowing whether a course is to be considered a good or a bad subsequent course for a given context. However, not all the relationships between every context (previous set of courses) and every subsequent course are known from the data. Hence, for each context, we only update the subsequent course vector when the course is known to be a good or bad subsequent course associated with that context. In the case that some context does not have a sufficient pre-defined number of subsequent courses with known relationships, then we randomly sample a few other courses and treat them as bad courses, similar to the negative sampling approach used in word2vec (Le and Mikolov, 2014).
Note that in Course2vec(+-), since a course can be seen as both a good and a bad subsequent course for the same context in the data (for different students), then, in this case, we randomly choose whether to treat that course as good or bad each time according to a uniform distribution that is based on its good and bad frequency in the dataset. In addition, for both Course2vec(+) and Course2vec(+-), if the frequency between a context and a subsequent course is less than a pre-defined threshold, e.g., 20, then we randomly choose whether to update that subsequent course’s vector in the denominator each time it is visited. The code for Course2vec can be found at https://zenodo.org/record/3464635#.XZFTEJNKjNY, which is built on the original word2vec code that was implemented for the CBOW model4.
Recommendation Given the previous and subsequent course embeddings estimated by Course2vec, course recommendation is performed as follows. Given a studentswith his/her previously-taken set of courses,c1, . . . , ck, who would like to register for his/her following term, we compute the
probabilityP r(ct|c1, . . . , ck)for each candidate coursect∈Caccording to Eq.1. We then rank
the courses in non-increasing order according to their probabilities and select the top courses as the final recommendations for s. Note that since the denominator in Eq. 1 is the same for all candidate courses, the ranking score for coursectcan be simplified to the dot product between
w0
ct andh, wherehrepresents the student’s implicit profile.
3.2. COMBININGCOURSE RECOMMENDATION WITH GRADEPREDICTION
The second approach that we developed for solving the grade-aware course recommendation problem relies on using the grades that students are expected to obtain in future courses to im-prove the ranking of the courses produced by course recommendation methods. Our underlying hypothesis behind this approach is that a course that both is ranked high by a course recommen-dation method and has a high predicted grade should be ranked higher than one that either has a lower ranking by the recommendation method or is predicted to have a lower grade in it. This in turn will help improve the final course rankings for students by taking both scores into account simultaneously.
Letˆgs,cbe the predicted grade for coursecas generated from some grade prediction model, and letˆrs,cbe the ranking score forcas generated from some course recommendation method.
We combine both scores to compute the final ranking score forcas follows:
rank-scores,c = ˆgαs,c×(|rˆs,c|)(1−α)×sign(ˆrs,c), (4)
whereαis a hyper-parameter in the range(0,1)that controls the relative contribution ofˆgs,cand
ˆ
rs,cto the overall ranking score, and sign(rˆs,c) denotes the sign ofrˆs,c, i.e.,1ifrˆs,cis positive and
−1otherwise. Note that bothgˆs,candrˆs,care standardized to have zero mean and unit variance.
In this work, we will use the representation learning approaches described in Section3.1.as the course recommendation method. We will also use the grade-unaware variations of each of them (see Section4.2.) to compare combining the grade prediction methods with both recom-mendation approaches.
To obtain the grade prediction score, we will use Cumulative Knowledge-based Regression Models (CKRM) (Morsy and Karypis, 2017). CKRM is a set of grade prediction methods that learn low-dimensional as well as textual-based representations for courses that denote the required and provided knowledge components for each course. It represents a student’s knowl-edge state as the sum of the provided knowlknowl-edge component vectors of the courses taken by them, weighted by their grades in them. CKRM then predicts the student’s grade in a future course as the dot product between their knowledge state vector and the course’s required knowl-edge component vector. We will denote the recommendation method that combines CKRM with SVD and Course2vec asCKRM+SVDandCKRM+Course2vec, respectively.
4. E
XPERIMENTALE
VALUATION4.1. DATASET DESCRIPTION AND PREPROCESSING
The data used in our experiments was obtained from the University of Minnesota and spans a period of 16 years (Fall 2002 to Summer 2017). From that dataset, we extracted the degree programs that have at least 500 graduated students through Fall 2012, which accounted for 23 different majors from different colleges. For each of these degree programs, we extracted all the students who graduated from this program and extracted the 50 most frequent courses taken by the students as well as the courses that belonged to frequent subjects, e.g., CSCI is a subject that belongs to the Computer Science department at the University. A subject is considered to be frequent if the average number of courses that belong to that subject over all students is at least three. This filtering was made to remove the courses we believe are not relevant to the degree program of students. We also removed any courses that were taken as pass/fail.
Using the above dataset, we split it into train, validation and test sets as follows. All courses taken before Spring 2013 were used for training, courses taken between Spring 2013 and Sum-mer 2014 inclusive were used for validation, and courses taken afterwards (Fall 2014 to SumSum-mer 2017 inclusive) were used for test purposes.
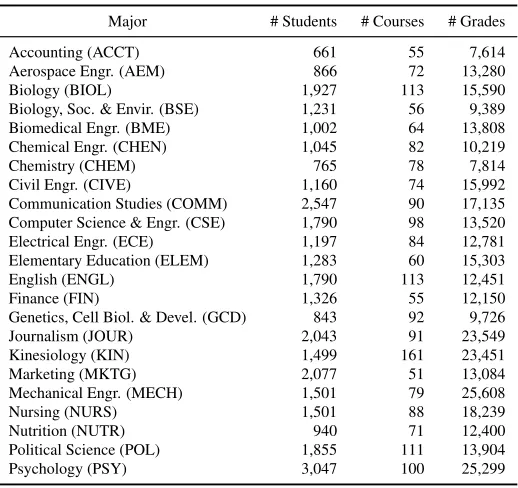
At the University of Minnesota, the letter grading system has 11 letter grades (A, A-, B+, B, B-, C+, C, C-, D+, D, F) that correspond to numerical grades (4, 3.667, 3.333, 3, 2.667, 2.333, 2, 1.667, 1.333, 1, 0). For each (context, subsequent) pair in the training, validation, and test set, where the context represents the previously-taken set of courses by a student, the context contained only the courses taken by the student with grades higher than the D+ letter grade, which the student does not have to repeat. The statistics of the 23 degree programs are shown in Table1.
4.2. BASELINE ANDCOMPETING METHODS
We compare the performance of the proposed representation learning approaches against com-peting approaches for grade-aware course recommendation, which are defined as follows:
Table 1: Dataset statistics.
Major # Students # Courses # Grades
Accounting (ACCT) 661 55 7,614
Aerospace Engr. (AEM) 866 72 13,280
Biology (BIOL) 1,927 113 15,590
Biology, Soc. & Envir. (BSE) 1,231 56 9,389 Biomedical Engr. (BME) 1,002 64 13,808 Chemical Engr. (CHEN) 1,045 82 10,219
Chemistry (CHEM) 765 78 7,814
Civil Engr. (CIVE) 1,160 74 15,992
Communication Studies (COMM) 2,547 90 17,135 Computer Science & Engr. (CSE) 1,790 98 13,520 Electrical Engr. (ECE) 1,197 84 12,781 Elementary Education (ELEM) 1,283 60 15,303
English (ENGL) 1,790 113 12,451
Finance (FIN) 1,326 55 12,150
Genetics, Cell Biol. & Devel. (GCD) 843 92 9,726
Journalism (JOUR) 2,043 91 23,549
Kinesiology (KIN) 1,499 161 23,451
Marketing (MKTG) 2,077 51 13,084
Mechanical Engr. (MECH) 1,501 79 25,608
Nursing (NURS) 1,501 88 18,239
Nutrition (NUTR) 940 71 12,400
Political Science (POL) 1,855 111 13,904
Psychology (PSY) 3,047 100 25,299
For each coursec, letn+
c andn−c be the number of students that have the same major and
academic level as the target students, wherecwas considered a good subsequent course for the first group and a bad one for the second group. We can differentiate between good and bad subsequent courses using the following ranking score (which is similar to the (+-)-based approaches):
rank-scores,c =n+c −n−c. (5)
• Grp-pop(+): Here, the group popularity ranking method considers only the good
subse-quent courses, similar to SVD(+) and Course2vec(+). Specifically, the ranking score is computed as
rank-scorec =n+c,
wheren+
c is as defined in Eq.5.
• Course dependency graph: This is the course recommendation method utilized in ( Back-enk¨ohler et al., 2018) (see Section2.1.).
We also compare the performance of the representation learning approaches for both grade-aware and grade-ungrade-aware course recommendation. The grade-ungrade-aware representation learning approaches are defined as follows:
• SVD(++): Here, SVD is applied on the previous-subsequent co-occurrence frequency matrix:F++: whereF++
ij =n+ij +n−ij.
• Course2vec(++). This model maximizes the log-likelihood of observing all courses taken by student s in some term given the set of previously-taken courses, regardless of the subsequent course being a good or a bad one. This can be written as:
maximize
W,W0
X
s∈S X
Ti∈Qs
logP r(Cs,i|Ps,i)
where: Cs,i is the set of courses taken by studentsat termi, and the rest of the terms are
as defined in Eq.2.
Note that, here we append a (++) suffix to the grade-unaware variation of the method’s name since it utilizes all the course information without differentiating between good and bad courses.
4.3. EVALUATIONMETHODOLOGY AND METRICS
Previous course recommendation methods used the recall metric to evaluate the performance of their methods. The goal of the proposed grade-aware course recommendation methods is to recommend to the student courses which he/she is expected to perform well in and not rec-ommend courses which he/she is expected not to perform well in. As a result, we cannot use the recall metric as is, and instead, we use three variations of it that differentiate between good and bad courses. The first, Recall(good), measures the fraction of the actual good courses that are retrieved. The second, Recall(bad), measures the fraction of the actual bad courses that are retrieved. The third,Recall(diff), measures the overall performance of the recommendation method in ranking the good courses higher than the bad ones.
The first two metrics are computed as the average of the student-term-specific corresponding recalls. In particular, for a studentsand a target termt, the first two recall metrics for that (s,t) tuple are computed as:
1. Recall(good)(s,t) =
Gs,n(s,t)
ng(s,t) .
2. Recall(bad)(s,t) =
Bs,n(s,t)
nb
(s,t) .
Gs,n(s,t) andBs,n(s,t) denote the set of good and bad courses, respectively, that were taken by s intand exist in his/her list ofn(s,t)recommended courses,n(s,t)is the actual number of courses
taken bys in t, and ng(s,t) and nb
(s,t) are the actual number of good and bad courses taken by s
int, respectively. Since our goal is to recommend good courses only, we consider a method to perform well when it achieves a high Recall(good) and a low Recall(bad).
Recall(diff) is computed as the difference between Recall(good) and Recall(bad), i.e., 3. Recall(diff) = Recall(good) - Recall(bad).
Recall(diff) is thus a signed measure that assesses both the degree and direction to which a recommendation method is able to rank the actual good courses higher than the bad ones in its recommended list of courses for each student, so the higher the Recall(diff) value, the better the recommendation method is.
To further analyze the differences in the ranking results of the proposed approaches, we also computed the following two metrics:
• Percentage GPA increase/decrease: Let cur-goods and cur-bads be the current GPA
achieved by studentson the good and bad courses recommended by some recommenda-tion method, respectively, and let prev-gpas be his/her GPA prior to that term. Then, the
percentage GPA increase and decrease are computed as:
% GPA increase= cur-goods−prev-gpas
prev-gpas
% GPA decrease= prev-gpas−cur-bads
prev-gpas
×100.0.
• Coverage for good/bad terms:The number of terms where some recommendation method
recommends at least one good (or bad) subsequent course will be referred to as its cover-age for good (or bad) terms. The higher the covercover-age for good terms by some method, the more students will get good recommendations that will maintain or improve their overall GPA. On the other hand, the lower the coverage for bad terms, the less students will get bad recommendations that will decrease their overall GPA.
We compute the above two metrics for the terms on which the recommendation method recom-mends at least one of the actual courses taken in that term. For each method, the percentage GPA increase and decrease as well as the coverage for good and bad terms are computed as the average of the individual scores. Since we would like to recommend courses that optimize the student’s GPA, the higher the GPA percentage increase and the coverage for good terms and the lower the GPA percentage decrease and the coverage for bad terms that a method achieves, the better the method is.
Note that a recommendation is only done for students who have taken at least three previous courses. For each (s, t) tuple, the recommended list of courses using any method are selected from the list of courses that are being offered at termtonly, and that were not already taken by swith an associated grade that is either: (i)≥ C+, or, (ii)≥ µs−1.0, where µs is the average
previous grade achieved bys. Therefore, we only allow recommending repeated courses in the case that the student has achieved a low grade in it such that the course’s credits do not add to the earned credits, or when they a achieve bad grade in them relative to their grades in previous terms. This filtering technique significantly improved the performance of all the baseline and proposed methods.
4.4. MODELSELECTION
We did an extensive search in the parameter space for model selection. The parameters in the SVD-based models is the number of latent dimensions (d). The parameters in the Course2vec-based models are the number of latent dimensions (d), and the minimum number of subsequent courses (samples), in the denominator of Eq.1that are used during the SGD process of learning the model. We experimented with the parameterdin the range[10−30] with a step of5, with
the minimum number ofsampleswith the values{3,5}, and with the parameterαin Eq.4in the range[0.1−0.9]with a step of 0.2.
For each major, the training set was used for learning the distributed representations of the courses, whereas the validation set was used to select the best performing parameters in terms of the highest Recall(diff).
5. R
ESULTSWe evaluate the effectiveness of the proposed grade-aware course recommendation methods in order to answer the following questions:
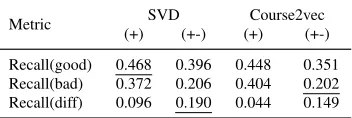
Table 2: Prediction performance of the proposed representation learning-based approaches for grade-aware course recommendation.
Metric SVD Course2vec
(+) (+-) (+) (+-) Recall(good) 0.468 0.396 0.448 0.351 Recall(bad) 0.372 0.206 0.404 0.202 Recall(diff) 0.096 0.190 0.044 0.149
Note: Underlined entries indicate best performance.
RQ2. How do the combination of grade prediction with representation learning approaches com-pare to each other?
RQ3. How do the two proposed approaches for solving grade-aware course recommendation compare to each other?
RQ4. How do the proposed approaches compare to competing approaches for grade-aware course recommendation?
RQ5. What are the benefits of grade-aware course recommendation over grade-unaware course recommendation?
RQ6. How does the recommendation accuracy vary across different majors and student sub-groups?
RQ7. What are the characteristics of the recommended courses, in terms of course difficulty and popularity?
5.1. COMPARISON OF THE REPRESENTATION LEARNING APPROACHES FOR GRADE
-AWARECOURSE RECOMMENDATION
Table 2 shows the prediction performance of the two proposed representation learning ap-proaches for grade-aware course recommendation. The results show that SVD(+) achieves the best Recall(good), while SVD(+-) achieves the best Recall(diff). Course2vec(+-) achieves the best Recall(bad), which is comparable to SVD(+-).
By comparing the corresponding SVD and Course2vec approaches, we see that SVD outper-forms Course2vec in almost all cases. We believe this is caused by the fact that there is a limited number of positive training data for Course2vec since only the good courses are used as positive examples for learning the models. This is supported by the comparable prediction performance of the (++)-based approaches that use all the available training data as positive examples, which are shown in Table5.
By comparing the (+)- and (+-)-based methods, we see that the (+-)-based model achieves a worse Recall(good), but a much better Recall(bad). For instance, SVD(+-) achieves a 15%
decrease in Recall(good) and a45%decrease in Recall(bad) over SVD(+). This is expected since
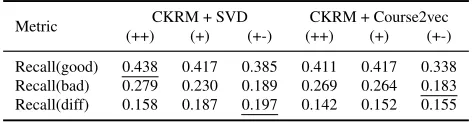
Table 3: Prediction performance of combining CKRM with the representation learning-based approaches for grade-aware course recommendation methods.
Metric CKRM + SVD CKRM + Course2vec (++) (+) (+-) (++) (+) (+-) Recall(good) 0.438 0.417 0.385 0.411 0.417 0.338 Recall(bad) 0.279 0.230 0.189 0.269 0.264 0.183 Recall(diff) 0.158 0.187 0.197 0.142 0.152 0.155
Note: Underlined entries indicate best performance.
5.2. COMPARISON OF THE GRADE-AWARE RECOMMENDATION APPROACHES COM
-BINING GRADE PREDICTION WITH COURSERECOMMENDATION
Table3shows the prediction performance of the grade-aware recommendation approaches that combine CKRM with the grade-aware and grade-unaware representation learning methods. The results show that CKRM+SVD(++) achieves the best Recall(good), while CKRM+Course2vec-(+-) achieves the best Recall(bad). Overall, CKRM+SVDCKRM+Course2vec-(+-) achieves the best Recall(diff). Combining CKRM with the grade-unaware, i.e., (++)-based, approaches helped in differen-tiating between good and bad courses, by achieving a high Recall(diff) of 0.158 and 0.142 for SVD and Course2vec, respectively. However, despite these performance improvements, the combinations that use the grade-aware recommendation methods do better. For instance, CKRM+SVD(+) outperforms CKRM+SVD(++) by15%in terms of Recall(diff).
The results also show that the SVD-based (+)- and (+-)-based approaches outperform their Course2vec counterparts in terms of Recall(diff), similar to the results of SVD and Course2vec alone (Section5.1.). Unlike the difference in the performance of SVD(+) vs SVD(+-), CKRM-+SVD(+) achieves a similar Recall(diff) to that achieved by CKRM+SVD(+-) (and the same holds for the Course2vec-based approaches). The difference is that CKRM+SVD(+) achieves higher Recall(good) and Recall(bad) than CKRM+SVD(+-).
5.3. COMPARISON OF THE PROPOSED APPROACHES FOR GRADE-AWARE COURSE
RECOMMENDATION
Comparing each of the SVD- and Course2vec-based approaches with and without CKRM (sh-own in Tables2and3), we see that combining CKRM with the (+)-based approaches improved their performance with95%and245%increase in Recall(diff) for SVD and Course2vec,
respec-tively. On the other hand, combining CKRM with the (+-)-based approaches achieves compara-ble performance to using the corresponding (+-)-based approach alone.
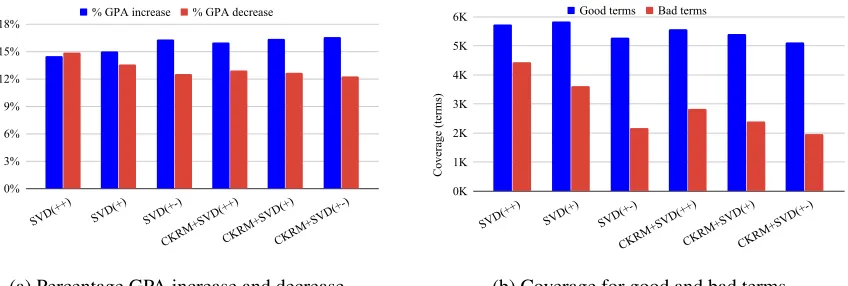
By further analyzing these ranking results, Figure3shows the percentage GPA increase and decrease as well as the coverage for good and bad terms for each SVD-based method with and without CKRM5. CKRM+SVD(+) outperforms SVD(+) in all but one metric, which is coverage
for good terms, where it achieves slightly worse performance than SVD(+). On the other hand, CKRM+SVD(+-) has comparable performance to SVD(+-), which is analogous to their recall metrics results.
0% 3% 6% 9% 12% 15% 18%
SVD(++) SVD(+) SVD(+-)
CKRM+SVD(++)CKRM+SVD(+)CKRM+SVD(+-) % GPA increase % GPA decrease
(a) Percentage GPA increase and decrease
Coverage (terms)
0K 1K 2K 3K 4K 5K 6K
SVD(++) SVD(+) SVD(+-)
CKRM+SVD(++)CKRM+SVD(+)CKRM+SVD(+-) Good terms Bad terms
(b) Coverage for good and bad terms
Figure 3: Performance of the different SVD-based methods with and without CKRM (refer to Section4.3.for the metrics definitions).
5.4. REPRESENTATIONLEARNING VSCOMPETINGAPPROACHES FOR GRADE-AWARE
COURSERECOMMENDATION
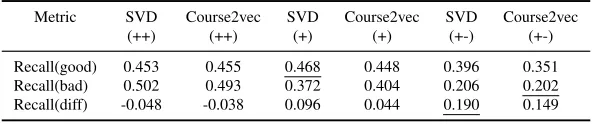
Table 4 shows the prediction performance of the representation learning and competing ap-proaches for grade-aware course recommendation. Grp-pop(+-) achieves the best Recall(diff) among the three competing (baseline) approaches. The results also show that SVD(+) achieves the best Recall(good), while grp-pop(+-) achieves the best Recall(bad). Overall, SVD(+-) achie-ves the best Recall(diff).
5.5. GRADE-AWARE VSGRADE-UNAWAREREPRESENTATIONLEARNINGAPPROACHES
Table5 shows the performance prediction of the representation learning approaches for grade-aware, i.e., (+)- and (+-)-based approaches, and grade-ungrade-aware, i.e., (++)-based approach, cour-se recommendation. Each of SVD(+) and Courcour-se2vec(+) achieves a Recall(good) that is com-parable to or better than that achieved by its corresponding (++)-based approach. In addition, both the (+)- and (+-)-based methods achieve much better (lower) Recall(bad). For instance, SVD(+) and SVD(+-) achieve0.372and 0.206 Recall(bad), respectively, resulting in 26%and 59%improvement over SVD(++), respectively.
By comparing the (++)-, (+)-, and (+-)-based approaches in terms of Recall(diff), we can see that the (++)-based approaches achieve negative recall values which indicate that they recom-mend more bad courses than they recomrecom-mend good ones. The (+)-based approaches do slightly
Table 4: Prediction performance of the representation learning-based vs competing approaches for grade-aware course recommendation.
Metric Dependency Grp-pop Grp-pop SVD SVD Course2vec Course2vec
Graph (+) (+-) (+) (+-) (+) (+-)
Recall(good) 0.382 0.425 0.367 0.468 0.396 0.448 0.351 Recall(bad) 0.260 0.343 0.188 0.372 0.206 0.404 0.202 Recall(diff) 0.122 0.082 0.179 0.096 0.190 0.044 0.149
Table 5: Prediction performance of the representation learning based approaches for grade-aware and grade-unaware course recommendation.
Metric SVD Course2vec SVD Course2vec SVD Course2vec
(++) (++) (+) (+) (+-) (+-)
Recall(good) 0.453 0.455 0.468 0.448 0.396 0.351 Recall(bad) 0.502 0.493 0.372 0.404 0.206 0.202 Recall(diff) -0.048 -0.038 0.096 0.044 0.190 0.149
Note: Underlined entries indicate best performance.
better, while the (+-)-based approaches achieve the highest Recall(diff). This is expected since the (++)-based methods treat both types of subsequent courses equally during their learning, and so they recommend both types in an equal manner. This shows that differentiating between good and bad courses in any course recommendation method is very helpful for ranking the good courses higher than the bad ones, which will help the student maintain or improve their overall GPA.
In terms of percentage GPA increase and decrease (shown in Figure3), SVD(+-) outperforms SVD(++) by2%in percentage GPA increase and2.5%in percentage GPA decrease. Moreover,
SVD(+-) achieves ∼ 62% less coverage for the bad terms than SVD(++), while it achieves
∼10%less coverage for the good terms.
5.6. ANALYSIS OFRECOMMENDATION ACCURACY
Our discussion so far focused on analyzing the performance of the different methods by look-ing at metrics that are aggregated across the different majors. However, given that the structure of the degree programs of different majors is sometimes quite different, and that different stu-dent groups can exhibit different characteristics, an important question that arises is how the different methods perform across the individual degree programs and different student groups and if there are methods that consistently perform well across majors as well as across student groups. In this section, we analyze the recommendations done by one of our best performing models, CKRM+SVD(+-), against the best performing baseline, i.e., grp-pop(+-), in terms of Recall(diff), across these degree programs and student groups (RQ6).
5.6.1. Analysis of Different Majors
Recall(diff)
0 0.1 0.2 0.3 0.4 0.5
ACCT AEM BIOL BME BSE
CHEM CHEN CIVE COMM CSE ECE ELEM ENGL FIN GCD
JOUR KIN MECH MKTG NURS NUTR POL PSY Grp-pop(+-) CKRM+SVD(+-)
(a) Per-major recommendation accuracy of grp-pop(+-) and SVD(+-).
Average pairwise % common courses
0 25 50 75 100
ACCT AEM BIOL BSE BME CHEN CHEM CIVE COMM CSE ECE
ELEM ENGL
FIN
GCD JOUR KIN
MKTG MECH NURS NUTR POL PSY
(b) Pairwise % common courses per major.
Average pairwise degree similarity
0 0.25 0.5 0.75 1
ACCT AEM BIOL BSE BME CHEN CHEM CIVE COMM CSE ECE
ELEM ENGL
FIN
GCD JOUR KIN
MKTG MECH NURS NUTR POL PSY
(c) Pairwise degree similarity per major.
between a pair of degree plansd1andd2 as:
sim(d1, d2) =
P
(x,y)∈|C1∩C2|T(t1,x−t1,y, t2,x−t2,y)
|C1∩C2|
, (6)
whereCiis the set of courses taken in degreei, andti,xis the time, i.e., term number, that course
x was taken in di, e.g., the first term is numbered 1, the second is numbered 2 and so forth.
FunctionT(dt1, dt2)is defined as:
T(dt1, dt2) =
1, ifdt1 =dt2 = 0
exp−λ(|dt1−dt2|)
, ifdt1×dt2 ≥1
0, otherwise.
(7)
whereλis an exponential decay constant. FunctionT assigns a value of1for pairs of courses
taken concurrently, i.e., during the same term, in both plans, and assigns a value of0for pairs
of courses that are either: (i) taken in reversed order in both plans, or (ii) taken concurrently in one plan and sequentially in the other. For pairs of courses taken in the same order, it assigns a positive value that decays exponentially with|dt1−dt2|.
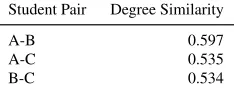
We found that there is a high correlation between the Recall(diff) values and both the aver-age pairwise percentaver-age of common courses and the averaver-age pairwise degree similarity among students of these majors (correlation values of 0.47 and 0.5 for grp-pop(+-), and 0.47 and 0.38 for CKRM+SVD(+-), respectively). This implies that as the percentage of common courses and degree similarity between pairs of students decrease, accurate course recommendation becomes more difficult since there is more variability in the set of courses taken as well as their se-quencing. The nursing major, where grp-pop(+-) outperforms CKRM+SVD(+-) has the highest average pairwise percentage of common courses,∼76%, as well as the highest average pairwise degree similarity, ∼0.86, compared to all other majors. This implies that the nursing major is
the most restricted major and that students tend to follow highly similar degree plans and take very similar courses at each academic level. The group popularity ranking in this case can easily outperform other recommendation methods.
5.6.2. Analysis of Different Student Groups
Figure 5 shows the recommendation accuracy in terms of Recall(diff), for grp-pop(+-) and CKRM+SVD(+-) across different student sub-groups. Figure5ashows the recommendation ac-curacy among different GPA-based student types, A vs B vs C. We notice that, first, CKRM+SVD(+-) outperforms grp-pop(+-CKRM+SVD(+-) for all student groups. Second, we found that CKRM+SVD(+-CKRM+SVD(+-) achieves the highest Recall(diff) for the B students, followed by A, and then by type-C. This could be due to the following reasons. After analyzing the training data, we found that the type-A and type-B students constitute∼96% of the student population. After analyzing the
GPA-based Student Type
Recall(diff)
0.000 0.100 0.200 0.300
A B C
Grp-pop(+-) CKRM+SVD(+-)
(a) Recommendation accuracy per student type.
Recall(diff)
-0.100 0.000 0.100 0.200 0.300
Freshman Sophomore Junior Senior Grp-pop(+-) CKRM+SVD(+-)
(b) Recommendation accuracy per cohort.
Figure 5: Recommendation accuracy on different student sub-groups.
enough training data for the type-C students to learn their sequencing of the courses, this can explain why the recommendation accuracy for them was the lowest.
Figure5bshows the recommendation accuracy among different student sub-groups based on their academic level. At the University of Minnesota, there are four academic levels, based on the number of both earned and transferred credits by the beginning of the semester: (1) fresh-man (≤30 credits), (2) sophomore (>30and≤60credits), (3) junior (>60and≤90credits),
and senior (> 90credits). First, we can notice that CKRM+SVD(+-) outperforms grp-pop(+-)
across all student groups. Second we see that, as the student’s academic level increases, and hence he/she has spent more years at the university and took more courses, both methods tend to achieve more accurate recommendations. This can be due to the following reasons. First, since we filter out the courses that have been previously taken by the student before making recom-mendations (see Section4.3.), this means that as the student’s academic level increases, there is a smaller number of candidate courses from which the recommendations are to be made. Second, for CKRM+SVD(+-), as the student takes more courses, his/her implicit profile that is computed by aggregating the embeddings of the previously-taken courses becomes more accurate.
6. C
HARACTERISTICS OFRECOMMENDED
COURSES
An important question to any recommendation method is what the characteristics of the recom-mendations are. In this section, we study two important characteristics for the recommended courses, (i) the difficulty of courses (Section6.1.), and (ii) their popularity (Section6.2.) (RQ7).
Table 6: Average pairwise degree similarity between different pairs of GPA-based student groups.
Student Pair Degree Similarity
A-B 0.597
A-C 0.535
Table 7: Statistics for the grades of all and recommended courses.
Course Set Mean Median Std. Dev.
All 3.50 3.61 0.51
SVD(++) 3.24 3.24 0.27 SVD(+) 3.40 3.40 0.24 SVD(+-) 3.56 3.55 0.20
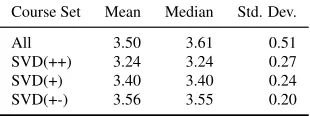
6.1. COURSEDIFFICULTY
As our proposed grade-aware recommendation methods are trained to recommend courses that help students maintain or improve their GPA, these methods can be prone to recommending easier courses in which students usually achieve high grades. Here, we investigate whether this happens in our recommendations or not. Table7shows the grade statistics of all courses, as well as the courses recommended by all variations of grade-unaware and grade-aware SVD variations. The mean grade is 3.5 for all courses, while for the recommended courses, it is 3.24, 3.4, and 3.56, for SVD(++), SVD(+) and SVD(+-), respectively. These statistics show that the grade-aware SVD approaches tend to only slightly favor easier courses in their recommendations than the grade-unaware SVD approach.
6.2. COURSEPOPULARITY
Since the university administrators need to make sure that students are enrolled in courses with different popularity, as there is a capacity for each course and classroom, course popularity is an important factor for course recommendations.
We also analyze the results of our models in terms of the popularity of the courses they recommend. Figure6shows the frequency of the actual good courses in the test set, as well as the frequency of the good courses recommended by both grp-pop(+-) and CKRM+SVD(+-)6.
The figure shows that both grp-pop(+-) and CKRM+SVD(+-) recommend courses with dif-ferent popularity7, similar to the actual good courses taken by students. Comparing
CKRM+-SVD(+-) to grp-pop(+-), we can notice that, grp-pop(+-) tends to recommend a higher number of the more popular courses, while CKRM+SVD(+-) recommends more of the less popular ones, which can be considered a major benefit for the latter method.
7. D
ISCUSSION ANDCONCLUSION
In this paper, we proposed grade-aware course recommendation approaches for solving the course recommendation problem. The proposed approach aims to recommend to students good courses on which the student’s expected grades will maintain or improve their overall GPA. We proposed two different approaches for solving the grade-aware course recommendation problem. The first approach ranks the courses by using an objective function that differentiates between sequences of courses that are expected to increase or decrease a student’s GPA. The second approach combines the grades predicted by grade prediction methods in order to improve the
6Because we recommendn
0
500
1000
1500
2000
2500
Frequency
0
1000
2000
3000
4000
5000
6000
7000
8000
# Courses in the List
Actual
Grp-pop(+-)
CKRM+SVD(+-)
Figure 6: Popularity of the actual good courses, as well as courses recommended by grp-pop(+-) and CKRM+SVD(+-).
rankings produced by course recommendation methods. To obtain course rankings in the first approach, we adapted two widely-known representation learning techniques; one that uses the linear singular value decomposition model, while the other uses log-linear neural network-based models.
We conducted an extensive set of experiments on a large dataset obtained from 23 differ-ent majors at the University of Minnesota. The results showed that (i) the proposed grade-aware course recommendation approaches outperform grade-ungrade-aware recommendation meth-ods in recommending more courses that increase the students’ GPA and fewer courses that decrease it; (ii) the proposed representation learning-based approaches outperform competing approaches for grade-aware course recommendation; and (iii) the approaches that utilize both the good and bad courses and differentiate between them achieve comparable performance to combining grade prediction with the approaches that either utilize the good courses only or those that differentiate between good and bad courses.
We also provided an in-depth analysis of the recommendation accuracy across different ma-jors and student groups. We found that our proposed approaches consistently outperformed the best baseline method across these majors and groups. We also analyzed the characteristics of the recommendations in terms of course difficulty and popularity. We found that our proposed grade-aware course recommendation approaches are not prone to recommending easy courses and that they recommend courses with high and low popularity in a similar manner. This shows the effectiveness of our proposed grade-aware approaches for course recommendation.
A
CKNOWLEDGMENTWe would like to thank the anonymous reviewers for their valuable feedback on the original manuscript. This work was supported in part by NSF (1447788, 1704074, 1757916, 1834251), Army Research Office (W911NF1810344), Intel Corp, and the Digital Technology Center at the University of Minnesota. Access to research and computing facilities was provided by the Digital Technology Center and the Minnesota Supercomputing Institute,http://www.msi. umn.edu.
R
EFERENCESBACKENKOHLER¨ , M., SCHERZINGER, F., SINGLA, A.,ANDWOLF, V. 2018. Data-driven approach
to-wards a personalized curriculum. InProceedings of the 11th International Conference on Educational Data Mining. 246–251.
BELL, R., KOREN, Y.,ANDVOLINSKY, C. 2007. Modeling relationships at multiple scales to improve
accuracy of large recommender systems. In Proceedings of the 13th ACM SIGKDD International Conference on Knowledge Discovery and Data Mining. KDD ’07. ACM, New York, NY, USA, 95– 104.
BENDAKIR, N.ANDA¨IMEUR, E. 2006. Using association rules for course recommendation. In Proceed-ings of the AAAI Workshop on Educational Data Mining. Vol. 3. 1–10.
BHUMICHITR, K., CHANNARUKUL, S., SAEJIEM, N., JIAMTHAPTHAKSIN, R.,ANDNONGPONG, K.
2017. Recommender systems for university elective course recommendation. In14th International Joint Conference on Computer Science and Software Engineering (JCSSE). IEEE, 1–5.
BRAXTON, J. M., HIRSCHY, A. S., AND MCCLENDON, S. A. 2011.Understanding and Reducing College Student Departure: ASHE-ERIC Higher Education Report, Volume 30, Number 3. Vol. 16. John Wiley & Sons.
CHEN, S., MOORE, J. L., TURNBULL, D., AND JOACHIMS, T. 2012. Playlist prediction via metric
embedding. InProceedings of the 18th ACM SIGKDD International Conference on Knowledge Dis-covery and Data Mining. ACM, 714–722.
CUCURINGU, M., MARSHAK, C. Z., MONTAG, D., AND ROMBACH, P. 2017. Rank aggregation for
course sequence discovery. InInternational Workshop on Complex Networks and their Applications. Springer, 139–150.
ELBADRAWY, A.ANDKARYPIS, G. 2016. Domain-aware grade prediction and top-n course
recommen-dation. InProceedings of the 10th ACM Conference on Recommender Systems. ACM, 183–190. ELBADRAWY, A., STUDHAM, R. S., AND KARYPIS, G. 2015. Collaborative multi-regression models
for predicting students’ performance in course activities. In Proceedings of the 5th International Learning Analytics and Knowledge Conference. 103–107.
GOLUB, G. H.ANDREINSCH, C. 1970. Singular value decomposition and least squares solutions. Nu-merische mathematik 14,5, 403–420.
GONZALEZ´ -BRENES, J. P.ANDMOSTOW, J. 2012. Dynamic cognitive tracing: Towards unified
discov-ery of student and cognitive models. InProceedings of the 5th International Conference on Educa-tional Data Mining. 49–56.
GRBOVIC, M., RADOSAVLJEVIC, V., DJURIC, N., BHAMIDIPATI, N., SAVLA, J., BHAGWAN, V.,AND
the 21th ACM SIGKDD International Conference on Knowledge Discovery and Data Mining. ACM, 1809–1818.
GROVER, A.AND LESKOVEC, J. 2016. node2vec: Scalable feature learning for networks. In Proceed-ings of the 22nd ACM SIGKDD International Conference on Knowledge Discovery and Data Mining. ACM, 855–864.
HAGEMANN, N., O’MAHONY, M. P., ANDSMYTH, B. 2018. Module advisor: Guiding students with
recommendations. InIntelligent Tutoring Systems, R. Nkambou, R. Azevedo, and J. Vassileva, Eds. Springer International Publishing, Cham, 319–325.
HERSHKOVITZ, A., GOWDA, S. M., AND CORBETT, A. T. 2013. Predicting future learning better
using quantitative analysis of moment-by-moment learning. InProceedings of the 6th International Conference on Educational Data Mining. 74–81.
HU, Q.ANDRANGWALA, H. 2018. Course-specific Markovian models for grade prediction. In Pacific-Asia Conference on Knowledge Discovery and Data Mining. Springer, 29–41.
HUANG, E. H., SOCHER, R., MANNING, C. D.,ANDNG, A. Y. 2012. Improving word representations
via global context and multiple word prototypes. InProceedings of the 50th Annual Meeting of the Association for Computational Linguistics: Long Papers-Volume 1. Association for Computational Linguistics, 873–882.
HWANG, C.-S. AND SU, Y.-C. 2015. Unified clustering locality preserving matrix factorization for
student performance prediction.IAENG International Journal of Computer Science 42,3, 245–253. KENA, G., HUSSAR, W., MCFARLAND, J.,DE BREY, C., MUSU-GILLETTE, L., WANG, X., ZHANG,
J., RATHBUN, A., WILKINSON-FLICKER, S., DILIBERTI, M., BARMER, A., BULLOCK MANN,
F.,AND DUNLOPVELEZ, E. 2016. The condition of education 2016. Tech. Rep. NCES 2016-144,
National Center for Education Statistics.
KOREN, Y. 2008. Factorization meets the neighborhood: a multifaceted collaborative filtering model. In Proceedings of the 14th ACM SIGKDD International Conference on Knowledge Discovery and Data Mining. ACM, 426–434.
LAN, A. S., WATERS, A. E., STUDER, C., AND BARANIUK, R. G. 2014. Sparse factor analysis for
learning and content analytics.The Journal of Machine Learning Research 15,1, 1959–2008. LE, Q.ANDMIKOLOV, T. 2014. Distributed representations of sentences and documents. InProceedings
of the 31st International Conference on Machine Learning (ICML-14). 1188–1196.
LEE, Y.ANDCHO, J. 2011. An intelligent course recommendation system.SmartCR 1,1, 69–84.
MEIER, Y., XU, J., ATAN, O., AND SCHAAR, M. V. D. 2015. Personalized grade prediction: A data
mining approach. InIEEE International Conference on Data Mining. 907–912.
MIKOLOV, T., CHEN, K., CORRADO, G.,ANDDEAN, J. 2013. Efficient estimation of word
representa-tions in vector space.arXiv preprint arXiv:1301.3781.
MIKOLOV, T., SUTSKEVER, I., CHEN, K., CORRADO, G. S., AND DEAN, J. 2013. Distributed
rep-resentations of words and phrases and their compositionality. In Advances in Neural Information Processing Systems. 3111–3119.
MORSY, S. AND KARYPIS, G. 2017. Cumulative knowledge-based regression models for next-term
grade prediction. InProceedings of the 2017 SIAM International Conference on Data Mining. SIAM, 552–560.
MORSY, S.ANDKARYPIS, G. 2019. A study on curriculum planning and its relationship with graduation
PARAMESWARAN, A., VENETIS, P.,ANDGARCIA-MOLINA, H. 2011. Recommendation systems with
complex constraints: A course recommendation perspective.ACM Transactions on Information Sys-tems (TOIS) 29,4, 20:1–20:33.
PARAMESWARAN, A. G. AND GARCIA-MOLINA, H. 2009. Recommendations with prerequisites. In Proceedings of the Third ACM Conference on Recommender Systems. ACM, 353–356.
PARAMESWARAN, A. G., GARCIA-MOLINA, H., AND ULLMAN, J. D. 2010. Evaluating, combining
and generalizing recommendations with prerequisites. InProceedings of the 19th ACM International Conference on Information and Knowledge Management. ACM, 919–928.
PARAMESWARAN, A. G., KOUTRIKA, G., BERCOVITZ, B., AND GARCIA-MOLINA, H. 2010.
Rec-splorer: recommendation algorithms based on precedence mining. InProceedings of the 2010 ACM SIGMOD International Conference on Management of Data. ACM, 87–98.
PARDOS, Z. A., FAN, Z., AND JIANG, W. 2019. Connectionist recommendation in the wild: on the
utility and scrutability of neural networks for personalized course guidance.User Modeling and User-Adapted Interaction, 1–39.
PATEREK, A. 2007. Improving regularized singular value decomposition for collaborative filtering. In Proceedings of KDD Cup and Workshop. Vol. 2007. 5–8.
PENNINGTON, J., SOCHER, R., ANDMANNING, C. 2014. Glove: Global vectors for word
representa-tion. InProceedings of the 2014 Conference on Empirical Methods in Natural Language Processing (EMNLP). 1532–1543.
PEROZZI, B., AL-RFOU, R., AND SKIENA, S. 2014. Deepwalk: Online learning of social
representa-tions. InProceedings of the 20th ACM SIGKDD International Conference on Knowledge Discovery and Data Mining. ACM, 701–710.
POLYZOU, A. AND KARYPIS, G. 2016. Grade prediction with course and student specific models. In Pacific-Asia Conference on Knowledge Discovery and Data Mining. Springer, 89–101.
REDDY, S., LABUTOV, I., AND JOACHIMS, T. 2016. Latent skill embedding for personalized lesson
sequence recommendation.arXiv preprint.
ROMERO, C., VENTURA, S., ESPEJO, P. G.,ANDHERVAS´ , C. 2008. Data mining algorithms to classify
students. InProceedings of the 1st International Conference on Educational Data Mining. 8–17. SARWAR, B., KARYPIS, G., KONSTAN, J., ANDRIEDL, J. 2000. Application of dimensionality
reduc-tion in recommender system a case study. InProceeding of WebKDD-2000 Workshop.
SWEENEY, M., LESTER, J., RANGWALA, H., AND JOHRI, A. 2016. Next-term student performance
prediction: A recommender systems approach.Journal of Educational Data Mining 8,1, 22–51. TANG, J., QU, M., WANG, M., ZHANG, M., YAN, J.,AND MEI, Q. 2015. Line: Large-scale
informa-tion network embedding. InProceedings of the 24th International Conference on World Wide Web. International World Wide Web Conferences Steering Committee, 1067–1077.
THAI-NGHE, N., DRUMOND, L., HORVATH´ , T.,ANDSCHMIDT-THIEME, L. 2012. Using factorization
machines for student modeling. InUMAP Workshops.
THAI-NGHE, N., HORVATH´ , T., ANDSCHMIDT-THIEME, L. 2011. Factorization models for
forecast-ing student performance. InProceedings of the 4th International Conference on Educational Data Mining. 11–20.
WANG, P., GUO, J., LAN, Y., XU, J., WAN, S.,ANDCHENG, X. 2015. Learning hierarchical