Paging strategy optimization in personal communication systems
Ahmed Abutaleb and Victor O.K. Li
Communication Sciences Institute, Department of Electrical Engineering, University of Southern California, Los Angeles, CA 90089-2565, USA
Mobility tracking is concerned with finding a mobile subscriber (MS) within the area serviced by the wireless network. The two basic operations for tracking an MS, location updating and paging, constitute additional load on the wireless network. The total cost of updating and paging can be minimized by optimally dividing the cellular area into location registration (LR) areas. In current systems broadcast paging messages are sent within the LR area to alert the MS of an incoming call. In this paper we propose a selective paging strategy which uses the MS mobility and call patterns to minimize the cost of locating an MS within an LR area subject to a constraint on the delay in locating the MS.
1. Introduction
The wireless personal communications system (PCS) ar-chitecture consists of a group of base stations (BS) cover-ing the service area and interconnected by a fixed backbone network. The coverage area of the BS, determined by the terrain and the radio propagation characteristics, is referred to as a cell. Each cell contains a number of mobile sub-scribers which connect to the BS via wireless links. To provide ubiquitous location independent communications, the cellular coverage of the BSs overlap to provide the MS with a continuous coverage during a call and in the idle state. In the idle state the MS monitors the control (pag-ing) channel for incoming calls or order messages from the BS. To be able to alert the MS of incoming calls or to send order messages to a specific MS, the system has to be able to track the movements of the MS within the system. To facilitate the tracking of the moving MS, the PCS network is partitioned into location registration (LR) areas. Each LR area may contain one or more cells.
It is the task of the mobility manager (MM) of the system to handle all issues associated with MS location tracking. The mobility manager resides in the mobile switching cen-ter (MSC). The MSC is the central coordinating element for all cell sites and LR areas within its service area. The MM contains two databases to facilitate the tracking of MSs; the home location register (HLR) and the visitor location regis-ter (VLR). The HLR contains database information on the MSs whose primary subscription is within this area. The VLR, on the other hand, contains database information for all MSs currently active within the service area of the MM. When an MS enters a new location area it performs a location update (LU) on the access channels of one of the BSs in the new LR area. The VLR is updated to reflect the new location information for that MS and the HLR of that MS is updated to reflect the new location of the VLR. When an incoming call is destined for the MS, the HLR and the VLR are used to find the the LR area of the MS. Paging messages are broadcast by every BS in the LR area to alert the MS [6].
In [2] we introduced the mobility tracking problem in wireless communications. The two fundamental operations associated with mobility tracking, location update (LU) and paging, contribute to the total signaling cost on the control channels. Minimizing the total cost of signaling by mini-mizing the LU cost and paging cost constitutes contradict-ing goals. In [2] we bound the cost of pagcontradict-ing, by keepcontradict-ing the number of cells in the LR area constant, and optimized the LR area design to minimize the LU cost per MS. In this paper we address the second fundamental operation in mobility tracking, the paging strategy.
The paging strategy is used by the network to alert the MS in the LR area in which it is registered. This is per-formed whenever there is a need to establish communica-tions with a particular MS. In the current paging strategy paging messages are broadcast by each BS in the LR area where the MS is registered. When the MS receives the paging signal it starts an access procedure identical to that employed when the MS initiates a call [10]. Under this strategy the overhead due to transmissions of paging mes-sages is maximum, since every cell in the LR area broad-casts the paging message. On the other hand, the delay associated with locating the MS is minimized. All the cells in the LR area search for the MS at the same time. In [3] another simple strategy is used for cell sites arranged in a ring topology: Upon the arrival of an incoming call for the MS, the system first pages the LU cell where the MS last reported. If the MS is not found there, then the system sequentially searches for the MS in cells on either side of the LU cell until the MS is reached. Under this strategy the cost associated with the transmission of paging messages is decreased, however the delay associated with locating the MS in the LR area is increased. If searching for an MS in a particular cell takes, on the average,dtime units, the system must wait at leastdunits after paging a cell before paging the next cell.
There is a tradeoff between the paging cost and the delay associated with locating an MS, is demonstrated by the above two simple strategies. Bandwidth is a scarce resource and the blocking of users from the system due to bandwidth J.C. Baltzer AG, Science Publishers
the MS, one may attempt to page the BSs inside the LR area in such a way that the signaling cost of paging and the delay associated with locating the MS are minimized. However, since these are contradicting goals, our approach is to bound one of the variables and to minimize the other. In our formulation we bound the delay cost and introduce a new
selective paging scheme to minimize the paging signaling
cost for a particular MS call statistics and mobility patterns in an LR area of given size and shape.
2. Selective paging strategy
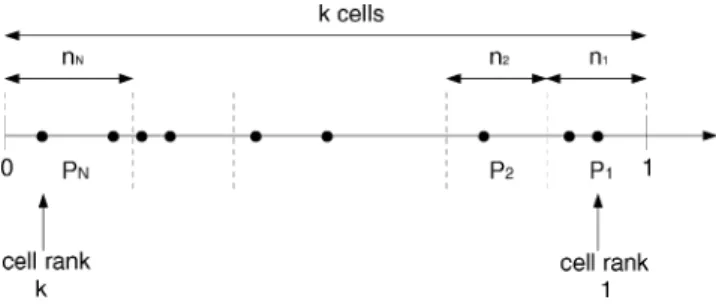
We propose a new dynamic selective paging scheme to minimize the cost of paging. The selective paging scheme partitions the LR area, of size k cells, into N partitions,
P1,P2,. . .,PN, where N 6 k. A partition Pi contains
ni cells of the LR area A. The partitions are mutually exclusive and collectively exhaustive. Thus,
∀(i,j)∈A, if (i,j)∈Plthen (i,j)∈/Pm ∀m6=l, where m∈{1,. . .,N} and N X q=1 nq =k.
Partition P1 contains the n1 cells of the LR area that the MS is most likely to be located at the time of arrival of the incoming paging call. P2 contains the next most likely n2 cells and so on. The selective paging scheme pages first the cells in partitionP1. If the MS is not found there, the cells in partition P2 are paged and so on until the MS is found. Searching for an MS in a partition is assumed to take d time units. If the MS is not found in the partition withindtime units, the MS is assumed to be located in another partition. Selective paging is a dynamic paging strategy that exploits the statistics of incoming calls to the MS and the mobility characteristics in the LR area to optimally partition the LR area to minimize the paging cost subject to a constraint on the delay of the incoming calls reaching the MS. As the processing capability of the system increases, it would be possible to design per-user partitions, however, for current systems MSs with similar incoming call rates and mobility patterns may be grouped together and the partitions are designed per group. The
selective paging shall be demonstrated for a MS which is
representative of its group.
The selective paging strategy maps the cells inside the LR area A into the probability line (figure 1) at the time of arrival of the incoming call. This mapping as will be seen later depends on many factors, such as the mobility
Figure 1. The probability line at time of arrival of incoming call. pattern of the MS in the LR area, the speed profile of the MS depending on traffic characteristics in the LR area, and the MS incoming call statistics. Define the following:
• Pr(Pi) – probability that the MS is located in partition
Pi at the time of arrival of the incoming call.
• Pr(MS in (l,m)) – probability that the MS is located in the cell with coordinates (l,m) at the time of arrival of the incoming call.
Thus,
Pr(Pi)= X
∀(l,m)∈Pi
Pr MS in (l,m) (1)
andPNi=1 Pr(Pi)= 1. Then the average number of cells paged in the LR areanpage is
npage=n1Pr(P1)+(n1+n2) Pr(P2)+· · · +(n1+n2+· · ·+nN) Pr(PN) = N X i=1 i X j=1 njPr(Pi), (2)
and the average delay in reaching an MSdpageis
dpage=dPr(P1)+2dPr(P2)+· · ·+N dPr(PN) = N X i=1 idPr(Pi). (3) 3. MS mobility model
In the current paging strategy, every BS in the LR area broadcasts the paging message. There is no attempt to use the information about the movements of the MS in a specific area to intelligently page parts of the LR area where the MS is most likely located. We would like to concentrate on vehicular MSs because they are highly mobile compared to pedestrian users, thus generating more LU traffic, due to their high speeds, and more paging traffic per incoming call, due to the larger LR area sizes associated with vehicular MSs.
Usually the MS movements are characteristic of the area the MS is located and of the time of day. In this paper we will concentrate on the cellular grid architecture. The cellular grid architecture is exemplified by a Manhattan City streets model, with the BSs located at the intersections of
Figure 2. Possible entry directions to cell (i,j).
the streets [8]. In [2] we introduced the shortest distance mobility model for vehicular MSs. The model assumes that when traversing an LR area the MS follows the shortest path, measured in number of cells traversed, through the LR area as shown in figure 3. In [2] an iterative algorithm to calculate Pr(v(i,j)), the probability of visiting cell (i,j), for the shortest distance model of mobility, was described. If we define the probability of visiting any cell (i,j) in the LR area from the W, N, E and S directions as
• W(i,j), N(i,j), E(i,j), S(i,j) – the unconditional probability of visiting cell (i,j) from the W, N, E, S directions, as shown in figure 2, using shortest distance paths, within the LR area, starting at the LU cell, then Pr(v(i,j)) can be written as
Pr v(i,j)=W(i,j)+E(i,j)+N(i,j)+S(i,j).
In the shortest distance model cell (i,j) can be visited starting at the LU cell only after traversing|i−α|+|j−β|
cells in the LR areaA, where (α,β) denotes the coordinates of the LU cell.
The cell assignments to an LR area shall be represented by a binarym×mmatrix. The matrix X can be written as X = x1m x2m . . . xmm .. . . .. ... ... .. . ... xαβ . . . .. . ... . .. ... x11 x21 . . . xm1
and the elements of the matrix are given by
xij= ( 1 if cell (i,j) is 0 ( assigned not assigned ) to the LR area. (4)
The matrixX defines the shape of the LR area. Given matrixX, the probability of visiting each cell in the LR area [2], and the incoming call patterns of the MS, we proceed to calculate Pr(MS in (l,m)), the probability that the MS is located in cell (l,m) at the arrival of an incoming call.
4. System model
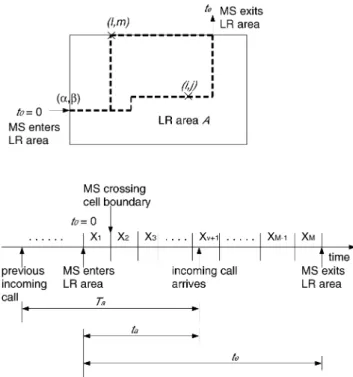
Suppose the MS enters the LU cell at timet0(figure 3). The MS then traversesMcells in the LR area before exiting
Figure 3. Example of MS movement inside LR area. at time te. The number of cells traversed in the LR will depend on the mobility pattern of the MS inside the LR area, the LR area size and shape. Let us take time t0 as reference and sett0=0. The time the MS spends in each cell depends on the traffic characteristics inside the cell and the cell size. Let the random variableXidenote the time an MS resides in a cell. Consider a Manhattan City model with the BSs located at the intersection of the streets. At each intersection, there is a traffic light. Let random variableTi be the time the MS spends moving in a cell andTdthe time the MS is delayed at the intersection, then
Xi =Ti+Td. (5)
The times the MS spends in each cell are assumed to be independent identically distributed (i.i.d) random variables. Let ta denote the time of arrival of an incoming call to the MS, after the MS enters the LR area. Thus we can represent all the time events that occur in the LR area as shown in figure 3.
From figure 3, the time the MS exits the LR area can be written as te= M X j=1 Xj, (6)
whereM is a random variable representing the number of cells traversed inside the LR area.
Assume that the inter-arrival time between incoming calls,Ta (figure 3), is exponentially distributed with mean
Ta=1/µa. Thus the probability density function (pdf) of
Tais given by
fTa(t)=µae−
Thus the time of arrival of an incoming call after the MS entered the LR area, ta, as shown in figure 3, has exponential distribution with the same mean asTa,
fta(t)=µae−
µat. (8)
5. Pr(MS in (l,m))
To calculate Pr(Pi), the probability that the MS is located in theith partition at the time of arrival of the call, we first have to calculate Pr(MS in (l,m)), the probability that the MS is located in cell (l,m), at the time of arrival of the call. In this section we will derive a formula for Pr(MS in (l,m)) that exploits the mobility characteristics of the MS inside the LR area and the incoming call statistics.
For the MS to be located in an arbitrary cell (i,j) in the LR at the time of arrival of the incoming call, at timeta, two conditions have to be satisfied:
1. Cell (i,j) has to lie on the path followed by the MS from LU cell (α,β) to the LR area boundary, and 2. if we denote by ν the number of cells in the LR area
traversed by the MS from (α,β) to (i,j), then
ν =|i−α|+|j−β|.
For a call to arrive to the MS while traversing cell (i,j) we must have (figure 3)
ν X i=1 Xi< ta6 ν+1 X i=1 Xi.
Since we are trying to evaluate the performance of the paging algorithm when a call arrives to the MS, we assume that a call will arrive while the MS is in the LR area. Since the above two conditions are independent, the probability that the MS is in cell (i,j) when the call arrives can be written as
Pr MS in (i,j)=Pr MS in cell (i,j) atta|ta< te
=Pr MS enters cell (i,j) from LR area ×Pr ν X i=1 Xi< ta|ta< te !
−Pr MS exits cell (i,j) to LR area ×Pr ν+1 X i=1 Xi< ta|ta< te ! . (9)
The first term in equation (9) is the probability that the MS visits cell (i,j) from inside the LR area, i.e., using
(i,j), given that the call occurs before the MS exits the LR area.
Using the notation defined in section 3, the probability of visiting cells in the LR area starting at the LU cell, can be written as
Pr MS enters cell (i,j) from LR area =xij E(i,j)+W(i,j)+S(i,j)+N(i,j)
, (10) and
Pr MS exits cell (i,j) to LR area =xi−1,jE(i−1,j)+xi+1,jW(i+1,j)
+xi,j+1S(i,j+1)+xi,j−1N(i,j−1). (11) Using equation (6), ifM is given, then for anyν,
Pr ta< ν X i=1 Xi|ta< te, M ! =Pr ta< ν X i=1 Xi|ta< M X j=1 Xj ! . (12)
LetM(ι,κ) represent the number of cells traversed in the LR area before exiting, such that cell (ι,κ) is the last cell visited in the LR area. Denote by Pr(e(ι,κ)) the probability that cell (ι,κ) is the last cell the MS visits before exiting the LR area [2]. Then Pr(M =M(ι,κ))=Pr(e(ι,κ)). Using the Law of total probability and Bayes theorem,
Pr ta< ν X i=1 Xi|ta< te ! = X ∀(ι,κ) Pr ta< ν X i=1 Xi|ta< M(ι,κ)X j=1 Xj ! ×Pr M=M(ι,κ) = X ∀(ι,κ) Pr ta< ν X i=1 Xi|ta< M(ι,κ)X j=1 Xj ! Pr e(ι,κ) = X ∀(ι,κ) Pr(ta<Pνi=1Xiandta<PM(ι,κ)j=1 Xj) Pr(ta< PM(ι,κ) j=1 Xj) ×Pr e(ι,κ), (13) whereM(ι,κ)=|ι−α|+|κ−β|+1. Pr(e(ι,κ)) is given by [2] Pr e(ι,κ)=xικ S(ι,κ+1)xι,κ+1+W(ι+1,κ)xι+1,κ +N(ι,κ−1)xι,κ−1+E(ι−1,κ)xι−1,κ , (14)
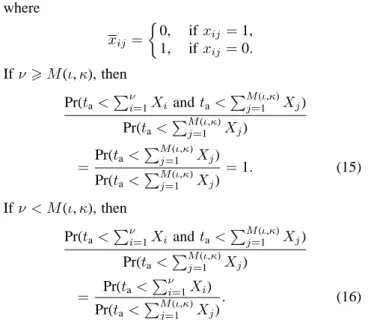
where xij= 0, ifxij=1, 1, ifxij=0. Ifν >M(ι,κ), then Pr(ta< Pν i=1Xi andta< PM(ι,κ) j=1 Xj) Pr(ta<P M(ι,κ) j=1 Xj) = Pr(ta< PM(ι,κ) j=1 Xj) Pr(ta< PM(ι,κ) j=1 Xj) =1. (15) Ifν < M(ι,κ), then Pr(ta<P ν i=1Xi andta<P M(ι,κ) j=1 Xj) Pr(ta<PM(ι,κ)j=1 Xj) = Pr(ta< Pν i=1Xi) Pr(ta<P M(ι,κ) j=1 Xj) . (16)
Inserting equations (10), (11) and (13)–(16) into equa-tion (9) we obtain a soluequa-tion for Pr(MS in (l,m)).
In the next subsection we show how to calculate Pr(ta<
Pν
i=1Xi) for any valueν for a Manhattan City model with the BSs located at the intersections of the streets. Using this result we can completely solve for Pr(MS in (l,m)) at the time of arrival of the incoming call.
5.1. Calculation of Pr(ta<
Pν i=1Xi)
From equation (8) we found that the time of arrival of an incoming call to the MS after entering the LR area is exponentially distributed with mean 1/µa. Thus,
fta(t)=µae−
µat.
The time the MS spends in a cell is given by equation (5). We will use a Manhattan City streets model, corresponding to the grid architecture, with the length of the streetsL= 300 m and the BSs located at the intersection of the streets. Traffic lights control the intersections with the duration of the green cycleg=30 s and red cycler=30 s [1,11]. The traffic lights are assumed not coordinated. This maintains the assumption of i.i.dXi. The speed of vehicular MSs in inner city follows a (truncated) Gaussian distribution with mean v = 10.86 m/s and a standard deviation of σv = 2.19 m/s [9].
An MS arriving at an intersection during the green cycle of the traffic light will suffer no delay. The proportion of users delayed, Pd, is equal to the ratio of MSs arriving during the red cycle to the total number of MS arriving at the intersection. Assuming uniform flow then,
Pd =
r
r+g =
1 2
and when delayed an MS may be delayed anywhere from 0 to (r=30) s. Thus the pdf of the delay at the intersection can be modeled as fTd(t)= g r+gδ(t)+ 1 r+g u(t)−u(t−r), (17)
Figure 4. The pdf of the waiting time at an intersection. where
u(t)=
1, t>0, 0, otherwise, andδ(t) is the dirac delta function.
The speed of the MS moving in the cell has a trun-cated Gaussian distribution, which can be approximated by a Gaussian distribution with the same parameters. Thus,
fv(t)= 1 σv √ 2πe −(t−v)2/(2σ2 v). (18)
The time spent moving in the cell is given by (v >0)
Ti=
L
v ; (19)
the mean and variance ofTi can be approximated by [7]
Ti' L v + 2L v3 σv2 2, σT2 i' L2 v2 + 6L2 v4 σ2 v 2 −T 2 i.
SinceTi andTd are independent, the mean and variance ofXiis given by
Xi=Ti+Td,
σ2Xi=σT2i+σ2Td.
Since we have assumed that the random variables (RVs)
Xi are i.i.d, let
e Xν= ν X i=1 Xi. Therefore, fXe ν(t)=fX1(t)∗ · · · ∗fXν(t), e Xν=νXi, σ2 e Xν =νσ2 Xi.
The central limit theorem states that if the RVsXiare inde-pendent, then under general conditions the density fXe
ν(t)
tends to a normal curve,N(νXi,νσ2
Xi), asν→ ∞.
How-ever, for our case fXe
ν(t) can be approximated as normal
even for smallν (say,ν>4) since the pdf ofXi, fXi(t),
is smooth.
For very small values ofν, sayν <4, the Gaussian ap-proximation ofXeν will not be very accurate. However, in this case,tawill be much bigger thanXeν, and Pr(ta<Xeν)
i=1 i=1 =1− Z ∞ 0 ΦXeν(t)µae −µatdt. (20) Note that Pr(ta < Pν
i=1Xi) is independent of the time of arrival of the incoming call and the time that the MS enters the LR area. The integral in equation (20) can be evaluated numerically for different values ofν and used in equations (15) and (16).
6. Problem formulation
Given the LR area shape and size, the MS mobility model and the MS incoming call statistics we were can calculate Pr(MS in (l,m))∀(l,m) when the incoming call arrives, independent of the time of arrival of the call and the time the MS enters the LR area. Using the values of Pr(MS in (l,m)) computed in section 5, the cells (l,m) are mapped into the probability line as shown in figure 1. At the time of arrival of a call, the probability the MS is in partitionPi is
Pr(Pi)= X
∀(l,m)∈Pi
Pr MS in (l,m). (21)
The objective of the selective paging algorithm is to choose the optimumN andni to minimize the number of paging messages subject to a delay constraint.
Problem I. Minimize npage= N X i=1 i X j=1 njPr(Pi) subject to dpage= N X i=1 idPr(Pi)< D1 and N X j=1 nj=k.
Proposition 1. Problem I is NP-complete.
Proof. We prove that Problem I is NP-complete by re-striction. Let Pij=1njPr(Pi) = s(Pi) be the cost asso-ciated with choosing partition Pi with size ni as the ith partition,i=1,. . .,N. Let v(Pi)=idPr(Pi) be the delay cost associated with choosing a particularith partitionPi. Let U be the set of all partitions andU0 ⊂U be the
sub-This is the Knapsack problem which is NP-complete [4]. One way to solve it is by complete enumeration, varying the number of partitions and enumerating all the possiblenpage and correspondingdpage and finding the optimum number of partitions and partition sizes that minimizenpagesubject
to the paging constraint.
The number of ways that we can partitionk cells into
N partitions such thatnj >1∀j andn1+· · ·+nN =k is given by [5] k−1 N−1 .
Askbecomes large, the computational complexity of enu-merating all the possible partition sizes for a particularN
increases. For small N complete enumeration is possible. We expect N to be very small. In fact, in the example we have selected, the optimal N, that achieves significant bandwidth reduction for an acceptable delay, is less than four. In the next example we will investigate how the min-imum value ofnpageand the corresponding delaydpagevary as the number of partitions increases and what value ofN
will be satisfactory for a practical problem.
7. Selective paging example
In the following example we will investigate how the minimum value of npage, equation (2), for a particularN, and the corresponding valuedpage, equation (3), vary with
N. In this example, we assume that the MS moves contin-uously. Using a similar technique to that described in [2], we can also analyze the situation in which the MS has ar-rived at its destination and stops for a relatively long time. The selective paging algorithm will be investigated for dif-ferent MS mobility models and incoming call statistics, and different LR area sizes. The following parameters will be used for our example:
• Xeν∼N(ν Xi,ν σX2i).
• Two shortest distance mobility models will be investi-gated, one with Ps =0.6 and Pr =Pl=0.2, the other withPs=0.8 andPr =Pl=0.1.
• Two different LR areas, typical for vehicular MSs, will be investigated. The LR area shapes are the optimal rectangular LR area shapes that minimize the LU rate subject to a constraint on the size of the LR area [2]. The area sizes and dimensions of the LR areas for the two mobility models are shown in tables 1 and 2.
Table 1
Optimum rectangular LR area dimensions (Ps=0.8, Pr=Pl=0.1).
Size Width Length
30 3 10
120 15 8
Table 2
Optimum rectangular LR area dimensions (Ps=0.6, Pr=Pl=0.2).
Size Width Length
33 11 3
120 15 8
For a givenk, we will partition the LR area intoN par-titions, as shown in figure 1. By complete enumeration we find the number of cells in each partition that will minimize
npage(equation 2), and the correspondingdpage(equation 3). The first step is to calculate Pr(MS in (l,m)) in equation (9) and to order the cells on the probability line as shown in figure 1. Tables 3–8 show some examples of the ranking of the values Pr(MS in (l,m)) for different cells. For the LR areas shown the LU cell is the cell ranked (1) and the MS enters the LU cell from the W direction. The cells of the tables represent the BS location in the LR area relative to the LU cell, for a grid architecture. The entries in the table are the rank of the probability line of figure 1. For example, the LU cell has the highest Pr(MS in (l,m)), thus it has rank=1 and in table 5 cells at the top and bottom right have the lowest Pr(MS in (l,m)) and thus have rank 120 and 119, respectively. The coordinates of these cells are (α+7,β+7) and (α+7,β−7) respectively, where (α,β) is the coordinate of the LU cell. Two interesting observations can be made from the tables:
• Tables 5 and 6 show that even though the dimensions of the optimum LR areas for the two mobility patterns are the same, for the same size constraint, the ranking of the values Pr(MS in (l,m)) on the probability line are very different even for the same incoming call rate. This shows that it is important to consider the MS mobility pattern in the optimization of any paging algorithm. • Comparing tables 5 and 7, and tables 6 and 8 we note
that even though the incoming call rate has doubled, the values (not shown) and the ranking of Pr(MS in (l,m)) for the same mobility models are very similar. The rea-son is that for our example the time between incom-ing calls is large compared to the time spent in the LR area, and since an exponential distribution truncated over much less than a time constant is approximately uniform, the results for 1 and 2 calls/hr is about the same. For larger cell sizes, where the MS spends more time traversing the cell, the rank will be different for different call rates.
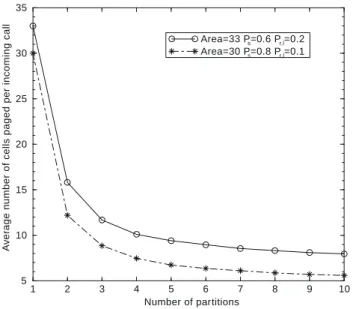
Figures 5–8 show the minimum values ofnpage, obtained by complete enumeration, and the corresponding dpage as
Table 3
Cell ranking for model withPs=0.6, Pr=Pl=
0.2, LR size 33 andµa=1 call/hr.
25 30 33 23 26 29 17 20 19 11 14 13 5 6 9 1 3 2 4 7 8 10 15 12 16 21 18 22 27 28 24 31 32
the number of partitions increases, for a calling rate of 1 call/hr and optimal rectangular LR areas of sizes 33 and 120 cells respectively, for a shortest distance mobil-ity model withPs=0.6 andPr =Pl=0.2, and area sizes 30 and 120 cells for a shortest distance mobility model with
Ps=0.8 andPr =Pl=0.1. Comparing the selective
pag-ing strategy with the conventional pagpag-ing strategy, which
pages every cell in the LR area regardless of the mobility and call patterns, we can draw several conclusions: 1. Partitioning the LR area results in a significant
reduc-tion in the average number of cells paged per incoming call compared to a static broadcast paging scheme. For example, in figure 5, by partitioning the LR area into three partitions the average number of cells paged de-creases from 30, in the conventional paging scheme, to 8.84 cells, forPs=0.8 andPr =Pl=0.1, i.e., the cost of paging per incoming call has significantly decreased by a factor of 3.4.
2. The smaller the LR area, the larger is the decrease in paging cost using selective paging compared to the con-ventional broadcast scheme for a given mobility and call pattern (compare figures 5 and 7). Current cellular net-works define the paging area by the switch boundary, which may include 30–70 cell sites to minimize the load on the switch, so the selective paging scheme is expected to have a significant gain.
3. The delay associated with locating an MS in the LR area increases approximately linearly as the number of partitions increases. However, this increase is not as significant as the decrease in paging cost. For example, in figure 6, for 30 cell sites and Ps = 0.8 and Pr =
Pl =0.1, partitioning the LR area into three partitions increases the average delay in locating the MS from d
units, in the conventional broadcast paging scheme, to 1.57d units. Thus on the average the user has to wait an extra 0.57dunits of time for the system to locate the MS. However, this additional delay is not as critical as
Table 5
Cell ranking forPs=0.6, Pr=Pl=0.2, LR size 120,µa=1 call/hr.
19 22 37 64 91 110 115 120 96 79 76 87 102 106 113 118 74 63 56 67 81 100 107 112 52 41 38 44 59 82 103 95 24 20 29 34 49 68 92 73 9 12 17 30 43 60 84 51 5 8 13 26 46 70 89 33 1 2 3 4 15 57 98 54 6 7 14 27 47 71 88 32 10 11 16 31 42 61 85 50 25 21 28 35 48 69 93 72 53 40 39 45 58 83 104 94 75 62 55 66 80 99 108 111 97 78 77 86 101 105 114 117 18 23 36 65 90 109 116 119 Table 6
Cell ranking forPs=0.8, Pr=Pl=0.1, LR size 120,µa=1 call/hr.
9 16 53 74 95 110 115 120 66 69 84 93 104 106 113 118 50 55 64 79 89 100 107 112 34 41 47 60 75 88 101 98 24 29 37 44 57 78 91 86 18 21 25 36 45 62 81 72 12 14 19 28 39 52 67 32 1 2 3 5 6 7 8 4 11 13 20 27 40 51 68 31 17 22 26 35 46 61 82 71 23 30 38 43 58 77 92 85 33 42 48 59 76 87 102 97 49 56 63 80 90 99 108 111 65 70 83 94 103 105 114 117 10 15 54 73 96 109 116 119 Table 7
Cell ranking forPs=0.6, Pr=Pl=0.2, LR size 120,µa=2 calls/hr.
23 26 41 66 93 110 115 120 94 79 76 89 102 106 113 118 74 59 56 64 81 100 107 112 48 37 39 46 61 82 103 98 19 20 29 32 51 70 90 73 9 12 17 30 43 62 84 53 5 8 13 24 44 69 87 35 1 2 3 4 15 55 96 54 6 7 14 25 45 68 86 34 10 11 16 31 42 63 85 52 18 21 28 33 50 71 91 72 49 36 38 47 60 83 104 97 75 58 57 65 80 99 108 111 95 78 77 88 101 105 114 117 22 27 40 67 92 109 116 119 Table 8
Cell ranking forPs=0.8, Pr=Pl=0.1, LR size 120,µa=2 calls/hr.
9 18 55 74 95 110 115 120 66 69 84 93 104 106 113 118 48 53 64 79 89 100 107 112 34 41 49 60 75 88 101 98 24 29 37 44 57 78 91 86 16 21 25 36 45 62 81 72 12 14 19 28 39 52 67 32 1 2 3 5 6 7 8 4 11 13 20 27 40 51 68 31 15 22 26 35 46 61 82 71 23 30 38 43 58 77 92 85 33 42 50 59 76 87 102 97 47 54 63 80 90 99 108 111 65 70 83 94 103 105 114 117 10 17 56 73 96 109 116 119
1 2 3 4 5 6 7 8 9 10 Number of partitions 5 10 15 20 25 30 35 A v er age n u mber of cells paged per incoming c all Area=33 Ps=0.6 Pr,l=0.2 Area=30 Ps=0.8 Pr,l=0.1
Figure 5. Average number of cells paged for areas with 33 and 30 cells,
Ps=0.6, Pr=Pl=0.2, andPs=0.8, Pr=Pl=0.1, respectively. 1 2 3 4 5 6 7 8 9 10 Number of partitions 1.0 1.5 2.0 2.5 3.0 3.5 4.0 4.5 A v er age dela y to reach M S Area=33 Ps=0.6 Pr,l=0.2 Area=30 Ps=0.8 Pr,l=0.1
Figure 6. Average delay for areas with 33 and 30 cells,Ps=0.6, Pr=
Pl=0.2, andPs=0.8, Pr=Pl=0.1, respectively.
the signaling bandwidth reduction achieved, since the bandwidth is the scarce resource. The user may not be very perceptive of the increase in delay, especially ifd
is small initially.
4. The smaller the LR area, the smaller is the increase in delay for the selective paging scheme compared to the conventional broadcast scheme for a given mobility and call pattern (compare figures 6 and 8).
5. Initially as the number of partitions increases there is a significant decrease in the minimumnpage. But beyond
N =4, the decrease innpage is small compared to the initial decrease. On the other hand, there is an approxi-mately linear increase in the correspondingdpage as the number of partitions increases. Thus, beyondN = 4, the advantages gained from paging cost reduction
be-1 2 3 4 5 6 Number of partitions 30 40 50 60 70 80 90 100 110 120 A v er age n u mber of cells paged per incoming c all Area=120 Ps=0.6 Pr,l=0.2 Area=120 Ps=0.8 Pr,l=0.1
Figure 7. Average number of cells paged for area with 120 cells, with
Ps=0.6, Pr=Pl=0.2, andPs=0.8, Pr=Pl=0.1. 1 2 3 4 5 6 Number of partitions 1.0 1.5 2.0 2.5 3.0 A v er age dela yto reach M S Area=120 Ps=0.6 Pr,l=0.2 Area=120 Ps=0.8 Pr,l=0.1
Figure 8. Average delay for area with 120 cells,Ps=0.6,Pr=Pl=0.2,
andPs=0.8, Pr=Pl=0.1.
come less significant compared to the increase in the average delay in searching for an MS in the LR area. So the optimum values of N that achieve significant bandwidth reduction for acceptable delay are not large.
8. Conclusions
In this paper, we proposed a new dynamic selective
pag-ing strategy that exploits the mobility pattern and incompag-ing
call rates of the MS to minimize the paging cost subject to a constraint on the delay in locating the MS. The
se-lective paging strategy partitions the LR area into several
partitions, independent of the time of entry of the MS into the LR area and the time of arrival of the incoming call. The partitions are paged sequentially until the MS is found.
6
for our example). The significant reduction in cost makes the selective paging strategy a very attractive strategy for reducing signaling on the control channels.
References
[1] A. Abutaleb and V.O.K. Li, Performance evaluation of handoff schemes in personal communication systems, IEICE Transactions on Fundamentals of Electronics, Communications and Computer Sci-ences 78(7) (July 1995) 773–784.
[2] A. Abutaleb and V.O.K. Li, Location update optimization in personal communication systems, Wireless Networks, this issue.
[3] A. Bar-Noy, I. Kessler and M. Sidi, Mobile users: To update or not to update? in: Proc. IEEE INFOCOM (1994) pp. 570–576. [4] M.R. Garey and D.S. Johnson, Computers and Intractability: A
Guide to the Theory of NP-Completeness (Freeman, San Francisco,
CA, 1979).
[5] W. Feller, An Introduction to Probability Theory and Its Applications (Wiley, New York, 1971).
[6] V.O.K. Li and X. Qiu, Personal communication systems (PCS), Pro-ceedings of the IEEE 83(9) (September 1995) 1210–1243. [7] A. Papoulis, Probability, Random Variables, and Stochastic
Pro-cesses (McGraw-Hill, New York, 1984).
[8] H. Persson, Microcellular structures and their performance, in: Proc.
IEEE Vehicular Technology Conference (1992) pp. 413–418.
[9] Road Research Laboratory, Research on Road Traffic (Her Majesty’s stationary office, London, 1965).
[10] R. Steele, Mobile Radio Communications (Pentech Press, 1992). [11] R. Steele and M. Nofal, Teletraffic performance of microcellular
personal communication networks, in: IEE Proceedings on
Commu-nications, Speech and Vision (August 1992) 448–461.
Victor O.K. Li was born in Hong Kong in 1954. He received his SB, SM, and ScD degrees in elec-trical engineering and computer science from the Massachusetts Institute of Technology, Cambridge, Massachusetts, in 1977, 1979, and 1981, respec-tively. Since February 1981 he has been with the University of Southern California (USC), Los An-geles, California, where he is Professor of Elec-trical Engineering and Director of the USC Com-munication Sciences Institute. His research inter-ests include high speed communication networks, personal communication networks, distributed multimedia systems, distributed databases, queueing theory, graph theory, and applied probability. He has lectured and con-sulted extensively around the world.
Dr. Li chaired the Computer Communications Technical Committee of the IEEE Communications Society 1987–1989, and the Los Angeles Chap-ter of the IEEE Information Theory Group 1983–1985. He was the Co-Founder and Steering Committee Chair of the International Conference on Computer Communications and Networks (IC3N), General Chair of the
1st Annual IC3N, June 1992, Technical Program Chair of the Institution of
Electrical Engineers (IEE) Personal Communication Services Symposium, June 1995, and Chair of the 4th IEEE Workshop on Computer Commu-nications, October 1989. Dr. Li has served as an editor of IEEE Network and of Telecommunication Systems, guest editor of IEEE JSAC and of Computer Networks and ISDN Systems, and is now serving as an editor of Wireless Networks. He serves on the International Advisory Board of IEEE TENCON ’90, IEEE TENCON ’94, IEEE SICON ’91, IEEE SICON ’93, IEEE SICON/ICIE ’95, the International Conference on Mi-crowaves and Communications ’92, and the International Symposium on Communications ’91. He is a member of ACM, and was elected an IEEE Fellow in 1992.