The Finance of Microfinance:
Liquidity Creation in Deposit-Taking
Microfinance Institutions
Thesis submitted for the degree of Doctor of Philosophy (PhD) in Finance.
Ane Cecilie Højstrup Jensen
Accounting and Finance Division
Graduate School of Management
University of Stirling
March 2018
Advisors:
2
Abstract
As microfinance moves beyond its traditional function as a niche development tool and towards becoming an integrated and self-sustainable part of the formal financial market, the need to deepen our understanding of its players and their financial and organisational behaviour increases. However, with primary focus in most research being on the social and cultural side of microfinance, the study of the financial behaviour of its institutions has been neglected.
This thesis explores the ability of microfinance institutions (MFIs) to function as liquidity creators for the market, on par with more traditional financial intermediaries. Using fixed effects estimations, it evaluates a range of financial and developmental drivers of liquidity creation (LC), including deposit insurance, capital ratio and risk profile. In addition to these, essays 2 and 3 evaluate the impact of specialisation and the regulatory framework, as well as a range of conditions unique to development and microfinance, such as joint lending methodologies, profit-status and the Human Development Index (HDI).
In essay 1, I find that microfinance institutions are able to create liquidity for the surrounding market, on par with, and at times surpassing, more traditional financial intermediaries. These results are similar across geographical regions and organisational types, and are positively impacted by the presence of formal regulation. However, contrary to the suggestion of traditional banking theory, the presence of deposit insurance does not appear to have significant impact on the level of liquidity created, nor does it appear to be primarily pushed by the institution’s risk profile. Instead, my findings suggest that the primary drivers of liquidity creation should be found elsewhere.
In essay 2, I find strong, consistent and positive correlation between levels of liquidity creation and the use of joint lending methodologies by microfinance intermediaries, in particular group loans. The effect is observed across all 4 LC measurements, and in both models presented. The findings support the theoretical suggestion that joint lending serves as a form of risk mitigator for MFIs in the absence of traditional collateral. In addition, it suggests that while microfinance institutions as previously found are able to create liquidity on par with traditional intermediaries, the mechanisms behind the successful production
3
are different. The unique conditions in developing and emerging financial markets appear to drown out the effects of most (though not all) of the more traditional financial drivers.
Finally, in essay 3, a two-tiered approach is used to study the effect of formal regulatory and supervisory frameworks, using MIX and World Bank data in cross-country and regional estimations. The results suggest a consistent, strong and positive effect of regulation, across very diverse areas, in terms of formalised financial frameworks and levels of development.
The thesis adds to the relatively new and still scarce empirical research on liquidity creation in general, and brings attention to the unique conditions facing financial intermediaries in emerging and especially developing financial markets. It specifically provides some first insights into the creation of liquidity in microfinance, and explores the drivers of LC by studying the impact of a range of traditional, development- and microfinance-specific variables. The empirical work adds an in-depth, cross-country look at the creation of liquidity, and provides academics, policy-makers and practitioners alike with a much needed new insight into the external financial performance of microfinance institutions, and their ability to live up to their societal role as liquidity creators for the surrounding market.
4
Table of Contents
Abstract ... 2 Table of Contents ... 4 List of Figures ... 8 List of Equations ... 8 List of Tables ... 9 Abbreviations ... 10 1. Introduction ... 11 1.1. Definition of Microfinance ... 121.2. Definition of Liquidity Creation ... 16
1.3. Motivation and Contribution ... 18
1.4. Notes on Limitations and Delimitations ... 20
1.4.1. Dataset Concerns ... 20
1.4.2. Calculating Liquidity Creation ... 21
1.4.3. First Insight ... 22
1.5. Dissertation Layout ... 22
1.5.1. The Creation and Development of Microfinance ... 22
1.5.2. Trends in Microfinance Research ... 23
1.5.3. Empirical Essay 1: Liquidity Creation in Microfinance ... 23
1.5.4. Empirical Essay 2: Drivers of Liquidity Creation ... 24
1.5.5. Empirical Essay 3: Regulation and Liquidity Creation in Microfinance ... 24
1.5.6. Conclusion ... 25
2. The Creation and Development of Microfinance ... 26
2.1. Microfinance in Ancient Rome ... 27
2.2. Medieval and Renaissance Pawn-broking... 28
2.3. Microcredit during the Enlightenment: the Irish Loan Fund ... 30
2.4. Microcredit in the 1800s ... 33
2.4.1. Friendly Societies and Savings Banks ... 34
2.5. Post-WWII Microfinance... 35
2.6. Latin America’s State-Run Agricultural Banks ... 35
2.6.1. The Challenges for State-owned Agricultural Banks ... 36
2.6.2. Credit Unions ... 39
2.7. The 1970s and 80s: The (Re-)emergence of Private Sector Microfinance ... 41
2.8. Microfinance in the 90s and 00s: The Rise of the ‘Enabling Environment’ ... 43
2.9. The 2008 Financial Crisis ... 44
5
2.11. Conclusions ... 51
3. Trends in Microfinance Research ... 53
3.1. The Identity of Microfinance... 54
3.1.1. The Compartamos Controversy ... 54
3.1.2. The Life-Cycle Theory ... 56
3.1.3. Why Identity Matters ... 58
3.2. Lending Strategy in Microfinance ... 58
3.2.1. Adverse Selection ... 60
3.2.2. Moral Hazard... 60
3.2.3. Transaction and Auditing Costs ... 61
3.2.4. Enforcement... 62
3.2.5. The Role of Loan Commitments ... 64
3.2.6. Why Lending Strategy Matters ... 65
3.3. Macroeconomic Impact ... 66
3.3.1. The Regulatory Framework ... 68
3.3.2. Why Macroeconomic Impact Matters ... 71
3.4. Access and Outreach ... 71
3.4.1. The Scale of Microfinance ... 72
3.4.2. The Scope of Microfinance ... 73
3.4.3. Why Access and Outreach Matter ... 74
3.5. Research Challenges in Microfinance ... 75
3.5.1. Data Availability and Interpretation in Microfinance ... 76
4. Liquidity Creation in Microfinance ... 78
4.1. Literature ... 82
4.1.1. Financial Intermediation ... 82
4.1.2. Liquidity Creation ... 82
4.1.3. Liquidity in Microfinance ... 86
4.1.4. Empirical Studies ... 87
4.2. Research Question and Hypotheses ... 90
4.2.1. Hypotheses... 90
4.3. Methodology ... 94
4.3.1. Measuring Liquidity in Microfinance ... 95
4.3.2. Determinants of Liquidity Creation ... 97
4.4. Data ... 101
4.5. Results ... 104
4.5.1. LC by Country and Region ... 111
4.5.2. Estimation Results ... 112
4.6. Conclusions ... 117
5. Drivers of Liquidity Creation in Microfinance ... 119
6
5.1.1. Lending Strategy in Microfinance ... 121
5.1.2. The Institutional Development of Joint Liability Lending ... 125
5.1.3. Group vs. Village Banking ... 127
5.1.4. Product Diversification and Specialisation ... 128
5.2. Research Question and Hypotheses ... 130
5.2.1. Hypotheses... 131
5.3. Methodology ... 133
5.3.1. Model 1: Diversification and Specialisation in Microfinance ... 134
5.3.2. Models 1 and 2: Measuring the Impact of Joint Liability Loans ... 137
5.4. Data ... 140
5.5. Results ... 142
5.5.1. The Impact of Specialisation ... 142
5.5.2. Model 1: Impact of Lending Methodologies on LC (Ratio) ... 146
5.5.3. Model 2: Impact of Lending Methodologies on LC (Dummies) ... 149
5.6. Conclusions ... 152
5.6.1. The impact of Lending Methodology on LC ... 153
6. Regulation, Liquidity Creation and Capital Stringency in Microfinance ... 155
6.1. Literature ... 158
6.1.1. Monopolies, Asymmetric Information and Moral Hazard ... 158
6.1.2. The Regulation of Capital Stringency ... 160
6.1.3. Regulation and Liquidity Creation ... 161
6.1.4. Regulation in Latin America ... 163
6.1.5. Regulation in East and South Asia ... 165
6.1.6. Regulation in Sub-Saharan Africa ... 166
6.2. Research Questions and Hypotheses ... 167
6.2.1. Hypotheses... 168
6.3. Methodology ... 169
6.3.1. Cross-Country and Regional Estimations ... 171
6.3.2. Independent Variables ... 173
6.4. Data ... 176
6.4.1. The Microfinance Information Exchange (MIX) ... 178
6.4.2. The World Bank Regulatory Indices ... 178
6.4.3. UN and IMF Data ... 179
6.5. Results ... 179
6.5.1. Regulation by Type and Gender ... 180
6.5.2. Cross-Country Estimations ... 183
6.5.3. Capital Requirements and Risk ... 185
6.5.4. Size and Age ... 186
6.5.5. The Macro Environment ... 187
7
6.6. Conclusion ... 192
7. Conclusions ... 194
7.1. MFIs as Liquidity Creators ... 194
7.2. The Impact of Specialisation ... 196
7.3. The Impact of Joint Lending Methodologies ... 196
7.4. The Impact of Regulatory Status and Risk ... 197
7.5. The Impact of Deposit Insurance, Capital and Capital Stringency ... 198
7.6. The Impact of the External Environment ... 200
7.7. Implications for Policymakers and Practitioners ... 201
7.8. Implications for Academia – Future Research ... 202
7.8.1. Liquidity Creation and Social Parameters ... 203
7.8.2. Expanding the Study of the External Environment ... 203
7.8.3. Regional Liquidity Creation ... 204
8. References ... 205
Appendix A: Liquidity Classification of Bank Activities ... 241
Appendix B: Regulation and LC ... 242
Appendix C: Liquidity Creation and Regulation in East Asia and Pacific ... 243
Appendix D: Liquidity Creation and Regulation in Eastern Europe and Central Asia ... 244
8
List of Figures
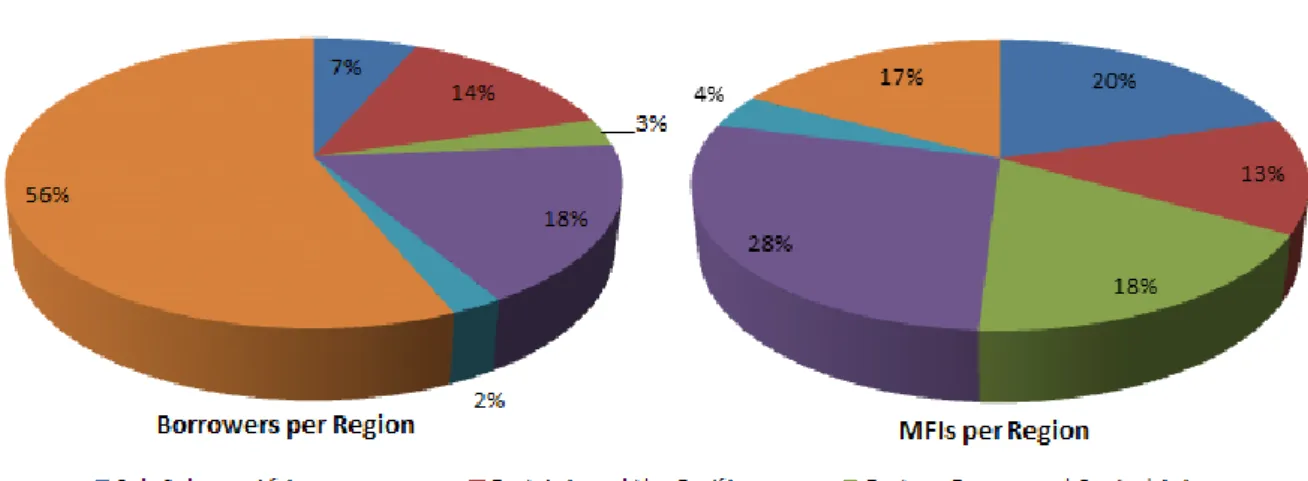
Figure 1.1: % of Borrowers and MFIs per Region, 2004 - 2015 ... 11
Figure 1.2: Loans and Borrowers per Region, by Location, 2004 - 2015 ... 13
Figure 1.3: Loans and Borrowers per Region, by Gender, 2004 – 2015 ... 14
Figure 1.4: % of Deposits and Loans per Region, 2004 - 2015 ... 15
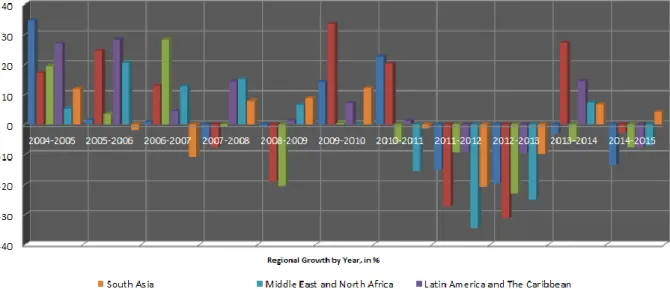
Figure 2.1: Regional Growth by Year, in % ... 48
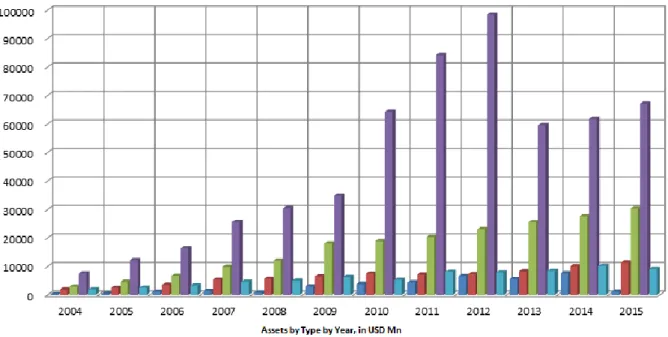
Figure 2.2: Assets by Type by Year, in USD Mn ... 49
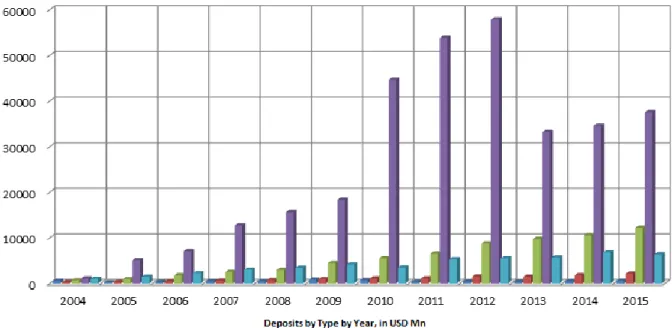
Figure 2.3: Deposits by type by Year, in USD Mn ... 50
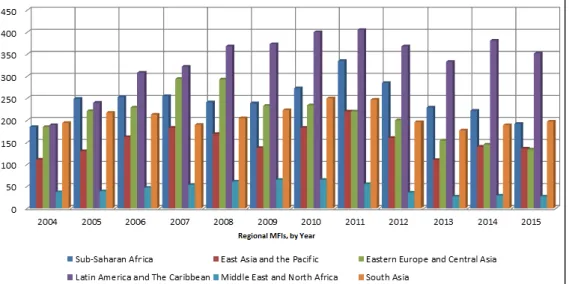
Figure 2.4: Regional MFIs, by Year ... 51
Figure 6.1: % Regulated MFIs by Region ... 180
Figure 6.2: MFI Regulatory Status by Organizational Type, 2004-2012 ... 181
Figure 6.3: % Regulation by Size ... 182
Figure 6.4: % Regulation by Gender ... 182
List of Equations
Equation 4.1: Calculation of Liquidity Creation ... 95Equation 4.2: Liquidity Creation and Deposit Insurance, DV I-III ... 98
Equation 4.3: Operational Self-Sufficiency ... 99
Equation 5.1: Loan Type as Share of Total Loans ... 134
Equation 5.2: Herfindahl-Hirschman Index (HHI) for Specialisation ... 134
Equation 5.3: Liquidity Creation and Specialisation, DV I-III ... 135
Equation 5.4: Model 1: Liquidity Creation and Lending Methodology (ratio), DV I-III ... 137
Equation 5.5: Model 2: Liquidity Creation and Lending Methodology (dummy), DV I-III .... 138
9
List of Tables
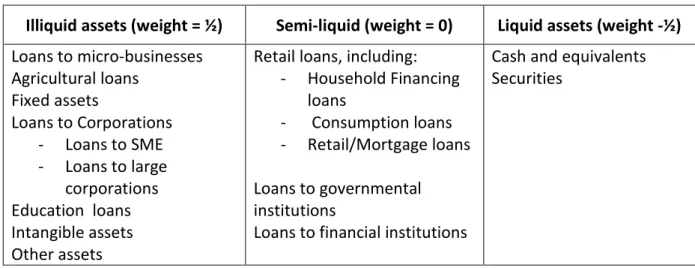
Table 4.1: Asset Classification ... 96
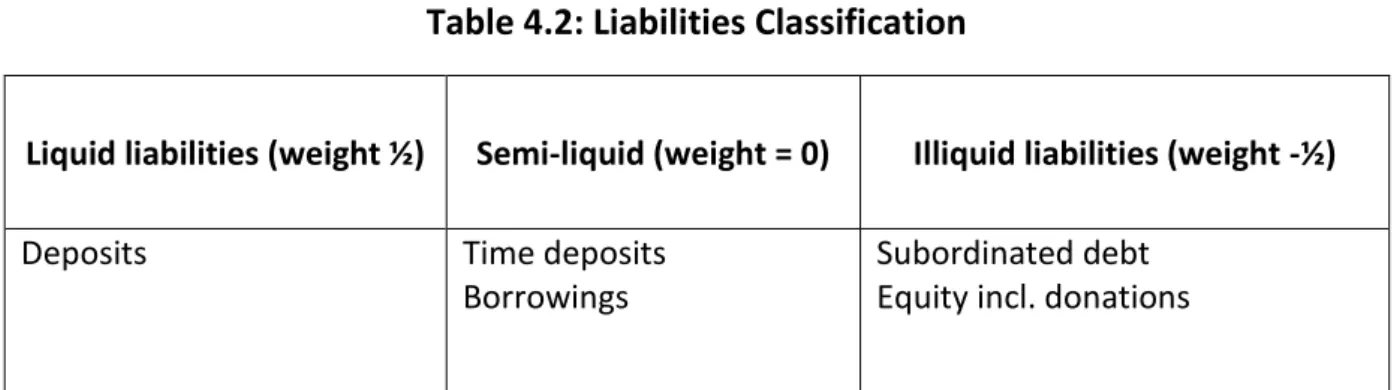
Table 4.2: Liabilities Classification ... 97
Table 4.3: Variables and Definitions ... 100
Table 4.4: MFI Summary Statistics ... 103
Table 4.5: Liquidity Creation, Across Years ... 104
Table 4.6: Summary Statistics by Type, 2004-2012 ... 105
Table 4.7: Average Liquidity Creation by MFI Size, 2004-2012 ... 106
Table 4.8: MFI Characteristics by Type, all Years ... 107
Table 4.9: Top Liquidity Creators, by Country ... 108
Table 4.10: Bottom Liquidity Creators, by Country ... 108
Table 4.11: Top LC Creators (Scaled by Size), by Country... 109
Table 4.12: Bottom LC Creators (Scaled by Size), by Country ... 109
Table 4.13: Liquidity Creation by Region ... 110
Table 4.14: Liquidity Creation by Region, Scaled by Size ... 110
Table 4.15: Estimation Results ... 113
Table 5.1: Variables and Definitions (Model 1) ... 135
Table 5.2: Variables and Definitions (Models 2 and 3) ... 139
Table 5.3: MFI Summary Statistics, for Measures of LC ... 141
Table 5.4: The Impact of Lending Specialisation on Liquidity Creation ... 143
Table 5.5: The Impact of Lending Strategy on Liquidity Creation ... 147
Table 5.6: The Impact of Lending Technology on Liquidity Creation ... 150
Table 6.1: Variables and Definitions ... 172
Table 6.2: MFI Summary Statistics, LC and Regulation ... 177
Table 6.3: % Regulation by Type, per Region ... 180
Table 6.4: Liquidity Creation and Regulation, Cross-Country ... 184
Table 6.5: Regulation in Sub-Saharan Africa ... 189
Table 6.6: Regulation in Latin America and the Caribbean ... 190
10
Abbreviations
ADB – Asian Development Bank APF – Asia-Pacific Framework
C&I – Commercial and Industrial Loans
DANIDA – The Danish International Development Agency DEP - Deposits
EAP – East Asia and the Pacific
EECA – Eastern Europe and Central Asia E - Equity
EQRAT – Equity Ratio GLP – Gross Loan Portfolio GTA – Gross Total Assets
IMF – International Monetary Fund LAC – Latin America and the Caribbean LC – Liquidity Creation
MENA – Middle East and North Africa MFI – Microfinance Institutions
MIV – Microfinance Investment Vehicle MIX – Microfinance Information Exchange
NORAD – Norwegian Agency for Development Coorperation ROSCA – Rotating Savings and Credit Association
SA – South Asia
SACCO – Savings and Credit Organisation
USAID – United States Agency for International Development WB – The World Bank
11
1.
Introduction
Microfinance institutions (MFIs) are financial intermediaries that provide a range of microloans and other financial services, usually to poor, marginalised and previously unbanked clients, who are outside the reach of traditional banks (Cull et al., 2013b). The MFIs typically use a market approach to their lending and repayment activities, and ensure continued high levels of repayment, despite the absence of collateral, by employing a range of innovative lending methodologies, such as joint lending schemes and relationship-based banking models (Armendáriz and Morduch, 2010). These innovative methodologies are used as risk-reducing mechanisms, in an attempt to compensate for the high costs of transactions, screenings, monitoring and contract enforcement, which historically have priced out more traditional intermediaries.
The size of institutions, both in terms of borrowers and assets, vary significantly from region to region, with most of the microfinance clients found in South Asia, specifically India and Bangladesh, while the number of institutions engaging in microfinance is highest in Latin America and the Caribbean (Figure 1.1 and 1.4).
12
There is an estimated 10,000 MFIs globally, though as many as 80% of these are believed to be small, informal entities (Hailey et al., 2016). Although the exact volume of extended loans is somewhat uncertain, recent data from the MIX database, found a combined gross loan portfolio of $US 114bn, extended to 139mn borrowers (Convergences, 2018).
However, available asset estimations vary significantly between surveys, and so far there exists no comprehensive map of the industry. The 2016 survey of microfinance investment vehicles (MIVs) done by the Symbiotics, suggested a combined asset pool of about 11.6 bn, held by fixed investment, mixed and equity funds (Symbiotics, 2016; Khamar, 2017).
Although the concept of microfinance has a long history behind it, with roots stretching back into antiquity, the use of modern microfinance has primarily been as a poverty reduction tool in development.
However, over the past two decades, microfinance has gained increased acceptance as a viable if niche financial sector, and has seen growth in both emerging and developed markets (Khamar, 2017). After suffering the effects of the 2008 financial crisis, the sector has bounced back, and the global portfolio grew 15.6 in 2017 (Convergences, 2018).
1.1.
Definition of Microfinance
Looking back throughout history, microfinance has its primary roots in various forms of microcredit schemes, where very small loans were specifically designed to reach the poor, the marginalised or otherwise unbanked. Even in modern microfinance, the methodology initially centred on microcredit, the extension of small loans, either through some form of relationship banking, or via joint lending approaches, in the form of group and village loans (Christen et al., 2004). Today, the concept of microfinance has been broadened significantly from its inception, and is used as an umbrella term for a range of financial services, though its target clientele is still the poorer segments of society. These services cover not just microcredit, but also savings, insurance as well as the ability to transfer funds. Microfinance is seen as one form of impact investing, where the specified goal of an investment is, in addition to a reasonable financial return, to create environmental, social or (corporate) governance (ESG) impact (CGAP, 2013).
13
Figure 1.2: Loans and Borrowers per Region, by Location, 2004 - 2015
The loans are typically extended to small and informal agricultural ventures or microenterprises, and are usually given without a collateral requirement. The loan sizes currently average $2500 in Eastern Europe and Central Asia, but as little as $250 in South Asia (Convergences 2015, citing MIX benchmarks). In comparison, the average commercial and industrial (C&I) loan size for a standard non-microfinancial commercial bank with assets over $3.7 billion was $400,000 in 2011, $95,000 in smaller banks (Gup, 2011:115).
With exception of Latin America, most loans are still given primarily to rural clients outside of the reach of traditional financial institutions, though urban microfinance is growing, especially in Africa, where small micro-business ventures and salary-based microfinance is finding increased footing (figure 1.2 and Convergences 2018).
14
Microfinance is still heavily aimed at female clients, though it varies some by region, loan size and organizational type. In South Asia, where loans are small and often given as group loans, by far the majority of clients are women. In Eastern Europe, however, where individual lending is the primary lending methodology, and the loan are larger, the male-female distribution in terms of total GLP is about 50%, while there are still slightly more female borrowers than male (figure 1.3).
15
For all regions, the percentage difference between men and women is larger in favour of the women when it comes to numbers of borrowers vs total loan size, suggesting that men on average take out larger across all five regions (figure 1.3).
Deposit-taking and GLP are largest in Latin America, an emerging region with comparably strong microfinancial infrastructure, and a longer history of modern microfinancial activity than most other regions (figure 1.4). Eastern Europe is one of the smallest regions in terms of number of borrowers (figure 1.1), but one of the largest in terms of loans and deposits extended by microfinancial institutions (figure 1.4).
Figure 1.4: % of Deposits and Loans per Region, 2004 - 2015
There is some disagreement as to whether consumer loans (to salaried consumers as well as micro-entrepreneurs) also fall under inside the microfinancial bracket. The EU specifically excludes consumer loans and defines microcredit or micro loans as loans up to 25,000 euros, strictly for self-employment or small business ventures (EU Expert Group to the EC, 2007:7). Some voices within the microfinancial sector agree, citing in particular the risk of perpetuating the over indebtedness of MFI clients (Eitzen, 2014; Etzensperger 2013; Hulme 2000) and advocate the development of a framework for identifying ‘good’ consumer loans such as school fees and health care, from the ‘bad’ or ‘unneeded’ forms of consumer loans (Rozas 2012; Schicks 2010). Other research, such as Banerjee and Duflo, argue that microcredit can be seen as just another form of disciplined microsaving, if traditional and
16
reliable options for saving through deposit-taking is unavailable (Banerjee and Duflo 2007:16).
In practice, most microfinance institutions include a handful of retail loans in their loan portfolio, of which some are long-term with maturities over a year (education, life-cycle loans and mortgages), and some which are short- and medium-term consumer-oriented products with maturities of less than a year (emergency, household finance and consumption loans) (Helms, 2006). The distinction made above is important because the scope of microfinancial loan portfolios has a direct impact on the ability of MFIs to create liquidity.
1.2.
Definition of Liquidity Creation
In banking literature, the primary functions of financial intermediaries are traditionally identified as risk reduction for investors and liquidity creation for the surrounding market (e.g. Bhattacharya and Thakor (1993), Bryant (1980), Bouwman (2013)). In this thesis, liquidity is defined as the degree to which an asset can be converted into cash, and liquidity creation is the process whereby financial intermediaries transform liquid liabilities into illiquid assets (Ledgerwood et al., 2013; Diamond and Dybvig, 1983). The process is said to ‘create liquidity’ for the surrounding market, because it transforms the ‘ease, time and cost’ associated with providing capital to previously un- and underserved clients in the microfinancial market (Berger and Bouwman, 2009: 3790)1.
In older literature, the creation of liquidity has been solidly tied to the concept of maturity transformation; the level of created (transformed) liquidity was seen as the ‘gap’ between liquid assets and liabilities, divided by total assets, and the liquidity levels of a loan was defined entirely by its maturity length (Schaefer and Deep, 2004). However, in more recent theoretical and empirical work, it has been suggested that this approach is too narrow (Berger and Bouwman, 2009). Rather than simply looking at the liquidity transformation gap between loans with different maturities, Berger and Bouwman suggested to consider the
1
For discussion of how liquidity creation is calculated in this dissertation, including classifications and weights, please see chapter 4.
17
ease, time and cost associated with an intermediary’s efforts to obtain liquid funds to meet
customer demands, as well as the ease, time and cost associated with customers’ ability to obtain liquid funds from the intermediary (Berger and Bouwman, 2009) 2.
The provision of microfinance loans to previously unbanked is a prime example of a context where liquidity creation takes place in spite of the lack of maturity transformation. Due to their inherently small sizes, microfinance loans would be considered liquid in Deep and Schaefer’s model (due to maturities typically being shorter than 1 year), but the lack of ease and high potential cost associated with the liquidation of a loan. Given the lack of collateral and underdeveloped financial infrastructure, microfinance loans are therefore considered highly illiquid, using Berger and Bouwman’s estimation (Berger and Bouwman 2009; Bouwman, 2013)3. Thus, the general hypothesis is that liquidity is created for the surrounding microfinance market, because the MFIs’ risk reduction processes and liquidity transformation enables the extension of loans to formerly unbanked clients, which were previously thought too risky.
In financial literature focusing on developed financial markets, liquidity creation is measured in what several studies call “normal, healthy commercial banks”, which excludes banks with negative equity, no outstanding loans and assets below $25M (e.g. Berger and Bouwman, 2009; Pana, 2010; Pungacova, 2010; Horvath et al., 2014; Fungacova, 2015. In the case of microfinance and developing financial markets, a similar definition is used, though only excluding financial institutions with GLPs below $1000.
2
In microfinance, the types and scale of institutions involved in microfinance are very diverse, and the institutional framework and size has impact on the liquidity created for the market. Differences in scaled LC between traditional and non-traditional liquidity creators, as well as between MFI types within the industry, are discussed in further detail in sections 4.5 and 4.6.
3
Please see appendix A for a table of liquidity classifications in Berger and Bouwman’s paper (2009). For further details on its empirical use and microfinancial classifications, please see chapter 4.
18
1.3.
Motivation and Contribution
Empirical research discussing the impact of micro loans and savings on household income and poverty levels abound.4 While there continues to be widespread debate about the accuracy of the methodologies used to measure micro-level impact, the general consensus is that microfinance institutions (MFIs) at this stage have proven their ability to remain financially self-sustainable.5
However, while a lot of attention has been paid to microfinance’s ability to fulfil a host of stated social goals, from poverty reduction to female empowerment and job creation, the financial debate has centred primarily on the micro-level. The vast majority of current quantitative impact evaluations of microfinancial initiatives focus exclusively on microeconomic factors. However, conventional bank theory has continuously highlighted the macroeconomic importance of financial intermediaries to create liquidity and transform risk, ever since Adam Smith first described the need for banks in 1776 (Manchev, 2009). It is only recently, however, that empirical assessments of liquidity creation have begun to surface, and they are still quite sparse.6
With a few notable exceptions, the macroeconomic impact of microfinance remains understudied, and none of the existing research seeks to evaluate the ability of microfinance institutions to act as liquidity creators.7 The institutional meso-level has so far been investigated using either traditional performance parameters such as return on assets (ROA), bank risk with portfolio at risk for 30 days (PAR30), or sustainability measures such as operational and financial self-sustainability (OSS and FSS).8 While these are all important indicators of internal financial performance, they say very little about the institution’s
external financial performance, or whether the institution is fulfilling its role as financial
4 See, for example, Robinson (2001), Morduch (2002), Odell (2010), Orso (2011). 5
Examples of these are Odell (2010); Agha and Ojoko-Okello (2004); World Bank (2007); Hermes and Lensin ( 2007); Hulme (2000); Simanowitz (2001); Karlan (2007).
6
See in particular Berger et al., (2011) and Schaefer and Deep (2004). 7
Buera et al. (2012) provide a quantitative assessment of microfinance’s aggregate and distributional impact on macroeconomic indicators such as output, capital, TFP, wages and interest rates. Kaboski and Townsend (2012) look at the general equilibrium effects of village banking on wages and interest rates. Finally, Ahlin and Jiang (2008) provide a theoretical framework for the conditions under which microfinance may create macroeconomic development.
8
19
intermediary for the market as a whole. ROA is a problematic measurement of mission success in a sector where a significant portion of its players are non-profit institutions. OSS and FSS are both good indicators of an institution’s internal financial health, but say little about its ability to successfully extend loans to the previously unbanked: an overly risk-averse institution may for example have strong OSS/FSS and PAR30 ratios, but create little liquidity for the surrounding market, because very few loans are given in the first place.
The measurement of liquidity creation presented in this study addresses this issue, and provides first insights into how much liquidity is created by microfinance institutions, as well as what drives the liquidity creation. These answers will help academics, practitioners and policy-makers evaluate the extent to which an individual or cluster of microfinance institutions fulfil their roles as financial intermediaries and bridge the gap between investor and client. There currently exists no other research which attempts to provide theoretical or cross-country empirical measurements of liquidity creation, or of MFI ability to fill the macroeconomic void of standard banks in times of financial crisis. Some research indicates a high and positive correlation between microfinance and the ability of micro-businesses to absorb shock (Gonzales, 2007 and 2011; Oloyombo 2013), but the research is fairly new and scarce. In looking primarily at the profitability of microfinance institutions through history, Constatinou and Ashta (2011) find that MFIs have been better than conventional financial intermediaries at surviving financial crises, though they do not comment on their macroeconomic impact specifically.
Data is drawn primarily from the MIX database and is used to explore a range of relationships between liquidity creation (LC) in microfinance and its drivers. A formula based on current bank literature is developed and adapted to the unique microfinance context. The primary drivers of LC are identified, from an array of traditional finance variables, as well as specifications uniquely important in development markets in general and the microfinance sector in particular.
Each of the questions sought answered in the dissertation’s 3 empirical essays are plucked from the current microfinance debate, while still relevant to the overarching theme of liquidity creation. As mentioned above, the essays provide some first insights into the level of liquidity created by microfinance institutions across regions with very different
20
development profiles, while also contributing to current debates related to the identity and nature of microfinance, its institutional impact and the effects of regulation on microfinance performance.
1.4.
Notes on Limitations and Delimitations
While findings in this thesis can provide researchers, practitioners and policymakers alike with some much needed guidance with regard to the nature of MFIs and their ability to perform as financial intermediaries, it is important to note that the study has a number of limitations to consider.
1.4.1. Dataset Concerns
The dataset used in the study is provided primarily by the MIX database, which is the largest publically available dataset collected in microfinance, has historically been under continued critique for lack of reliability. The criticism stems from the fact that the database originally arose from purely self-reported data, and was notorious for its poor data quality.
Despite the data concerns, the database remains the primary source of data for most research done in microfinance, and by far the majority of top-tier papers on microfinancial topics in journals of development economics and finance, have used and continue to use the database. A small sample of these are Cull et al., 2011; Morduch, 2011; Hermes and Lensink, 2011; Bogan, 2012; Mersland, 2009; Conning, 2011. About 90% of the peer-reviewed microfinancial studies in this dissertation use MixMarket data either exclusively or in combination with other data sources.
However, over the years, the data has been cleaned extensively, and this dissertation limits the data used to verified financial data, in MIX marked as diamond levels 4 and 5 (out of 5), which indicates audited financial data. Previous literature does not usually disclose what
21
diamond level they are using in their study, but those that do refer to it largely use diamond levels 4 and 59.
Even so, it is still valid to raise concerns about the data quality. The nature of development research is unfortunately such that available data very rarely reach the quality standards of data from better developed financial markets. It is an unfortunate but unavoidable reality for most academics interested in the development field, but one that will hopefully improve over time.
1.4.2. Calculating Liquidity Creation
The calculations of liquidity creation build mainly upon new literature from Berger and Bouwman (Berger and Bouwman, 2009; Bouwman 2013). They suggest that maturity transformation is inadequate as sole determinant for the level of liquidity created, especially in sectors, such as microfinance, where maturities are inherently short, due to the size of the extended loans. It is currently the best empirical alternative to Deep and Schaefer’s 2004 calculations of the maturity gap; a method both inadequate for an industry such as microfinance, as well as inappropriate due to data limitations (Schaefer and Deep, 2004).
There is a reasonable argument to be made against the Berger and Bouwman theory that institutions not taking deposits also create liquidity through asset allocation and funding of illiquid assets previously deemed too risky. This dissertation specifically looksat deposit-taking microfinancial institutions, in an effort to evaluate how MFIs perform when the liquidity transformation taking place is calculated the same ways as in non-developing financial markets. As the results in chapter 4 (specifically table 4.5) show, the average ratio of liquidity creation to total assets through the years is higher in microfinance institutions than in developed financial institutions (as given in studies by Berger and Bouwman, 2009 and Horvath et al., 2014). Regardless of this, however, there is certainly reason to argue for
9
2 exception to this are Bogan (2012) and Gwasi and Ngambi (2014), who use diamond levels 3-5. Neither study discusses the inclusion of level 3 further, but it is likely due to constriction on amount of available data. Examples of studies that do mention using only diamond levels 4 and 5 are Tchakoute-Tchuigoua (2010) and Ahlin et al. (2011).
22
further studies in liquidity creation in microfinance, where non-deposit-taking institutions are considered through asset allocation10.
1.4.3. First Insight
Finally, the study is the first of its kind in microfinance, and while it provides a first look at correlations between levels of liquidity created by MFIs and their drivers, there are very likely influences that have not been considered here. A much wider range of possible drivers, both social and financial in nature, such as the impact of national and organisational culture, ownership structures and funding structures, deserve additional attention.
1.5.
Dissertation Layout
The overarching theme of the dissertation is liquidity creation in microfinance, and though the thesis is quantitative in approach and methodology, its build is deductive. New generalised theory from traditional banking literature is used to form a test of hypotheses related to LC in microfinance, by exploring a range of unique industry conditions. Epistemologically, the subsequent discourse developed between theory and data has been more of a hybrid approach than purely deductive or inductive, but I have still chosen to provide an overarching introduction to the history, development and theory of microfinance, before diving into the specifics of the observed data.
1.5.1. The Creation and Development of Microfinance
Following the overall introduction to the field, a broader framework for the industry is provided, as well as a historical backdrop for the sector, to which most of today’s actors are anchored. The chapter outlines the development of the microfinance industry from antiquity to today. The analysis of today’s conditions identifies 4 key areas of discussion in current research, each of which forms a section of the following literature review.
10
23
1.5.2. Trends in Microfinance Research
The overarching literature review presents the main themes currently at the forefront of the microfinance debate, as identified by the previous background chapter. The four sections making up the literature review are: identity, methodology, institutional impact and outreach. Each of these is addressed in the following 3 empirical chapters, and key questions from current literature are sought answered.
1.5.3. Empirical Essay 1: Liquidity Creation in Microfinance
A continuous and contentious debate in microfinance circles is whether the very fundamental nature of the industry can and should be more than a social tool for poverty reduction. As the industry sees steady growth in more developed markets, such as Greece and Spain after the 2008 financial crisis, and in the US especially after Hurricane Katrina in 2005, it becomes still more important that we understand the industry’s effect on financial markets as a whole. If MFIs are to be seen as more than a development tool, their ability to function as traditional financial intermediaries, becomes increasingly relevant. Ultimately, the ability of MFIs to function parallel to traditional banks should influence how investors, practitioners and especially policymakers view them, and how they choose to regulate their activities.
Essay 1 provides some first insights into the ability of MFIs to perform on par with traditional financial intermediaries. The essay evaluates a range of traditional financial drivers believed to impact liquidity creation, including the presence of deposit insurance.
The results suggest that unit for unit; MFIs can create liquidity on par with traditional financial intermediaries. The calculated levels of liquidity creation in MFIs show that LC ratios, when scaled by size, are consistently higher in MFIs than in most western FIs. The finding is consistent across geographical regions and organisational structures, though it is particularly pronounced in cooperatives, NGOs and rural banks.
Using fixed effects estimations, the study finds a highly significant negative correlation between capital and liquidity creation, which is in line with the findings of previous banking literature. However, little correlation is found between the presence of deposit insurance
24
and levels of liquidity creation, and where vague correlation is found, it is positive, unlike the assumptions made by literature, expecting banks to withhold effort when the risk of bank runs is diminished (e.g. Diamond and Dybvig, 1983; Diamond and Rajan, 2001). Similarly, the relationship between bank risk to LC was also mostly insignificant, and where correlated, it was negative, rejecting the notion that high-LC MFIs are creating more liquidity through undue risk-taking (Berger and Bouwman, 2009; Berger, 2011; Bouwman, 2013).
1.5.4. Empirical Essay 2: Drivers of Liquidity Creation
While the results presented in essay 1 suggest that MFIs can produce liquidity on par with, and often in excess of, traditional intermediaries, the results also question the impact of a number of financial variables that literature has suggested may be correlated with liquidity creation, such as deposit insurance, bank risk, age and size. Based on these results, it is plausible to assume that certain conditions which are unique or of particular importance in development and microfinance exert such impact on levels of liquidity creation (LC) that they counterbalance the impact of other more traditional variables.
The second essay investigates a range of financial and development-specific drivers. Of particular interest is the impact of joint lending methodologies, which in literature is often listed as one of the primary risk-reducing strategies employed by the microfinance industry. The results show a strong, positive and consistent correlation between both specialisation and the use of joint lending methodologies, and levels of liquidity creation.
1.5.5. Empirical Essay 3: Regulation and Liquidity Creation in Microfinance
From a policy perspective, the impact of regulation and supervision on MFI performance is one of the most important, but also one of the most contentious current debates. Depending on the ideological perspective, the view on macro, meso- and microecnomic state interference in market activities varies widely from study to study.
25
However, if policymakers as a whole are interested in a prosperous and well-functioning microfinance sector, a deeper understanding of the relationship between the regulatory framework and performance indicators is needed. This is particularly important in the case of liquidity creation, which is measured in an attempt to gauge the individual institution’s ability to perform as a financial intermediary for the surrounding market.
In Essay 3, a two-tiered approach is used to study the effect of regulatory and supervisory frameworks, using MIX, World Bank and IMF data in cross-country and regional estimations, with country-level fixed effects. The results suggest a consistent, strong and positive effect of regulation, across very diverse areas, in terms of both formalised financial frameworks and levels of development.
1.5.6. Conclusion
In the final chapter, the findings of the previous chapters are summarised, and their implications for policymakers and practitioners are discussed. Finally, areas needing additional research are identified and outlined.
26
2.
The Creation and Development of Microfinance
While microfinance has gained footing as a legitimate approach to poverty reduction, notably in the last 40 years, the provision of microcredit as a tool to eliminate poverty is far from a modern invention. The creation of microfinance, both as a way to reduce poverty and as a sustainable and profitable financial approach, is often mistakenly believed to be the creation of Nobel Prize winner Muhammad Yunus’s Grameen Foundation in the 1970s.11 However, examples of microfinancial activity have existed as far back as antiquity.
The exact beginning of microfinance is hard to pin-point, because the roots of the industry are as diverse as the institutions engaging in microfinance today. The revival of microfinance within the last few decades has followed the same paradigm shift as the general development discourse, but both the informal and organised extension of micro-credit has been a way for poor and marginalised to gain access to funds since antiquity. Understanding the many and diverse historical roots and ideological perspectives which have impacted the development of the microfinance concept, thus becomes key to understanding the many approaches to and opinions on, microfinance today.
This chapter outlines the development of microfinance, from the extension of both informal and formal microcredit in antiquity, to its modern revival as poverty alleviation tool and niche financial market. The aim is to understand the many and varied branches which together form the modern microfinance tree, and to show how history may help provide insight into some of the challenges and pitfalls still facing the industry today.
The final section looks at the status quo for microfinance sector, and identifies the four main trends in current microfinance research. The same four categories form the structure of the following discussion of current microfinance research.
11
The assumption is repeated by, among others, Milford Bateman et al (Bateman, Sinković, and Škare, 2012), The International Fund for Agricultural Development (IFAD, 2004), and the New York Times (Malkin, 2008). Other sources, such as the Milana and Ashta (2012) and World Bank (World Bank, 2007) mark the 1970s as the beginning of ‘modern microfinance’, though the reason for the distinction is not fully defined.
27
2.1.
Microfinance in Ancient Rome
Some of the earliest known examples of microcredit provision can be traced back to ancient Rome. The emperor Augustus placed state income from the sale of confiscated property, previously owned by prisoners of war and criminals, into a fund, which provided loans to the poor. The loans were interest-free, but required collateral; the lender had to pledge values amounting to twice that of the amount borrowed, before the loan could be dispensed (Sartain, 1940; Cheong and Sinnakkannu, 2012). The loan system was continued by Tiberius, who expanded the scheme to include larger sums of capital, to be repaid in two to three years, which still required securities of twice the value of the loan (Weber and Musselhoff, 2013). The emperor Severus Alexander decreased the market interest rate on lending, by providing a form of subsidized lending to poor free men, sometimes at below market rate, but also at times, interest-free. The loans were given for the purchase of agricultural land, and repayment was taken from the produce grown on the lands by the lender, much like seasonal microcredit schemes today (Weber and Musselhoff, 2013; Gilbart, 1837).
Under Roman law, women were excluded from all banking and lending business in the antiquity. They could not be involved in legal monetary transactions without the permission of a male guardian, usually the husband or father (Lázaro, 2009; Gardner 1999). However, according to recent studies of inscriptions found in the Pompeiian house of A. Granius Romanus and waxed wooden tablets found at Murecine near Pompeii, the women of ancient Rome had found a way around this exclusion, leading to one of the earliest known forms of informal microlending. They set up informal credit contracts for very small amounts of money, typically extended by women to other women (Panetta, 2004). The loans were guaranteed by pledging agreements for personal items – in one case, a female lender extended small loans, typically between 15 and 20 denarii, to other women at interest levels ranging from 3% monthly to 45% annually. The loans were guaranteed through the pledges of smaller personal items, such as earrings and coats (Lázaro, 2009).12
Unlike other lending or borrowing activities, these could be done without the need for the approval of a male guardian; Lázaro proposes that this was possible due to the transactions
12
The loans were endorsed with ‘pignus-pawns’, in which personal items such as jewellery or clothing, were pledged as collateral (Lázaro, 2009).
28
being ‘res nec mancipi’, freely exchangeable, and thus, did not have to live up to legal requirements.13 Additionally, as the deposited amount was the capital of the pawn broker, the loan may have been a form of irregular deposit, which would only create obligations for the deposit taker. This way the lender would also be able to legally avoid the required presence of a male guardian (Lázaro, 2009).
The tablets show that despite the formal exclusion from banking activities, women found a way to bend the system to gain access to capital. Given the constant resurgence of war, it is perhaps not so surprising that women sometimes became a necessary and active part of the business environment: it was necessary to keep trade and production going.14 Microloans between women enabled the mobility of small amounts of capital. These were often extended by wealthy women to other women who could not obtain credit through traditional means, either due to not having the required collateral or lacking the permission of a male guardian (Lázaro, 2009).
While non-interest loans were provided by the Roman state and versions of informal finance similar to that of microcredit were practiced among Roman women and slaves, the first well-documented examples of organised, non-state micro lending and pawn broking took place across the world in China.
2.2.
Medieval and Renaissance Pawn-broking
Outside of Europe, some of the earliest attempts at non-state provision of micro-loans can be traced back to larger monasteries in 4th and 5th century China, which engaged in both pawn broking and moneylending (Woloson, 2009).
During the Southern Song Dynasty (960 – 1279), the capital was moved to the city of Huizhou, causing a boom in construction and the start of a flourishing trade sector. This was further strengthened when the merchants began forming partnerships with nearby
13
Res nec mancipi in Roman property law is one of two categories defined by Gaius. Res mancipi means property of particular importance (such as house, slaves, land), which may only be traded or transferred formally. Res nec mancipi is the opposite, ie. trade or transfers less important and thus not covered by formal requirements (De Zulueta, 1946)
14
In Roman Egypt, where the most comprehensive records of the demographic conditions of the time can be found, an estimated 60% of women were widows by the time they reached their 40s (Gardner, 1999)
29
monasteries to open pawn shops, allowing them to avoid paying a number of property taxes from which the monks were exempt, and causing the region’s economy to further accelerate (Walsh, 2010). These moneylending practices generally used capital from the ‘inexhaustible treasuries’ of the monasteries, known as ‘wujinzang’, and were often given without collateral or other guarantees, because the threat of divine wrath, should the loan not be repaid, ensured timely repayments (Walsh, 2010).
In Europe, the spread of pawn broking really began in northern Italy in the early 1400s. The budding Renaissance brought both prospering trade as well as increased poverty in the lower classes. The Catholic church prohibited making a profit on lending, so monks of the Franciscan order, founded upon a vow of poverty, suggested the creation of charitable pawn shops, where pawn-based lending could be performed, and provide an alternative to more usurious moneylending practices (Helms, 2006).
In 1450, the Franciscan monk Barnaba Manassei started a ‘monte de pieta’ in Italy’s Perugia. The institution extended interest-free loans, secured with pawned items. The borrower could typically get up to two-thirds of the value of the pawned item, and initial loans could not exceed 25 lira for clients from the city, and 10 lira for rural clients (Weber and Remer, 2011).
While the Catholic Church initially forbade charging interest on lending money, it allowed taking collateral (Weber and Remer, 2011). Non-charitable pawn shops could thus lend money using a contract which sets the ‘fine’ for not fulfilling the terms of the ‘interest free’ loan. They could also restructure the repurchase by the borrower so that interest actually was charged, having been built into in the new price. In practice, the one requirement for entering the financial sector in the Middle Ages was the ability to read and write. Since knowledge of bookkeeping was usually kept within families, the skill only spread slowly across Europe. This caused a significant difference between the Jesuits and Jews who had access to this knowledge and those who did not, causing those two religious groups to have a major impact on the development of the European financial system in the following centuries (Weber and Remer, 2011).
Pawn shops spread quickly across Italy in the latter half of the 1400s, and by 1470, 40 pawn shops existed across northern Italy alone. In 1515, Pope Leon X gave his permission for
30
pawn shops to charge interest, to cover their costs, causing a dramatic rise in shops across Europe (Walsh, 2010; UNCDP and UNDP, 2009). By the early 1600s, pawn shops had opened in Augsburg and Nuremberg, as well as Amsterdam, Ghent, Antwerp and Brussels (Weber and Remer, 2011).
In the mid-1600s, the Bank of England created the first comprehensive guidelines for pawn-broking, but it was not until the 19th century that an official legislative framework was passed by the British Parliament. The Charitable Corporation, which was founded in 1707, lent funds to poor households, using small pledges and interest to ensure repayment and financial sustainability. Up through the 1700s, the organisation became the largest in England. However, extensive fraud and lax lending procedures caused the organisation to begin bankruptcy proceedings in 1731, which were not concluded until the late 1740s (Weber and Remer, 2011). The reputation of the pawn-broking industry continued to decline up through the 1800s, where the so-called ‘dolly-shops’, a form of unlicensed pawn-broking operation known for charging usurious interest rates, became synonymous with the trade. The resulting general negative opinion led to the Pawnbrokers Act of 1878, in which interest rates were tightly regulated, along with the duration of loans (Weber and Remer, 2011).
2.3.
Microcredit during the Enlightenment: the Irish Loan Fund
In Europe, the first formal and large-scale use of collateral-free microcredit as a direct means to reduce poverty took place in Ireland in the early 1700s. In 1720, Dean Jonathan Swift, author of Gulliver’s Travels, founded a £500 pound charitable lending foundation, intended to provide small loans to poor Irish tradesmen and farmers, who were experiencing rampant poverty at the time (Jackson, 1940:10).15 The loans were without collateral, and instead employed the guarantees from a minimum of two neighbours, who would be notified in case the borrower failed to make the repayment. The system of social
15
Hollis and Sweetman note the resemblance between the beginning of the Irish Loan Funds, and the ‘rebirth’ of modern microfinance in Bangladesh, where Mohammad Yunus, like Swift, used his own funds to initiate a loan scheme specifically aimed at poor clients without previous access to capital (Hollis and Sweetman, 2001: 295)
31
pressure resembles that still used to ensure repayment of microfinancial group loans, which are typically the smallest form of microcredit provided, and where a smaller group of people all are responsible for the repayment of the full loan (Sweetman, 1996). The loans provided were £5-10, and were typically repaid in weekly instalments of between 2 and 4 shillings (Hollis and Sweetman, 2001). According to Hollis et. al, the system was a success, and Swift suffered no losses. The practice was repeated by other charitable investors, of which the Dublin Music Society is an example, who by 1768 had provided 5290 loans to needy clients (Hollis and Sweetman, 2004).
The famine of 1822 drew attention to the needs of the poor and considerable charitable donations were established, of which a sixth of the funds remained when the famine ended. These surplus funds were gathered into the Irish Reproductive Loan Fund Institution (RLFI), emulating the Dublin Music Society. The fund put in place a system which prohibited salaries or profits of any kind to its managers, in an attempt to prevent this moneylending from becoming just another speculative venture (Damme, 2011; Hollis and Sweetman, 2004). In 1823, legislation was passed that allowed the charitable funds and societies to charge interest, and exempted them from paying stamp tax.16
The stamp tax exemption made the funds preferred to standard banks and moneylenders, effectively removing 2% of the lending cost. Additionally, the provisions effectively gave the charities property rights over the assets of a defaulter, strengthened their enforcement mechanisms and enabled the charities to accept deposits at interest (capped at 6% by the state) and lend the proceeds at a profit (Damme, 2011; Hollis and Sweetman, 2001:297-303), vastly expanding the funds’ capital.
This change in legislation led to a massive expansion of privately-funded charitable societies and funds up through the 1830s, and enabled these initiatives to stay profitable. The Irish state passed laws which introduced the Loan Fund Board, intended to keep a regulatory eye on the more than 500 funds existing in 1840, and attempt to keep ever-growing concerns of corruption and sloppy management of funds under control. By 1848, the RLFI ceased to
16
According to Hollis and Sweetman, the maximum interest rate payable by borrowers permitted was initially 13,6%, reduced to 8,8% in 1843 (Hollis and Sweetman, 2001: 303). In comparison, loosened usury laws from 1786 allowed pawnbrokers to charge up to 30% in interest.
32
exist, its funds having been depleted and heavily burdened by rampant corruption (Sweetman, 1996).
At the height of their existence in the 1840s, the Irish loan funds serviced as much as 20% of the Irish population (Hollis and Sweetman, 2001: 300). The massive demand for access to credit for the poorest in society, still ignored by the standard banks, combined with the funds’ ability to charge interest, enabled the societies to accumulate substantial profits.
With the exception of now being able to charge interest, the Irish Loan Funds did not develop much in terms of how the loans were distributed; the procedure by the mid-1800s still followed those set in place by Swift in the early 1700s: a loan taker was still required to have two co-signatories, and pay back the loan in weekly instalments, typically over a 20 week period (Hollis and Sweetman, 2001).
Despite continued demand, the latter half of the 1800s saw a dramatic decline in number of funds and borrowers serviced. Sweetman and Hollis offer 3 key reasons for the decline:
1. The funds were directly dependent on favourable state legislation, which controlled the framework in which the funds were allowed to determine their interest rates, management salaries and payment procedures. With the introduction of new legislation in 1843, which reduced the permitted interest rate that the funds could offer from 6% to 5% and maximum rate payable by borrowers from 13,6 to 8,8%, the operating margins of the loan funds narrowed from 7,6 to 3,8%. According to Hollis and Sweetman, the forced reduction was primarily political, brought about by what was perceived as undue competition with regular banks for small loans (Hollis and Sweetman, 2001: 295).
2. Famine in 1822, and especially the Great Irish Famine from 1845-1852 had a substantial negative effect on the survival of the Irish loan funds. The Great Famine caused an excess mortality rate and migration, which totalled over 25% of the Irish population, and predominately hurt the poorer classes in society, which were the primary clients of the loan funds. Records show depositor losses of over £10,000 during the famine, and a larger number of the smaller and weaker loan funds perished from the impact of the Famine. However, Hollis and Sweetman note that the real surprise is that many survived, and did reasonably well, despite the very harsh circumstances (Hollis and Sweetman, 2004).
33
3. Competition increased incrementally from the commercial banks in the late 1800s. Damme argues that the loan funds undermined their own business by developing credit history, which effectively removed their lower tier competitive advantage over the banks and thus made them vulnerable to competition (Damme, 2011). Additionally, the loan funds had another significant advantage over the banks in the 1830s, where the banks still primarily operated in the larger cities, while the loan funds were placed in the more rural areas, and thus knew the local conditions and clientele much better. However, this advantage began to diminish in the 1850s, when an increasing number of rural bank branches began to open.
Sweetman and Hollis also suggest that the loan funds battled the same issues as higher tier agencies, where internal corruption and sloppy lending policies were responsible for the primary losses by the funds (Hollis and Sweetman, 2001). While the Irish loan funds showed that they were able to tackle defaulting loans, widespread corruption and faulty management issues, combined with increased competition, proved too serious to be overcome.
A fourth reason for the decline of the funds is put forth by Eoin McLaughlin, who argues that the failure of the Irish Loan Funds was caused by “…both regulatory failure and regulatory
capture, which in turn was a product of the lack of institutional reform.” (Mclaughlin,
2009:110). The Loan Fund Act of 1843 provided the legal framework for the loan funds for the rest of their existence, despite vastly changing circumstances. Mclaughlin suggests that
“…such institutional stagnation created a niche banking institution located in an ever
shrinking niche.” (Mclaughlin, 2009: 110).
2.4.
Microcredit in the 1800s
As the financial system expanded and developed throughout Europe, so did the initiatives put in place to specifically address poverty and inadequate access to adequate credit among lower classes of society. These initiatives took a number of different shapes, from charitable ‘friendly societies’ operating primarily in Britain, to savings banks and credit unions, all operating with varying degrees of commercial agendas.
34
2.4.1. Friendly Societies and Savings Banks
The mutual savings banks have their roots in the cooperative movement, which saw its first well-documented consumer cooperatives come into existence in mid-1700s England and France (Bonner, 1970). In the late 1700s friendly societies, which were comprised of people forming smaller organisations for mutual savings, pension, and insurance or banking purposes, were seen as a way for groups of similar religious or trade affiliations, to band together for mutual benefit.
This movement formed the foundation for future mutual savings banks, the first of which was Priscilla Wakefield’s small Tottenham Benefit Bank, established in 1804 (Leach and Goodman, 2000). The benefit bank was created to provide a place for the savings of poor women and children in the local area of Tottenham, and to provide pensions or disability support when members grew older. A similar initiative was aimed specifically at children, who could deposit pennies, which later could be used to cover apprenticeship fees and work clothes. The bank required timely deposits, and members would incur penalties if the deposit requirements were not met. The savings earned 5% interest, and once the loans matured, they could be withdrawn without penalty (Maltby and Perriton, 2013). Similar schemes are still used in microsavings schemes, aimed to ensure funds for children’s education and school uniforms, which often represent a significant cost and barrier to education (Majid et. al, 2013)
5 years later, in 1810, the Scottish Reverend Duncan formed the Ruthwell Parish Bank, which drastically lowered the minimum deposit entry barriers for his parishioners to open an account. Where the minimum deposit in other banks in Scotland and England at the time was £10, the Ruthwell Parish bank only asked 6 pence, if the client agreed to save a minimum of 48 pence per year, for the following 3 years (Maltby and Perriton, 2013).
Duncan cooperated with a commercial bank, to reach previously unbanked clients, much in the same way that a number of commercial banks today attempt to reach microfinance clients, by working with local SACCOs (savings and credit cooperatives) and other forms of local credit organisations of varying degrees of formality.17
17
See, for example, the work of the commercial bank CRDB in Tanzania, which employs local SACCOs in rural regions to reach previously unbanked clients (Jensen, 2009).
35
2.5.
Post-WWII Microfinance
In the mid-1900s, the approach to development changed. The period after the two world wars pushed state intervention and the desire to develop socially and financially stable societies. Top-down policy approaches in development dominated, making the governments of developing nations the primary party responsible for ensuring economic and social development (Martinussen, 1997; Milana and Ashta, 2012). Where lending with the aim to reduce poverty and ensure social stability before had been done almost entirely on a micro-level, the approaches to development in the 50s, 60s and early 70s often centred around state-funded initiatives. One of the main examples of this type of lending, and the challenges it faced, was the widespread state loans in Latin America’s agricultural sector.
2.6.
Latin America’s State-Run Agricultural Banks
With the spread of the cooperative idea in the early 1900s, other versions of the agricultural financial initiatives with a similar social agenda appeared. In Latin America, rural intermediaries were initiated in an attempt to modernise the agricultural industry through commercialisation. This was done by increasing investment through better access to credit, and by mobilising idle savings (Helms, 2006). However, unlike the cooperative banks and credit unions elsewhere, these agricultural initiatives were typically owned by government agencies or private financial institutions, rather than the poor borrowers themselves, and over time, most of the initiatives became inefficient and insolvent.
In the 1950s, large-scale agricultural development initiatives run by government agencies, came into existence especially in Latin America. The focus for most of the initiatives was on small, poor and marginalised farmers. The provision of state-sponsored credit and loans at below-market rates was distributed with the intent to increase income levels and the production capacity of the agricultural sectors. In some cases, agricultural cooperatives received concessional loans and re-loaned the capital to their borrowers, at rates well below market level interest (Gonzalez-Vega and Graham, 1995).