Worcester Polytechnic Institute
Digital WPI
Major Qualifying Projects (All Years) Major Qualifying Projects
October 2014
NavPro: Network Analysis and Visualization using
Provenance Data
Christopher Ryan Botaish
Worcester Polytechnic Institute
Michael Robert Calder
Worcester Polytechnic Institute
Follow this and additional works at:https://digitalcommons.wpi.edu/mqp-all
This Unrestricted is brought to you for free and open access by the Major Qualifying Projects at Digital WPI. It has been accepted for inclusion in Major Qualifying Projects (All Years) by an authorized administrator of Digital WPI. For more information, please [email protected]. Repository Citation
Botaish, C. R., & Calder, M. R. (2014).NavPro: Network Analysis and Visualization using Provenance Data. Retrieved from
This work is sponsored by the Assistant Secretary of Defense for Research and Engineering under Air Force Contract
FA8721-05-C-NavPro: Network Analysis and Visualization
using Provenance Data
A Major Qualifying Project
submitted to the Faculty of
Worcester Polytechnic Institute
in partial fulfillment of the requirements for the
Degree of Bachelor of Science
in
Computer Science
by
Christopher Botaish
Michael Calder
Date: October 16
th, 2014
Sponsoring Organization:
MIT Lincoln Laboratory
Project Advisors:
Professor George Heineman, Advisor
This report represents work of WPI undergraduate students submitted to the faculty as evidence of a degree requirement. WPI routinely publishes these reports on its web site
without editorial or peer review. For more information about the projects program at WPI, see http://www.wpi.edu/Academics/Projects.
Abstract
The goal of this project is to develop a tool and framework that will allow forensic analysts to leverage provenance data when investigating cyber crimes. The solution supports data collected by an existing in-development provenance-aware operating system, and is extensible so that other sources can be used in the future. The product processes live-recorded data, analyzes it internally, and presents a visualization of the data that users can navigate through in an organized way.
Acknowledgements
Without the help of certain individuals and organizations, the completion of this project would not have been possible.
First, we would like to thank Worcester Polytechnic Institute and Professor Ted Clancy for presenting us with the opportunity and arranging transportation to Lexington every day. Additionally, we would like to thank Professor George Heineman for advising our project and challenging us to make the project as successful as it was in the end.
We would also like to thank Lincoln Laboratory for providing us with the resources to complete the project in the time we were given, as well as giving us valuable experience working in the cyber security industry. Thank you Jeff Diewald for working so closely with us on the project and providing us with guidance in all of the challenges we faced. Thank you Tom Moyer for helping us solve some of the most difficult issues the project presented and for always being enthusiastic about the work. Finally, thank you Nabil Schear for all of your support and for being an encouraging resource throughout the duration of the project.
Executive Summary
As the importance of cyber security increases in organizations with sensitive data, network administrators and forensic analysts need stronger tools to keep up with cyber criminals.
Data provenance is the history of a system’s activity, commonly collected as a series of low-level actions and stored locally on the machine. While this data is large and does not aid analysts in its raw form, it has the potential to be processed and presented in a way that allows an observer to derive meaning.
The goal of this project was to produce a tool and framework for organizing, interpreting, and visualizing provenance data. This involved allowing a user to navigate through the data in order to understand a cyber attack without knowing all the details of the incident. There was already a provenance-aware operating system in development that can collect these low-level actions, but there was no central mechanism to store the data and process it. This problem led to the creation of the Network Analysis and Visualization using Provenance Data (NavPro) framework.
NavPro consists of a classification server and a web application servlet. The classification server receives data from all provenance-aware machines on a network, processes the raw data, and normalizes it to a common format so that it can be organized in a database. The web application servlet queries the database so that it can produce visualizations of the data and allow a user to navigate through those visualizations to establish meaning in the events.
The NavPro framework is extensible in that it allows plugins to be written for different data sources and operating systems. It also provides APIs that abstract database-specific functionality so that different databases can be used to store provenance data in the future. The final product is cross-platform and can be deployed in an automated way on Mac OS X and Linux operating systems.
Table of Contents
1 Introduction ... 9 1.1 Data Provenance ... 9 1.2 Project Scope ... 10 2 Background ... 11 2.1 Information Security ... 11 2.2 Security in Linux ... 112.2.1 Classic Operating System Access Rights ... 12
2.2.2 SELinux ... 12
2.3 Cyber Threat Sources ... 13
2.4 Provenance ... 14 2.4.1 Collection ... 15 2.4.2 Encoding ... 15 2.4.3 Storage ... 16 2.4.4 Analytics/Visualization ... 16 2.4.5 Security ... 17
2.4.6 Linux Provenance Modules (LPM) ... 17
2.5 Visualization ... 17 2.6 Analytics ... 19 2.7 Technologies ... 20 3 Methods... 23 3.1 Project Preparation ... 23 3.2 Classification ... 25
3.2.1 Retrieving Provenance Information ... 26
3.2.2 Parsing Raw Data ... 27
3.2.3 Normalizing Actions ... 27
3.3 Database ... 29
3.3.1 Technology Comparisons ... 29
3.3.2 Database Schema ... 30
3.3.3 Java Database Interface Architecture ... 32
3.4.1 Server-Side Query API ... 33
3.4.2 Client-Side Web Application ... 34
4 Results ... 36 4.1 NavPro Product ... 36 4.1.1 Data Analysis ... 36 4.1.2 Visualization ... 38 4.1.3 User Features ... 41 4.2 Additional Outcomes ... 45 4.2.1 Scenarios ... 45 4.3 Evaluation ... 46 4.3.1 Requirements ... 46 4.3.2 User Study ... 47 5 Discussion ... 49
5.1 NavPro Future Development ... 49
5.1.1 New Visualizations ... 49
5.1.2 Advanced Filtering ... 50
5.1.3 Added Security ... 50
5.2 Addressing LPM Limitations ... 51
5.3 NavPro Deployment Potential ... 52
6 References ... 53
7 Appendix A – Parsers and Normalizers ... 55
7.1 Parser API ... 55
7.2 Normalizer API ... 55
7.3 Parsing LPM Binary Data ... 55
7.4 Normalizing Parsed LPM Actions ... 57
8 Appendix B – Database APIs ... 58
8.1 Knowledge Cache API ... 58
8.2 User Database API ... 58
8.3 Events Database API ... 59
9 Appendix C - Visualizer Query API ... 61
9.2 POST Queries ... 64
10 Appendix D – NavPro Extension Developer’s Guide ... 67
10.1 Sending Data To NavPro ... 67
10.2 Writing A NavPro Parser ... 67
10.3 Writing A NavPro Normalizer ... 69
10.4 Using A Database Other Than MySQL ... 70
11 Appendix E – NavPro Deployment Guide ... 71
11.1 Deployment Directory Layout ... 71
11.2 Configuring NavPro ... 71
11.3 Deployment on Mac OS X ... 74
11.4 Deployment on Linux ... 74
11.5 Deployment on Windows ... 75
Table of Figures
Figure 1: Data provenance relationships as defined by OPM [3] ... 15
Figure 2: Internet map visualization [12] ... 19
Figure 3: Data storage hierarchy for BigTable ... 21
Figure 4: D3.js visualization examples ... 22
Figure 5: NavPro Architecture ... 24
Figure 6: Project Timeline ... 25
Figure 7: AJAX Request Architecture ... 35
Figure 8: Initial Tabular Visualization ... 38
Figure 9: Chart Based Visualization ... 39
Figure 10: Filter User Interface ... 40
Figure 11: Filters and Charts ... 40
Figure 12: Chart Visualization with Table Visualization ... 41
Figure 13: Viewing Table Cell Details ... 41
Figure 14: Profile Selection ... 42
Figure 15: Profile Dropdown ... 42
Figure 16: Adding a Bookmark ... 43
Figure 17: Accessing and Removing Bookmarks ... 43
Figure 18: Modifying Alert Trigger Settings ... 44
List of Tables
Table 1: Classic Linux Permissions [27][28] ... 12
Table 2: Knowledge Cache Schema ... 30
Table 3: Users Table Schema ... 31
Table 4: Bookmarks Table Schema ... 31
Table 5: Alerts Table Schema ... 31
Table 6: Notifications Table Schema ... 32
Table 7: Event Table Schema ... 32
1
Introduction
In the modern world, organizations have become dependent on computing and networking technologies. With operations and intellectual property residing exclusively in the digital world, cyber security has become vital. Increasingly, motivated attackers have sought to access internal networks to steal confidential information and compromise operational integrity.
In this landscape, companies must use strong security measures and vigilance to prevent cyber attacks. Because cyber attack methods constantly evolve, not all threats can be prevented. In these cases, the ability to perform quick and effective forensic analysis on a system can provide crucial details about the mission impact of an attack and help orchestrate an appropriate response.
1.1 Data Provenance
Data provenance provides one potential forensic outlet. Provenance is the “history of an object, either physical or digital” [1]. Many fields, such as fine art, use provenance to track the history of an artifact over time. In computing, data provenance helps answer questions about the integrity and confidentiality of data. These answers are an important step in the forensics process.
A system that supports data provenance can be broken into five components [1]: • Collection – The method through which the data provenance is gathered. • Encoding – The format with which the data provenance is represented.
• Storage – The method and form of storage used to persist the data provenance. • Analytics/Visualization – The tools used by a human operator to understand data
provenance.
• Security – The measures taken to ensure the integrity, confidentiality, and availability of data provenance.
Many of these components have been extensively studied in the research literature and solutions have been proposed. Linux Provenance Modules (LPM) is one such solution that focuses on these aspects of data provenance for the Linux operating system [5]. However, it is difficult for humans to make sense of this data without effective
analytic and visualization solutions. Provenance data can be overwhelmingly large and difficult for a human to understand.
1.2 Project Scope
The Network Analysis and Visualization using Provenance Data (NavPro) framework will help analysts explore and investigate cyber attacks by satisfying the following base requirements:
• NavPro will be accessible through a web browser.
• NavPro will allow a user to input Linux Provenance Modules (LPM) HiFi data. • NavPro will allow a user to view activity performed on (or by) an entity (user,
process, or file).
• NavPro will simplify provenance data from system calls to readable actions. • NavPro will allow a user to search for activity based on different types of entities.
• NavPro will be deployable in an automated way.
If time and resources allow, this project will additionally fulfill the following requirements:
• NavPro will have the capability to accept provenance data from different data sources, operating systems, etc. through an extensible plugin system.
• NavPro will allow a user to monitor a network of computers from the web application.
• NavPro will allow a user to view activity performed by a specific host in a network.
• NavPro will allow backward and forward navigation through visualizations. • NavPro will allow a user to export the raw data from a table or chart visualization
based on the current filter set.
• NavPro will allow a user to set alerts for entities (hosts, users, processes, files) and be alerted when an event occurs involving that entity.
2
Background
2.1 Information Security
Information Security (InfoSec) is the practice of protecting information from unauthorized access or modification [21]. A common way to describe information security is that it seeks to assure three principles, known as CIA principles [22]:
• Confidentiality – Information is only accessible by those who are authorized to access it. For example, classified information is only accessible to those with the proper clearances and need-to-know.
• Integrity – Information is only modifiable by those who are authorized to modify it. For example, an attacker cannot add a new account to the /etc/passwdfile.
• Availability – Information is always accessible to those who are authorized to access it. For example, an attacker cannot reduce the availability of a service through a Denial of Service (DoS) attack.
The tenets of information security are at the core of cyber security, with many solutions addressing a subset of the CIA assurances. Traditional operating system permissions systems ensure the confidentiality and integrity of data by limiting read, write, and execute privileges. Services such as CloudFlare attempt to thwart DoS attacks and ensure availability [25].
While these solutions work at the prevention level, data provenance allows analysts to understand which principles were violated after a cyber attack has occurred. A system administrator can use data provenance to determine the information an attacker accessed, and show where data has been leaked and confidentiality has been violated. Likewise, by seeing what information an attacker modified, data provenance can show where data has been corrupted and integrity has been violated.
2.2 Security in Linux
There are two main components to security in the Linux operating system: classic Linux access rights and Security-Enhanced Linux (SELinux) policies [23].
2.2.1 Classic Operating System Access Rights
The classic operating systems concept of access rights refer to the read-write-execute permissions system used to define what a user or group can do with a file. Every file and directory contains a set of permissions that can be expressed with three octal digits. The first digit is for the owner of the file, the second is for the group the file is assigned to, and the third is for all other users [28]. Each octal digit is a three-bit value between 0 and 7, where the rightmost bit indicates execute permissions, the middle bit indicates write permissions, and the leftmost bit indicates read permissions. For example, the permissions value 163 translates to -‐-‐xrw-‐-‐wx, or that the owner can only execute,
the group can read and write, and other users can write and execute. The mappings between each number and the corresponding permissions can be seen in Table 1.
Number Permission rwx bits
7 read, write, and execute 111
6 read and write 110
5 read and execute 101
4 read only 100
3 write and execute 011
2 write only 010
1 execute only 001
0 none 000
Table 1: Classic Linux Permissions [27][28]
2.2.2 SELinux
SELinux is a set of Linux kernel patches originally developed by the National Security Agency and merged into the mainline Linux kernel in August 2003. SELinux provides Linux support for access control security policies, including the Department of Defense’s mandatory access controls (MAC) [23]. MAC controls what a process or thread can do on a system by limiting access to targets such as files, directories, ports, memory, or devices. In essence, MAC provides sandboxing for processes, containing the
damage that can be caused in an exploit by forbidding the process from accessing targets outside of itself and its resources.
SELinux implements its access control security policies at the lowest system call level. When basic functions such as link, inode_alloc, or inode_dealloc, are called,
SELinux checks its policies to see if the call is allowed. A subset of where SELinux performs its policy checks can be seen in the Hi-Fi system [7].
Provenance data collection mechanisms can leverage the location where SELinux performs its policy checks to collect its provenance data. By collecting data after SELinux performs its checks, these mechanisms can ensure that the system calls were actually executed and not stopped due to policy violations. This allows the capture of all major events that have actually occurred within a system.
2.3 Cyber Threat Sources
Cyber threats to an organization can take many different forms and come from numerous sources. Currently, the greatest source of cyber threats is external intruders, or hackers, that seek to gain access to a system [30]. The goals and motivations of external intruders can vary greatly, but in general external intruders are attempting to violate information security principles [21]. These intruders often gain access to a network through unpatched and exploitable software [29]. Once on the network, these intruders work to secure a reliable access point. External intruders can often be detected through their entry point to the network, but the impact of what the intruder has done on the system is not easily understood.
Malware attacks represent one way that external intruders seek to gain access to an organization’s networks. Malware has evolved in recent years from being a way to satisfy curiosity into a source of “illicit financial gain” [29]. This shift has led to increased malware production – in 2010 alone, over 280 million new malware variants were detected by Symantec [29].
A key way that malware gains access to a system is through tactics that target internal individuals, such as spear phishing. Spear phishing is the practice of creating targeted, personal emails that aim to trick a target into downloading and running malicious code [24]. Spear phishing represents a major threat and source of weakness of organizational networks [29]. The symptoms of malware are often easily identified
through the detection of system file modification. Once detected, however, it can be difficult to deduce where the malware entered the system, information that is vital to crafting an effective response and ensuring the security of the system. As malware becomes more profitable, and therefore more pervasive, it will continue to be a growing problem that organizations must confront.
The second largest source of cyber threats is insider threats, which can come in the form of current or former employees and contractors of an organization [30]. The types of insider threats vary: an insider threat can be malicious, such as a user trying to steal information from an organization, or benign, such as a user that unknowingly uses an infected USB drive on organizational equipment. In both of these scenarios, an insider threat is an individual who, whether maliciously or not, violates information security policies put in place by the organization.
2.4 Provenance
Provenance, a term commonly associated with fine art, is the history of an artifact. Many pieces of art have records to indicate their chronology of ownership, allowing collectors to confirm their authenticity.
Data provenance takes this same concept and applies it to computational systems and artifacts. On a provenance-aware machine, records of interactions between users, processes, sockets, and files are stored so that an observer can understand what actions left the computer in its current state. Figure 1 visualizes the relationships between these entities.
Figure 1: Data provenance relationships as defined by OPM [3]
The responsibilities of systems that implement computer provenance can be broken down into five steps: [1]
2.4.1 Collection
During this step, a system is responsible for collecting the raw information that will form the basis of the data provenance.
There are many research projects that study different mechanisms for collection of provenance. One example is PASS, which involves modifying a file system to record activity [6]. Also, modifying the Linux kernel (like Hi-Fi does) can allow low-level system calls to be tracked [7]. Databases can also be provenance-aware; Trio is an example [8]. The main concern with collection regards scalability, and each of these solutions has their own unique methods to minimize the amount of data collected.
2.4.2 Encoding
Once raw information has been captured, the provenance system must properly encode the information for processing. Decisions need to be made about what metadata comes along with each event that is encoded, such as whether a timestamp is included or if host/user attributes should be noted. Each collection system typically proposes its own encoding based on what information is collected.
The only provenance encoding standard still being updated is W3C PROV, while PASS provides its own specification and OPM has been used but is no longer active (last updated in early 2013) [2][3].
2.4.3 Storage
On any given machine running a modern operating system, thousands of actions occur every minute even when the user is not actively working. Because of the vast amounts of data that is collected, storing this data in an efficient way can be extremely difficult. While some research has been done to minimize the amount of storage required for provenance data, any mechanism that involves keeping the data on the machine where it is collected can create performance and memory overheads [9].
There is no standard way to determine how to store provenance data; many different options have been attempted. Storing data in an SQL database allows encoded provenance actions to be sorted into tables based on the type of information they contain. If the collected data is all in the same format, a NoSQL database could provide more scalability. To prevent memory issues on the client, data can be sent off to a central server that stores the database of events in the cloud. All of these methods provide different tradeoffs that need to be considered.
2.4.4 Analytics/Visualization
An area where very little success has come so far is the analysis and visualization of provenance data. While possessing the data creates the potential to perform forensic analysis of malicious computer activity, searching through and interpreting the data presents a significant challenge.
The reason almost no work has been done in this area is because big data visualization can be complex when each action alone can represent significant activity. While visualizations such as heap maps can make the density of action types understandable for a human operator, navigating through these visualizations to extract meaningful data can be difficult. Using analysis to simplify the data prior to the visualization stage may be a path to solving this problem, but such an avenue has not yet been explored.
2.4.5 Security
The final responsibility of data provenance is that everything must be collected securely. When it comes to provenance data, a “secure” collection method has been defined as being tamperproof, simple to verify, and providing complete observation [4].
2.4.6 Linux Provenance Modules (LPM)
Recently, a framework for developing provenance-aware systems was created; this framework is called Linux Provenance Modules [5]. LPM is able to leverage Linux’s existing security features to provide strong provenance security guarantees. This can be accomplished by inserting data-collecting hooks after the existing security hooks SELinux has in place. This means that as an interpreter of the data, an analyst can be confident that permission or policy issues did not later block any recorded actions.
One of the current provenance collection implementations built on LPM is a version of Hi-Fi that outputs the data collected in the kernel to a relay buffer that can be removed by a process in user space at any given time to encode and store the data. This data indicates what kernel-level system calls were executed since the relay buffer was last emptied. Each data message also contains enough information to associate the call with a user, process, and possibly a file as well.
While there may be other provenance-aware systems that use LPM over the next few years, the framework is currently a work in progress and research is still being done to further enhance LPM's abilities.
2.5 Visualization
The field of Computer science visualization can be subdivided into six different sub-fields [10]:
• Information visualization
• Interaction techniques and architectures
• Modeling techniques
• Multi-resolution methods
• Visualization algorithms and techniques
For this project, we will focus on information visualization, where the information displayed consists of the actions that represent computer activity collected by provenance-aware systems.
Information visualization takes advantage of the innate ability of humans to see and understand large amounts of information rapidly. Information visualization focuses on “the creation of approaches for conveying abstract information in intuitive ways [11].” Although the observer interprets the data being presented, the visualization system is only attempting to display the data in a way that can be understood. The collection mechanism is responsible for obtaining data that can be used to derive meaning, and the analysis mechanism is responsible for deriving meaning from the visualization of the data. The visualization’s responsibilities do not stretch beyond the presentation of the information.
In addition to having data points in a visualization represent actions over a period of time, information visualizations can also show relationships between data assuming the collection mechanism provides that data as well. One example of this strategy applied in visualization is the Internet map visualization in Figure 2. This visualization uses the length of lines between two nodes to represent the delay between two IP addresses, where each node represents a single IP address.
Figure 2: Internet map visualization [12]
Another feature that can be utilized in information visualization is interaction. If a graph or chart allows entities to be selected in such a way that navigation occurs, the user experience can potentially be enhanced. This technique becomes most practical when the data being visualized is extremely large. A common result of making visualizations interactive is that many more types of data presentations occur. In addition to letting an analyst zoom in on a particular part of the initial display, the way the data is presented can morph into different visualizations as the user navigates through it.
This concept of a human manipulating a visual representation of data leads into the subject of visual data analysis. In the overall flow of information the visualization is the tool used to perform the analysis. The analysis is where meaning in the data is finally established.
2.6 Analytics
While analysis is often perceived as a part of or synonymous to visualization, it is a significantly different aspect of data interpretation. While the two are often performed together in the process, neither one is a part of the other. Visualization can allow for analysis, while analytics can drive visualization.
With regard to provenance data, analysis must occur both before and after data visualization. After the raw data is collected, processing needs to be done before storage that cuts down the amount of information that needs to be visualized. Without this step, the size of the data is too large to produce meaning. Common methods used to perform this reduction include record matching, deduplication, outlier detection, and column segmentation [13].
After visualizations have been generated, analysis of frequency counts and associations can be used to establish meaning. The main goal of big data analysis is to establish patterns in small actions that represent larger actions. In the case of provenance data, this is a result of having the data collection mechanism record all activity on a system.
2.7 Technologies
While the collection mechanism for the provenance data is already in place for this project, many different technologies can be leveraged for encoding, storage, analytics, and visualization.
First of all, the current list of cross-platform programming languages that provide strong object-oriented extensibility is limited. The most popular is Java, which can be run on any modern operating system because it is run inside the Java Virtual Machine (JVM) and lacks kernel-specific dependencies by nature [14].
Because LPM data is collected as binary data, we leverage an existing parser written in C using the Java Native Interface (JNI) [15]. While JNI has a bad reputation for causing large development costs to manipulate Java objects in C, passing strings between the two languages is not difficult and allows encoding and decoding of data to be performed without having to inspect each byte received in Java code.
As far as data storage is concerned, there are many options available. A simple solution that is more practical as an initial data store is MySQL [16]. The open source relational database allows batch scripts to be used to store data quickly and leverages the SQL language to provide simple querying. As the data gets larger over time, this may become an impractical solution.
A common solution to the storage scalability problem is to leverage a NoSQL database, one of the most common being Accumulo [17]. This is effectively a key/value
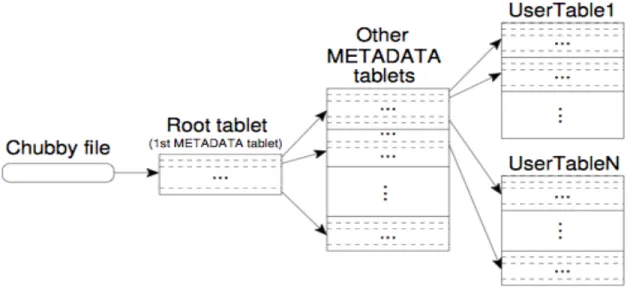
store that is much more scalable than MySQL and can have strong performance with big data. The scalability is accomplished by leveraging Google’s BigTable, a distributed storage system published in 2006 [18]. The implementation uses a three-level hierarchy depicted in Figure 3. More details can be found in [18].
Figure 3: Data storage hierarchy for BigTable
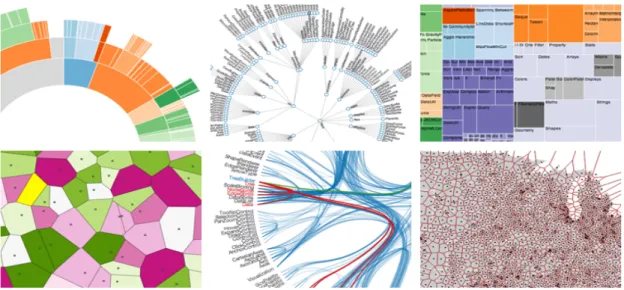
Once the data is stored and can be queried, visualizations need to be produced. d3.js, a popular JavaScript library, allows visual elements to be tied to large datasets and be intuitively manipulated in a web browser [19]. The library is open source and well-documented. Examples of visualizations created by d3.js can be seen in Figure 4.
Figure 4: D3.js visualization examples
While the visualizations used to display provenance may be less complex in the final product, it is clear even at a quick glance that D3.js is powerful enough to handle any data we may present it with.
Finally, to tie these visualizations together a front-end framework will be needed to effectively allow the user to navigate the web application. The most common technology used to accomplish this is called Bootstrap [20]. This framework provides quick front-end implementation that a project as short on time as this one will need.
Many of the technologies discussed in this section are the most common and well-documented frameworks used to accomplish their respective purposes. It is important to select easily leveraged technologies so that the majority of our short time for this project is not spent on learning unnecessarily complex tools and languages.
3
Methods
In this section we begin by discussing our initial steps in preparing for the project. This involves how we defined our requirements, how we decided on measures for success, and how we designed our initial architecture. We then break down that architecture into each of its major components and explain the significant choices we made at each step. Additionally, we discuss how each component contributes to the usefulness of NavPro from a user/developer point of view.
3.1 Project Preparation
In our first week at Lincoln Laboratory, our objective was to read through all of the documentation we could find, including research papers we were given, to learn the current state of provenance data research and understand the scope of our project. We found ourselves speaking with experts in big data, visualization, and computer forensics. This effort helped us define the concrete requirements for the project. We started by identifying a core set of user stories to capture the essential features of the project [26]. To increase the effectiveness of these user stories, we created a user persona to represent the actor in the user stories.
To learn more about how to create a realistic user persona, we worked closely with Jeff Diewald (Group 58), who had significant experience with the subject. With his help, we created Carl the Network Administrator. Carl is 35 years old and has a Bachelor’s degree in Management Information Systems. He has a wife and two kids, and is familiar with data provenance but is not an expert in the field. His career goal is to be more successful at his job so that he can provide a bright future for his family.
Carl knows that he can use data provenance to be more effective at his job and impress The Boss, but he needs a tool that allows him to intuitively interact with and understand the data. When his coworkers come to him looking for help investigating a cyber threat, he is usually looking to view activity involving a specific host, user, process, or file. Using this persona along with the different kinds of common cyber threats discussed in the background, we were able to create the lists of requirements for NavPro that depict its baseline features, reasonable outcomes, and future direction.
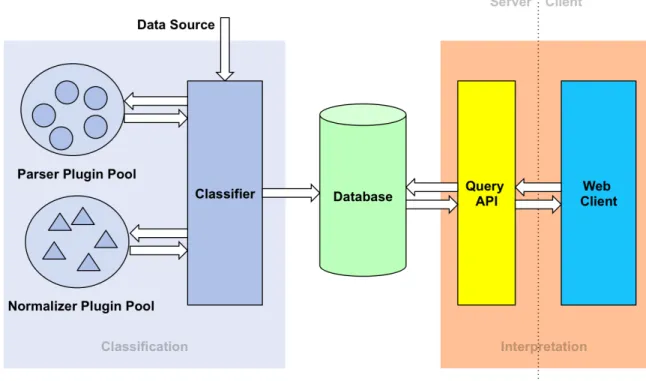
With the user persona in place, we then designed the overall architecture of the project. We knew the tool had to provide an extensible framework so that any provenance data source could be used. Additionally, we knew that the user needed to interact with the tool through a web browser. When thinking about the different responsibilities NavPro needed to have, we broke it down into three major components: classification, database, and interpretation.
The data retrieved from provenance-aware systems would be sent to our classifier, which would use the appropriate parser to extract the system calls and their arguments from the raw data. Once those system calls were turned into human-readable actions by the appropriate normalizer; they would be stored in the database so that they could be queried and visualized for interpretation as seen in Figure 5.
Figure 5: NavPro Architecture
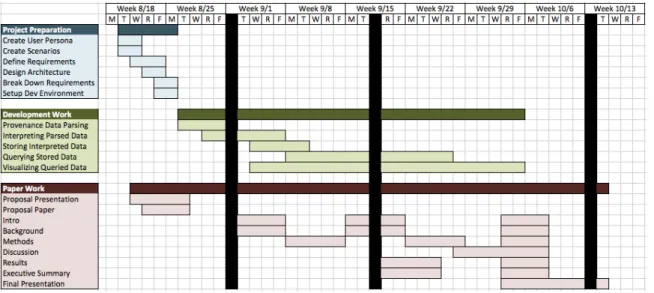
Finally, we organized a timeline that depicted our plans regarding development and paper work. We realized early that the interpretation would require the majority of out development time, so we made sure to allocate the most time for that part of the product. The work for the paper was also very spread out so that we did not have to end
up rushing to finish it toward the end of our time at Lincoln Laboratory. The full timeline for our project is shown in Figure 6.
Figure 6: Project Timeline
3.2 Classification
The classification component of NavPro turns raw provenance data into objects that can be queried and visualized by the web application. The raw data may be binary data, strings, serialized data, or any other format future provenance-aware systems may use. Because we did not know all of the possibilities during the timeframe of the project, we needed to provide a flexible way to accept data from different sources.
To do so, we created a parser “plugin pool” that is a directory the classifier observes at runtime; it automatically loads any new parsers/normalizers that are placed in the plugin directory both at startup and during execution. This allows the server to always be running, even when new hosts are being added to a network that collect provenance data in a different format.
Similarly, we created a plugin pool for normalizers, which take the system calls and their arguments (turned into action objects by a parser) and analyze them to create human-readable user activity. Examples of these activities include creating a file,
changing a file’s permissions, and sending data through a network. The full parser and normalizer API can be seen in Appendix A – .
Because the server may receive data from thousands of hosts, it uses multithreading to retrieve and process data. We also designed the parser and normalizer interfaces so that they iterate through one action at a time. Originally, we were processing the data in the chunk sizes they were sent in, but we quickly noticed that this could cause memory concerns.
To prove that our design is effective, we created our own normalizer and parser for LPM data. The only provenance-aware system we were provided with by Lincoln Laboratory was a virtual machine running LPM, so we needed to collect its data and write a parser and normalizer specific to its data [5].
3.2.1 Retrieving Provenance Information
The LPM kernel allows provenance data to be collected by storing it in a “relay buffer” that a daemon can access at any time. For our server to retrieve this data, we needed to develop a daemon that would run on this Linux machine and forward all of the provenance data to our server. We create a daemon, called “sprovd”, to poll this relay buffer every five seconds, create a connection with the NavPro server, send all the data it read, and close the connection. It was necessary to poll so frequently because the kernel would crash and stop collecting data if the buffer overflowed. With default settings, the buffer had a capacity of 64MB.
Because there may be many different data sources that require unique parsers and normalizer to be classified, we needed to make sure the data source identified itself so that the right plugins could be selected. To solve this problem, we designed a protocol that all NavPro input sources must conform to. The messages the NavPro server expects begin with a string identifier ending with a null character, such as “LPM HiFi”. This is followed by a string hostname ending with a null character. Finally, the raw provenance data is sent.
All parsers and normalizers are required to implement a boolean method
canProcess(String s) that takes in the string identifier and tells the classifier whether
guarantee to that all provenance events are received in chronological order, allowing multi-system-call actions to be derived.
3.2.2 Parsing Raw Data
For LPM, the raw data is binary C structs (defined in Appendix A – ) that cannot easily be manipulated in Java. We were provided with a C program pcat that translates
these C structures into strings. To reduce development costs, we leveraged pcat instead
of writing reinventing the wheel. With that said, we did not want to add any processing overhead to the client machines collecting the provenance data, so we decided to use this program code in our LPM parser plugin.
To effectively leverage this code, we needed to use the Java Native Interface (JNI). This is accomplished by receiving the input stream from the classifier, loading in a library (contained in the JAR) that has the C code, calling the methods through JNI and storing the string response.
Once the input source for the parser is successfully set, a classifier thread begins asking it for one system call at a time from the raw data. The LPM parser iterates over the string (throwing away the parts it has processed) and sends an object representation of a system call back to the classifier so that it can be normalized. Once the parser runs out of actions it will notify the classifier so that it can start the next thread to process more events from the host sending LPM provenance data.
3.2.3 Normalizing Actions
One of the biggest challenges of this project was converting operating system API calls into human-readable actions. There was very little documentation explaining what the data meant at a low level, and none explaining what it meant at a high level. Once we were able to connect our server to our VM running the LPM kernel, we started recording what system calls were invoked (with what parameters) when we stepped through simple actions like creating and deleting files. When looking through the thousands of calls per second we were receiving, it was nearly impossible to tell which calls were caused by our actions.
An example of one of these system calls is link. This function makes a hard link
the containing folder, and the new name for the hard link. Alone, these parameters tell us nothing that a network administrator would care about. Inode numbers are reused constantly and knowing a filename does not give enough context to derive a full path for the file involved. We do not know what user created this hard link, what file was executed to do so, or whether this is the first hard link to the inode.
We ended up creating a “knowledge cache”, which is effectively a persistent hash map that normalizers can use to store what they currently know about a given host. This allows us to associate user IDs with usernames, usernames with processes, inodes with file paths, and much more metadata we can use to derive meaning from these actions that alone contain very little information.
As we were slowly able to combine our use of the knowledge cache with our understanding of what each system call did, we defined high-level user actions to insert into the database so that they can later be searched and visualized. These human-readable actions include (see Appendix A – for the resulting derivations of each of these actions):
• create a file • delete a file • access a file
o read from a file o write to a file o execute a file • change file permissions • send data on a socket • receive data on a socket
Every one of these actions has a host, user, process, and file associated with it that are understandable for someone who is not familiar with provenance data. The host is the computer hostname, the user is the username, the process is the file executed that caused the action, and the file contains the full path to its hard links at the time. Every event also has a timestamp to keep its time context in the database. Having objects structured this way in the database allows them to be easily queried based on what the network administrator knows entering his forensic analysis process.
3.3 Database
Once the provenance data is classified into discrete events, it needs to be stored in a queryable form for later analysis. This is accomplished by leveraging a database management system alongside a set of our own Java interfaces that work with the database. By storing the events in a database, we can craft performant queries that allow us to quickly present the data in a visualization that empowers the user to derive meaning from the provenance. This section will elaborate on the reasoning behind our decisions regarding provenance events storage, as well as an overview of the architecture that powers the querying structure of NavPro.
3.3.1 Technology Comparisons
The database technology that was chosen to power NavPro was MySQL, a popular open source relational database that implements the Standard Querying Language (SQL) [16]. MySQL has the benefit of being well documented and supported through a vibrant development community. It also has the capability to scale while maintaining high performance. Above all, MySQL is a solution that we are familiar and comfortable with. In such a short development timeframe, it is important to rely on technologies that are easily deployed to fulfill the requirements of the project in a timely manner.
Alternatives to MySQL that were explored include other SQL databases and alternative NoSQL systems. Potential competing SQL databases are PostgresSQL and Oracle. These databases have benefits, drawbacks, and intricacies of their own, but overall operate on the same premise as MySQL. Due to this, it made sense to go with the SQL implementation that we are most familiar with over other SQL databases.
In contrast, comparing NoSQL systems against MySQL required a deeper understanding of provenance data that will be stored and the performance requirements that must be met by NavPro. There is a lot of diversity in the NoSQL space – the databases differ from each other greatly. Potential candidates include MongoDB, a document-based database, Accumulo, a highly distributed key-value store based off of Google’s BigTable, and Cassandra, a similarly highly distributed database developed by Facebook [17][18]. The primary benefit of using a NoSQL system is improved scalability, concurrency, and performance over large sets of data. Depending on the size
of the provenance events data and the types of queries being executed, a NoSQL solution would potentially outperform a MySQL implementation.
In the end, we decided on MySQL because we felt that the ability to quickly deploy and use MySQL outweighed potential future performance benefits of a NoSQL database. However, to facilitate easy switching to a NoSQL setup, we designed the Java database interface in such a way that alternatives can be easily switched in for the existing MySQL setup.
3.3.2 Database Schema
Three separate databases are utilized to support NavPro: knowledge cache, user database, and events database.
The knowledge cache is used by the Provenance Classifier to provide a way for the normalizer to store information for later use. More details on the use of the knowledge cache can be found in Section 3.2.3 and Appendix A – Parsers and Normalizers. The knowledge cache is kept in a separate database from the user database and events database so that the normalizers can access it during the classification process without impacting the performance of the user and events databases. In the knowledge cache database, a separate table is created for each host that sends provenance data to the classifier. The schema of each of these tables can be seen in Table 2.
Field Name Field Type Other Info
entry_key VARCHAR (512) NOT NULL, INDEX
entry_value VARCHAR (2048) NOT NULL
Table 2: Knowledge Cache Schema
The user database contains all user-specific data. This includes information on alerts, notifications, bookmarks, and user profiles. These features are extended functionality that went beyond the original scope of the project. We elaborate on the features in the
Results section. This data is kept in a separate database from the events database due to the nature of the data and the frequency with which the data will be accessed. The user data is small compared to the events data, and as such it would potentially better benefit from a SQL database. Using multiple databases allows for the user database to be implemented using a different database technology than the events database. Additionally, the information in the user database, specifically the alerts and notifications data, is often accessed. Keeping the user and events databases separate helps prevent the events database from being slowed down due to a flood of requests for user data. The user database contains the following tables:
• Users: The user profiles that are used to log in to NavPro. The schema of the users table can be seen in Table 3.
• Bookmarks: The user-specific bookmarks set on specific views in NavPro. The schema of the bookmarks table can be seen in Table 4.
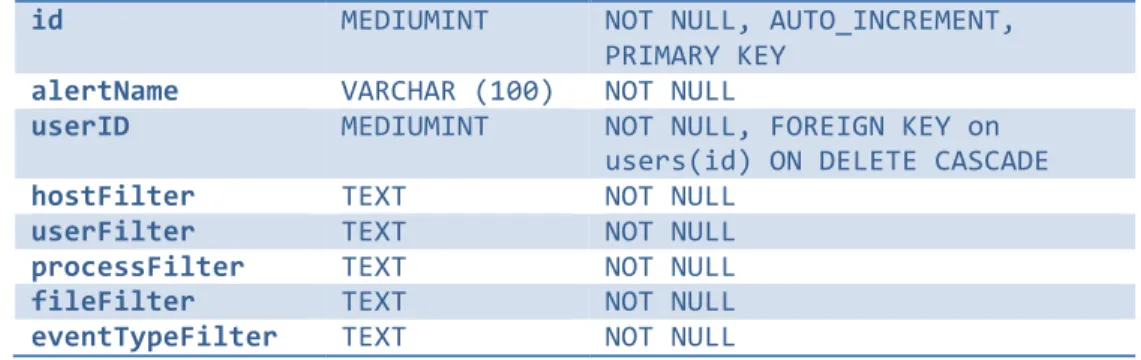
• Alerts: The user-specific alert triggers that notify users when an event occurs matching the trigger’s filters. Table 5 contains the alerts table schema.
Field Name Field Type Other Info
Id MEDIUMINT NOT NULL, AUTO_INCREMENT,
PRIMARY KEY
userName VARCHAR (100) NOT NULL, UNIQUE
Table 3: Users Table Schema
Field Name Field Type Other Info
id MEDIUMINT NOT NULL, AUTO_INCREMENT,
PRIMARY KEY
bookmarkName VARCHAR (100) NOT NULL
userID MEDIUMINT NOT NULL, FOREIGN KEY on
users(id) ON DELETE CASCADE
hostFilter TEXT NOT NULL
userFilter TEXT NOT NULL
processFilter TEXT NOT NULL
fileFilter TEXT NOT NULL
eventTypeFilter TEXT NOT NULL
timeLowerBound VARCHAR (100) NOT NULL
timeUpperBound VARCHAR (100) NOT NULL
tickCount VARCHAR (100) NOT NULL
Table 4: Bookmarks Table Schema
id MEDIUMINT NOT NULL, AUTO_INCREMENT, PRIMARY KEY
alertName VARCHAR (100) NOT NULL
userID MEDIUMINT NOT NULL, FOREIGN KEY on
users(id) ON DELETE CASCADE
hostFilter TEXT NOT NULL
userFilter TEXT NOT NULL
processFilter TEXT NOT NULL
fileFilter TEXT NOT NULL
eventTypeFilter TEXT NOT NULL
Table 5: Alerts Table Schema
• Notifications: The user-specific notifications that are generated by the alert triggers. The schema of the notifications table can be seen in Table 6.
Field Name Field Type Other Info
id MEDIUMINT NOT NULL, AUTO_INCREMENT,
PRIMARY KEY
alertID MEDIUMINT NOT NULL, FOREIGN KEY on
alerts(id) ON DELETE CASCADE
description TEXT NOT NULL
datetime DATETIME(3) NOT NULL
unread BOOLEAN NOT NULL
Table 6: Notifications Table Schema
The events database stores the normalized provenance events that are output by the classifier. Currently, the database is a MySQL database that contains one table. This is because we envision the database eventually taking the form of an Accumulo, or other similar NoSQL, database that would have a single big table. The schema of the events table can be seen in Table 7.
Field Name Field Type Other Info
description VARCHAR(512) NOT NULL
descriptionDetails VARCHAR(2048) NOT NULL
hostName VARCHAR (512) NOT NULL
userName VARCHAR (512) NOT NULL
processName VARCHAR (512) NOT NULL
processDetails VARCHAR(2048) NOT NULL
fileName VARCHAR (512) NOT NULL
fileDetails VARCHAR (2048) NOT NULL
fileIdentifier VARCHAR(512) NOT NULL
datetime DATETIME(3) NOT NULL,
INDEX
Table 7: Event Table Schema
An additional table is used to store all of the known types of events that can occur. The schema of this event types table can be seen in Table 8.
Field Name Field Type Other Info
eventType VARCHAR(512) NOT NULL, UNIQUE
Table 8: Event Types Table Schema
3.3.3 Java Database Interface Architecture
We developed a set of Java interfaces to allow for easy interaction with the knowledge cache, user database, and events database in the classifier and query API. This set of interfaces also allows the database implementation to be switched out without modifying non-database specific code.
The database architecture centers on three interfaces: IKnowledgeCacheProvider, IProvenanceUserDatabase, and IProvenanceEventsDatabase. Together, these
interfaces define the methods that a database must make available to be used as a knowledge cache, user database, or events database, respectively. A full description of these API interfaces can be found in Appendix B – Database APIs.
With these methods, a Java consumer of any of these interfaces is able to fully interact with the knowledge cache, user database, or events database. Initially, only MySQL implementations of these interfaces are provided. Additional options, such as an Accumulo version, can be easily added by meeting the contracts described in these interfaces.
This architecture allows for the rest of NavPro to be developed independently of the database. By providing uniform interfaces for interactions with the database, future changes to the database will only affect the small amount of database-specific code present in the project.
3.4 Interpretation
Once the provenance event data has been stored, an interactive visualization is created that allows a user to gain meaningful insights from the data. Displaying this visualization is accomplished through a web application that queries a Tomcat-powered server-side query API. This API provides access to activity metadata (broad details on the
amount of activity occurring during time intervals) and actual event data. The web application displays the data it receives from these queries by leveraging existing JavaScript libraries such as d3.js and Bootstrap.js.
3.4.1 Server-Side Query API
The server-side query API provides an interface for a client to access information from the provenance event database. The API is powered by a Java servlet running on top of Tomcat. Tomcat provides the basic routing and load-balancing features necessary for a scalable web based project – allowing us to focus on writing our project-specific code. We chose a Java-powered server due to its platform-independent nature and our own personal comfort developing in Java.
Using the Java servlet, we created a RESTful API capable of handling multiple requests from different clients concurrently. This API provides access to the queries
made available through IProvenanceUserDatabase andIProvenanceEventDatabase.
A full list of these queries can be seen in Appendix C - Visualizer Query API. These queries are designed to support the specific visualizations that the web application needs to display to the user.
3.4.2 Client-Side Web Application
The client side web application is the culmination of the work being done by the architecture throughout the rest of NavPro. Once the provenance events are classified, stored, and query-able, the web application must display the data in a way that empowers the user to extract meaning from the provenance.
Deciding on a data visualization that would be capable of doing this was done through an iterative design and prototyping process. In this process, we first identified a few key scenarios that a user would want to achieve with NavPro. Then, we thought about how a user would be able to complete these scenarios when first approaching the tool without any knowledge other than a time period. We refined the results of these initial
brainstorming sessions by consulting with other members of the project, such as Jeff Diewald and Tom Moyer (Group 58). More information on the results of this
Results section.
By taking a user-first and scenario-centric approach to the design process, we were able to keep ourselves focused on creating features that added immediate value to the user. This kept us from pursuing superfluous visualizations that did not add important meaning. By narrowing the focus of our visualization, we were able to create a polished and stable product that focuses on solving a few key scenarios well.
Powering the visualization is a JavaScript library known as d3.js, an established library that supports visualizing data in interactive ways [19]. d3.js allows us to rapidly iterate on our prototypes by using existing library functionality to implement key features of the visualization. Additionally, d3.js supports advanced features such as data binding that make working with large amounts of data very fast and easy to code. Using a supported, and well-documented library such as d3.js greatly sped up development and allowed for additional visualization ideas to be prototyped and evaluated, leading to a better final visualization.
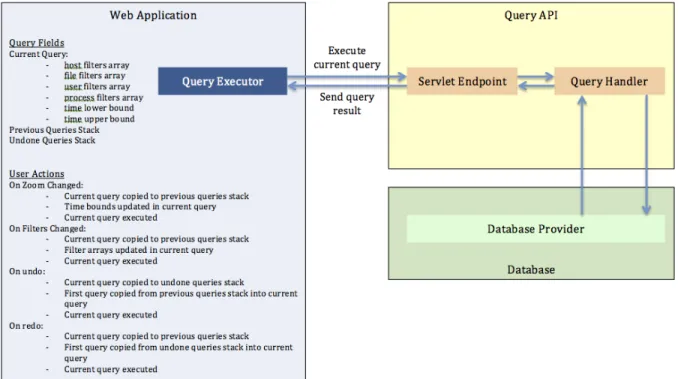
For the UI elements of our web application, we relied heavily on Bootstrap. Bootstrap solves some of the most challenging problems of web design – cross-browser compatibility and responsiveness – saving us valuable development time and helping us create a professional web application. We also utilized jQuery to allow for quick and easy DOM manipulation and to provide some of the animations used in the product. We used AJAX to make the web application responsive to user input while querying the server for more information. The AJAX request architecture supporting the functionality of NavPro can be seen in Figure 7.
4
Results
In this section, we discuss the results of our project. By following the process outlined in the Methods section, we created the NavPro product along with additional concrete accompanying deliverables. We speak in depth about these deliverables, and evaluate our performance based on the goals that were initially specified for the project. 4.1 NavPro Product
The NavPro product we created focused on 3 key components:
4.1.1 Data Analysis
In NavPro, data analysis is centered on taking the raw provenance data, parsing it into objects, and normalizing those objects into human understandable actions. By the end of our project, we were able to create a normalizer that derived the following human understandable actions from the LPM provenance data:
• create a file • delete a file • access a file
o read from a file o write to a file o execute a file • change file permissions
The derivations that led to these human-understandable actions can be found in Appendix A – Parsers and Normalizers. Each event captured from the LPM provenance data is tagged as one of these actions, allowing a user to query by action type. Due to technical restrictions with LPM, we were not able to include any socket-based actions.
To make these human-understandable actions useful to the user, we also were able to map the information we were given about users, processes, and files into human-understandable data. For users, LPM does not provide us with any details on who is performing what actions. Instead, LPM uses a provenance message called setid to
mapping of user IDs to usernames through our sprovd daemon and used this mapping to
derive what user was performing what actions.
For processes, the LPM provenance data provided us with a process ID instead of the actual process name. We were able to derive the process name by examining the forks and execs that led to the creation of the process. With this, we were also able to record the arguments that a process was run with, giving us additional context that was originally hidden in the provenance data.
For files, LPM provides the inode number of the file instead of the actual file name. This makes it difficult, if not impossible, for an analyst to derive meaning from file actions. To rectify this, we were able to track file creates and deletes to create our own knowledge cache mapping of inode numbers-to-file names. This allowed us to see what files were hard linked to the same source and track what files are accessed, executed, or deleted. An early limitation of this solution was that it was not able to display the file name for any files that were created before the machine became provenance-aware. This is because we would not have a mapping in the knowledge cache from which we could derive the file name.
As a workaround for this limitation, we created a program called spbang, a
modified version of an existing utility called pbang. This utility sends the NavPro
classifier server inode_alloc, link, and setattr provenance messages for every file on
a given unmounted partition. This allows us to create a full hierarchy of the partition’s file system in the knowledge cache. Without this hierarchy, files would be displayed in the form of: “(Partition GUID:Inode Number)/File Name”, which is less than helpful when performing forensic analysis. This feature was beyond the original scope of the project, but we were able to implement it regardless.
Additionally, spbang sets an extended attribute on the given partition that can be
used to identify the partition once it is mounted. With this extended attribute set, sprovd
is able to establish a mapping of extended attributes-to-mount points. This mapping is sent to NavPro along with the regular provenance data messages. By leveraging this mapping, we are able to track partitions as they are mounted and unmounted at runtime. This feature was also beyond the original scope of the project, but had to be implemented to work around a current limitation of LPM. Because of a different technical restriction
with LPM, we were not able to support this feature for files housed on temporary partitions, such as /tmp and /boot.
In addition to making sense of the LPM provenance data, we were able to optimize our classifier architecture and database schema in a way that reduced memory usage while not sacrificing time efficiency. In the classifier, we utilized an iterator pattern for retrieving actions from the parsers, which led to a marked memory usage improvement. With this change, the space efficiency of parsing the raw LPM data was improved from O(mn) to O(m), where n is the number of actions being parsed and m is the size of a single action.
In the database, we were able to specify the time field of an event as an index of the row, leading to a time efficiency improvement from O(n) to O(log(n)) where n is the number of events in the events table.
4.1.2 Visualization
Our initial visualization brainstorming sessions allowed us to create a first-pass tabular visualization, which can be seen in Figure 8.
With this first attempt, we were able to consult with other members of the project, such as Jeff Diewald and Tom Moyer (Group 58), to further refine and iterate on the visualization. Eventually, we decided upon using a chart-based visualization that displayed aggregate overall, user, process, and file activity. This visualization allows a user to identify interesting changes in levels of activity over time. The visualization can be seen in Figure 9.
Figure 9: Chart Based Visualization
We also experimented with implementing live update functionality for the chart visualization. With live update, the data shown in the charts would automatically change as time went by, always displaying the most up to date information if the user has not changed the time bounds. However, once we implemented this feature, we decided against its inclusion. We felt that it went against the theme of NavPro being a forensic tool, as opposed to a live monitoring detection tool. Additionally, the user experience of live update was jarring as the data was constantly changing without any clear explanation.
As well as the visualization, we created a filtering feature that allows a user to specify exactly what hosts, users, processes, files, and event types they are interested in. When a filter is applied, the visualization changes to display the activity that meets the requirements of the filters. Additionally, a user can modify the time span that they are
viewing, allowing the user to hone in on specific moments in time. The interface for adding and removing filters can be seen in Figure 10, while the filters alongside the charts can be seen in Figure 11.
Figure 10: Filter User Interface
Figure 11: Filters and Charts
Also visible in Figure 11 is the interface for modifying the time span that the user is viewing. A user can set the time span precisely using the boxes in the upper left corner of the interface, or they can zoom directly on the graph by drag-selecting a region. When the user selects a region on the graph, all of the graphs are zoomed to the selected time span. The user can undo and redo changes to the filter and time span options using the undo and redo buttons in the top left corner of the interface.
Once a user has refined the data that they are interested in to the point that only a couple hundred events match the criteria, a table is displayed alongside the chart visualization. This table allows for the user to see exactly what happened, allowing for more advanced analysis to take place. This table-chart view can be seen in Figure 12.
Figure 12: Chart Visualization with Table Visualization
The table displays the information in the human understandable form that we were able to normalize the provenance data to. Additional information, such as full file path or process arguments, can be found in some table cells by clicking the blue information icon in the right of the cell, as seen in Figure 13.
Figure 13: Viewing Table Cell Details
4.1.3 User Features
In addition to the visualization features, we implemented convenience features such as profiles, bookmarks and alerts. Profiles allow users to create their own personal profiles that can contain user specific settings. This feature was initially outside of the scope of our project, but was completed to provide better bookmarks and alerts experiences. With this feature, a user is first prompted to select a profile before they can
use NavPro. Once they select a profile, their selection is remembered until they logout. Currently, an authentication method is not included with this feature and is instead a future consideration for how to further enhance NavPro. The interface for choosing a profile can be seen in Figure 14, while the interface for logging out and deleting a profile can be seen in Figure 15.
Figure 14: Profile Selection
Figure 15: Profile Dropdown
Bookmarks allow a user to save a set of filters to be returned to later. Bookmarks are saved specific to a profile and are persisted across both machines and sessions. This means that a user can login to their profile on another machine and have access to all of their bookmarks, while not seeing other user’s bookmarks. The bookmarks feature was originally outside of the scope of this project. The interface for adding a bookmark can be seen in Figure 16, while the interface for accessing and removing bookmarks can be seen in Figure 17.
Figure 16: Adding a Bookmark
Figure 17: Accessing and Removing Bookmarks
Alerts allow a user to specify a set of filters that they wish to be alerted about – that is, when an event occurs that meets those filters, the user will be notified. This allows a user to identify interesting activity once and be alerted whenever that activity occurs again in the future. Like bookmarks, alerts are profile-specific. When a user accesses their profile from another machine, they will have access to all of their alert triggers and notifications. The interface for modifying the alert triggers settings can be seen in Figure 18. The interface for viewing alert notifications can be seen in Figure 19.
![Table 1: Classic Linux Permissions [27][28]](https://thumb-us.123doks.com/thumbv2/123dok_us/9958709.2488377/14.918.270.650.479.762/table-classic-linux-permissions.webp)
![Figure 1: Data provenance relationships as defined by OPM [3]](https://thumb-us.123doks.com/thumbv2/123dok_us/9958709.2488377/17.918.140.779.109.371/figure-data-provenance-relationships-defined-opm.webp)
![Figure 2: Internet map visualization [12]](https://thumb-us.123doks.com/thumbv2/123dok_us/9958709.2488377/21.918.137.785.109.460/figure-internet-map-visualization.webp)