Social Network Analysis
for Business Process Discovery
Cl´audia Sofia da Costa Alves
Dissertation for the degree of Master in Information Systems and Computer Engineering
Supervisor: Prof. Doutor Diogo R. Ferreira
President: Prof. Alberto Manuel Rodrigues da Silva Vogal: Prof. Miguel Leitao Bignolas Mira da Silva
Acknowledgments
T
o my family, especially my parents, who have always supported me during my aca-demic carrier. To Prof. Diogo Ferreira for his excellent assistance and availability to help. The sup-port and guidance I received throughout this year greatly improved the value of this dissertation.To ´Alvaro Rebuge ,a member of our research group, for the exchange of ideas and knowl-edge that were really helpful for the development of the case study.
Last but not the least, to all my close friends, colleagues and all the others that marked my life course during or before this master degree a special compliment is due.
Abstract
T
he organizational perspective of Process Mining is a valuable technique that al-lows discovering the social network of an organization. By doing so, provides means to evaluate networks by mapping and analyzing relationships among people, teams, departments or even entire organizations. However, when analyzing networks of large size, Process Mining techniques generate highly complex models, usually called ”spaghetti models”, that may be confusing and difficult to understand.In this dissertation we present an approach that aims to overcome this difficulty by pre-senting the information in a way that can be easily read by users. Clustering techniques adopting a divide-and-conquer strategy are applied for this purpose as they make pos-sible the user to visualize and analyze the network in different levels of abstraction. Our approach also makes use of the concept ofModularity, indicating which iteration of the clustering algorithm best represents different user groups in the social network.
This approach was implemented in the ProM framework and all the experiments were performed in that environment. Taking into consideration the results achieved for a real-world case study and the results of several experiments, we reached the conclusion that the approach is capable of dealing with complex logs and that the Modularity concept provides a good hint of which group of clusters best represents the user groups in a social network.
Keywords: Process Mining , Social Network Analysis , ProM Framework , Cluster-ing , Agglomerative Hierarchical ClusterCluster-ing , Organizational ModellCluster-ing , Communities , Modularity
Resumo
A
p erspectiva organizacional da extracc¸˜ao de processos ´e uma t´ecnica importante quepermite descobrir a rede social de uma organizac¸˜ao. Esta t´ecnica fornece meios para avaliar redes sociais atrav´es do mapeamento e da an´alise das relac¸ ˜oes existentes entre pessoas, equipas, departamentos ou at´e mesmo organizac¸ ˜oes inteiras. No entanto, quando se procede a an´alise de redes sociais de grandes dimens ˜oes, as t´ecnicas actuais geram modelos muito complexos. Com o objectivo de superar esta dificuldade, apre-sentamos neste trabalho uma abordagem capaz de representar grandes quantidades de informac¸˜ao de forma simples e de modo a facilitar a an´alise e a compreens˜ao dos dados. As t´ecnicas de clustering podem ser usadas para este prop ´osito uma vez que permitem analisar a informac¸˜ao da rede a diferentes n´ıveis de abstracc¸˜ao. A nossa abordagem adopta um algoritmo de Clustering Hier´arquico Aglomerativo. O conceito de Modular-idade foi tamb´em adoptado com o objectivo de determinar qual a iterac¸˜ao do algoritmo que melhor representa as comunidades existentes na rede. A abordagem foi implemen-tada na ferramenta ProM. Para demonstrar a sua aplicac¸˜ao foi realizado um caso de es-tudo real, e tendo em considerac¸˜ao os resultados obtidos conclu´ımos que a abordagem ´e capaz de lidar com logs complexos e que o conceito de modularidade realmente fornece um ideia de qual o grupo de comunidades que melhor representa os grupos sociais da rede.Palavras-Chave: Extracc¸˜ao de processos , An´alise de Redes Socias , Ferramenta ProM , Clustering , Clustering Aglomerativo Hier´arquico , Modelac¸˜ao Organizacional , Comu-nidades , Modularidade
Contents
Acknowledgments iii Abstract v Resumo vii 1 Introduction 2 1.1 Process Mining . . . 2 1.2 Motivation . . . 4 1.3 Document Structure . . . 52 Mining the Organizational Perspective 7 2.1 Deriving social networks from event logs . . . 7
2.2 Techniques for Social Network Mining . . . 9
2.2.1 Social Network Miner . . . 10
2.2.2 Organizational Miner . . . 11
2.2.3 Role Hierarchy Miner . . . 11
2.2.4 Semantic Organizational Miner . . . 13
2.2.5 Staff Assignment Miner . . . 13
2.3 The ProM Framework . . . 13
2.4 Conclusion . . . 15
3 Social Network Analysis 17 3.1 Social Network Analysis (SNA) . . . 17
3.2 SNA Measures . . . 18
3.2.1 Measures for an individual level. . . 18
3.2.2 Measures for the network level . . . 19
3.3 Finding community structures in networks . . . 20
3.3.1 Traditional Approaches . . . 21 3.3.2 Recent Approaches . . . 23 3.4 Conclusion . . . 24 4 Proposed Approach 27 4.1 Motivation . . . 27 4.2 Proposal . . . 28
4.2.1 Application of Agglomerative Hierarchical Clustering in SNA . . . 29
4.2.2 Displaying social networks . . . 32
4.3 Conclusion . . . 34
5 Implementation in ProM 37 5.1 Extracting information from Log file . . . 37
5.2 Agglomerative Hierarchical Clustering . . . 40
5.3 Modularity . . . 43
5.3.1 Definition of Modularity . . . 43
5.4 Working Together vs. Similar Tasks . . . 46
5.5 Conclusion . . . 49
6 Case Study 51 6.1 Similar Tasks . . . 53
6.2 Working Together . . . 54
6.2.1 First Approach - ”‘Who works with whom?”’ . . . 54
6.2.2 Second Approach - ”‘Which specialties work together?”’ . . . 56
6.3 Relationship to the Business Process . . . 62
6.4 Conclusion . . . 63
7 Conclusions 67 7.1 Main Contributions . . . 67
7.2 Future work . . . 68
Bibliography 70
A Log File - insuranceClaimHandlingExample.mxml 74
B User Manual for the Social Network Mining Plug-in 81
List of Tables
2.1 Table representing the content of a fragment from an event log . . . 8 5.2 Table representing the information in insuranceClaimHandlingExample.mxml
event log. . . 39 5.3 Information extracted from the Log file
(insuranceClaimHandlingExam-ple.mxml). This matrix shows the existing links among vertices. . . 40 5.4 Adjacency matrix, of insuranceClaimHandlingExample.mxml used to
com-pute modularity. . . 44 5.5 Originators’ Degree of insuranceClaimHandlingExample.mxml social
net-work. . . 45 5.6 This table shows how many times each originator performs each task. . . 47 5.7 This table shows how many tasks two originators perform in common. . . 49 6.8 Characteristics of the three Hospital Log Files. . . 52
List of Figures
1.1 Business Process Management life cycle showing the three phases where
process mining is focused (dark blue circles) . . . 3
2.2 Doing Similar Tasks as displayed in ProM 5.2. . . 10
2.3 Hierarchical clustering result represented as a dendogram (Snapshot from ProM v5.2). . . 12
2.4 Organization model derived from the dendogram. Ovals and the pen-tagons represent actors/originators and organizational entities respectively. (Snapshot from ProM v5.2) . . . 12
2.5 Overview of the ProM Framework (adapted from [27]) . . . 14
2.6 MXML format (adapted from [8]) . . . 15
2.7 MXML snapshot . . . 16
3.8 Network with community structure. In this case there are three commu-nities (represented by the dashed circles) composed by densely connected vertices. Links of lower density (depicted with thinner lines) are the ones that establish a connection between the different communities . . . 21
4.9 Comparison of the different phases supported by the ProM and other soft-war packages during a social network analysis . . . 28
4.10 Output of Prom 5.2 using the Working Together mining tool applied on a small network. In this case we used DecisionMinerLog.xml supplied by ProM 5.2 . . . 31
4.11 Output of Prom 5.2 using the Working Together mining tool applied on a large network. In this case we used outpatientClinicExample.mxml sup-plied by ProM 5.2. It is relevant to say that the mining result image is just a tiny part of the real network. . . 32
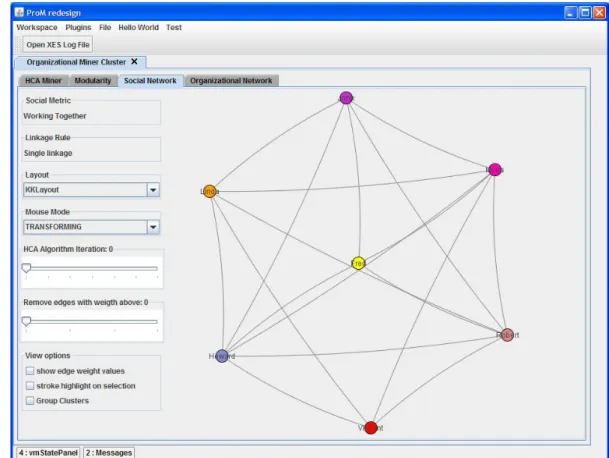
4.12 Social Network of the insuranceClaimHandlingExample.mxml. This screen-shot corresponds to the 1st iteration of Working Together AHC Algorithm, using tie break with modularity. At this point each cluster corresponds to a single originator. . . 33
4.13 Matrix showing the relationships among originators of the social network depicted in Figure 4.12 . . . 34
1
5.14 Social Network of the insuranceClaimHandlingExample.mxml. This screen-shot corresponds to the 3rd iteration of Working Together AHC Algo-rithm, using tie break with modularity. Here the relationships among originators of the social network are represented. Originators from the
same cluster are represented by the same colour. . . 41
5.15 Social Network of the insuranceClaimHandlingExample.mxml. This screen-shot represents the organization units at the 3rd iteration of Working To-gether AHC Algorithm, using tie break with modularity . . . 42
5.16 Modularity Chart. . . 47
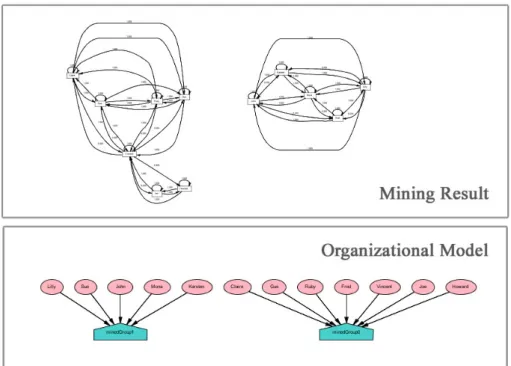
5.17 Similar Tasks Algorithm - Social Perspective . . . 48
5.18 Similar Tasks Algorithm - Organizational Perspective . . . 48
6.19 Similar Tasks - Modularity Best Case. . . 54
6.20 Similar Tasks - Modularity Worst Case. . . 55
6.21 Social network of the event log with 12 days. This is the output of the iteration with the highest modularity of Average Linkage with tie break. . 57
6.22 Matrix from log 12 days showing relationships among nurses . . . 58
6.23 Social network of the event log with 12 days. This is the output of the iteration with the highest modularity of Complete Linkage with tie break. GREEN = Emergency, BLUE = Pediatrics; PINK = Obstetrics/Gynecol-ogy, RED = Orthopedics, ORANGE = Emergency relay, DARK PURPLE = General surgery, LIGHT PURPLE = Neurology and BROWN = Internal Medicine . . . 59
6.24 Social network of the event log with 14 days. This is the output of the iteration with the highest modularity of Single Linkage. . . 61
6.25 Social network of the event log with 14 days. This is the output of the iteration with the highest modularity of Complete Linkage. . . 61
6.26 Emergency Department Business Process . . . 63
7.27 Matrix view of the sub-network fromOrganization Unit 0 from iteration with the highest modularity of Average Linkage with tie break from 12 days event log. . . 68
7.28 Graph view of the sub-network from Organization Unit 0 from iteration with the highest modularity of Average Linkage with tie break from 12 days event log. . . 69
Chapter 1
Introduction
N
owadays we live in a very competitive market, where customer’s needs and expec-tations are always changing. Industry requirements are also changing and many mergers and acquisitions are taking place. All these permanent changes are a challenge for organizations. To gain a competitive advantage, organizations must revise, change and improve their strategic business processes, in a fast and efficient way, in order not to lose market share.To optimize a business process, organizations must understand how the process is being performed, which usually involves a long period of analysis, including interviews with all the persons responsible for a given part of the process.
The use and proliferation of Process-Aware Information Systems cite2 (such as ERP, WfM, CRM and SCM systems) has led the way to a more efficient type of method to study the execution of processes, called process mining [17]. These systems typically record events carried out during a business process execution on event logs and the analysis of those logs can yield important knowledge to improve quality of the organi-zation’s services and processes. Here is where process mining comes in.
In next Sections we will explain how Process Mining concept appeared and what it its purpose.
1.1
Process Mining
Business Process Management (BPM) systems are an effort to help organizations man-aging process changes that are required in many areas of the business [3]. These systems have been widely used and are the best methodology so far. Ideally, they should pro-vide support for the complete BPM life-cycle (Fig. 1.1): (re)design, modelling, execution, monitoring, and analysis of processes. However, existing BPM tools are unable to sup-port the full life-cycle. These tools provide strong supsup-port in design, configuration and execution phases. Nevertheless, process monitoring, analysis and redesign phases re-ceive limited support[18]. One reason to say this lays in the fact that the analysis phase is focused in processes performance, being the major goal identifying their weaknesses. Unfortunately, this phase is limited to simple performance indicators, such as flow time.
1.1. PROCESS MINING 3
Figure 1.1:Business Process Management life cycle showing the three phases where process mining is focused (dark blue circles)
For a further analysis, i.e., identifying structures or patterns in processes and organiza-tions, BPM systems require human intervention because these systems are not able to highlight weaknesses automatically, much less suggest improvements[18]. Therefore, the re-design phase is affected, because has no information to be able to suggest alterna-tives for the design phase.
Besides this problem, there is no interoperability between some of the phases, i.e., some of the results generated by one of the phases, cannot be used as an input by the next phase of the life cycle, and requires human intervention to interpret, map and re-introduce the information in the correct format on the next phase[18]. Process mining plays a very important role in trying to fulfil these gaps by giving support to the life cycle phases with event logs information.
Providing a bottom-up approach, process mining techniques can be used to support the redesign and diagnosis phases by analyzing the processes as they are being executed. Process mining requires the availability of an event log. In effect, event logs are widely available today. They may originated from all kinds of systems, ranging from enterprise information systems to embedded systems. Process mining is a very wide area as it can be applied in fields such as: hospitals, banks, embedded systems in cars, copiers, and sensor networks [17, 18, 21].
Process Mining Perspectives
Process mining research can be focused in many fields/perspectives, but three of them deserve special emphasis: (1) the process perspective (”‘How?”’), (2) the organizational perspective (”‘Who?”’) and (3) the case perspective (”‘What?”’)[17, 21, 27]. Following in a explanation of each one.
4 CHAPTER 1. INTRODUCTION
1. Process perspectivefocuses on the control-flow, i.e., the ordering of activities and the goal here is to find a good characterization of all the possible paths, e.g., expressed in terms of a Petri net.
2. Organizational perspectivefocuses on the resources, i.e., which performers are in-volved in the process model and the way they are related. The main goals are: structure the organization by classifying people in terms of roles and organiza-tional units; and show relationships among performers.
3. Case perspectivefocuses on properties of cases. Cases can be characterized by their paths in the process or by the values of the corresponding data elements, e.g., if a case represents a supply order it is interesting to know the number of products ordered.
In each of the above perspectives, there are three orthogonal aspects: (1)discovery, i.e., generates a new model based on event logs information; (2)conformance checking, i.e., ex-poses the differences between some a-priori model and a real process model constructed based on an event log; and (3)extension, i.e., an a-priori model is enrich and extended with new aspects and perspective of an event log [23]. Therefore, all researches in the Process mining can be classified according to two dimensions: the type of the mining and the perspective. This dissertation focuses on the discovery aspect of the Organizational perspective.
1.2
Motivation
Several tools of process mining analysis are available in the market, although only few of them support all Process Mining perspectives. After analyzing some of the available tools in the market, we have came to the conclusion thatProM1(an extensible framework for process mining) is one of the most complete tools.
However ProM is a powerful tool, when analyzing organizational perspective of net-works with huge dimensions, we are faced with some challenges. The main reasons for these challenges are basically two: 1) the deficient representation of data by ProM. This framework uses a very rudimentary tool to represent graphically huge amount of data, becoming very challenging to the user to analyze and explore the graphs that rep-resent the network; 2) ProM is only able to map relationships between two individuals, it cannot map relationship among communities, teams or groups.
Therefore, the main goal of this dissertation is to develop a new technique capable of identify communities in networks, i.e., sub-groups in the networks in which internal connections are dense, and external are sparser. Furthermore, we want to provide this divide-and-conquer approach with advanced visualization techniques that can show a progressive formation of the communities. To do so, we will implement a Agglomerative Hierarchical Clustering (AHC)that, will not only help us identifying communities inside the network, but it will also help us to simplify the representation and visualization of the big amount of data required in this kind of analyses.
1.3. DOCUMENT STRUCTURE 5
In this proposal we have also adopted a new concept -Modularity- which is a quality measure able to identify which group of clusters is the best and closer to the reality. After developing this new technique it will be implemented as a plug-in in ProM v6. The motivation, goals of our proposal will be further explained in Chapter 4 and Chap-ter 5.
1.3
Document Structure
This document is organized as follows: Chapter 2 focuses on the mining process of orga-nizational perspective. We broadly explain all the process, since the extraction of infor-mation from event logs, until the use of the inforinfor-mation to build meaningful sociograms. This chapter also introduces techniques developed for social network analysis. Finally we introduce ProM framework (the framework where we have implemented our pro-posed technique) and the standard format of event logs used in this framework.
Chapter 3 introduce concepts from Social Network Analysis (SNA), such as metrics used to analyze social networks and the most well-known algorithms to find communities in networks. The content of this chapter and Chapter 1 will be used as background information, needed to understand the following chapters.
Chapter 4 presents a superficial comparison between ProM and other existing software for social network analysis. This superficial comparison leads us to the motivation of our work. After pointing out the challenges, we will present the main goals of our proposal. Chapter 5 describes our plug-in and its implementation. We first explain how and which information is extracted from the log-file and generates the input of our plug-in. Then we explain how the input is treated all along the different stages of the plug-in.
Chapter 6 demonstrates the approach in a real-world case study where the goal was to validate the plug-in. In this chapter we also show and explain some features and outcomes of our plug-in.
Finally in chapter 7 we draw conclusions about this dissertation and suggest some future work.
This dissertation has two appendixes: Appendix A consists in a event log used as an example, that helps to explain how our technique was implemented in Chapter 5. Ap-pendix B consists in a user manual as an effort to better present our plug-in - Organiza-tional Miner Cluster plug-in.
Chapter 2
Mining the Organizational
Perspective
T
he goal of process mining is to extract useful information from event logs that record the activities an organization performs. As it was described in the previous chapter, process mining can extract information according three different perspectives:1. Process perspectivefocuses on the control-flow, i.e., the ordering of activities and the goal here is to find a good characterization of all the possible paths, e.g., expressed in terms of a Petri net.
2. Organizational perspective focuses on the resources, i.e., which performers are in-volved in the process model and the way they are related. The main goals are: structure the organization by classifying people in terms of roles and organiza-tional units; and to show relationships among performers.
3. Case perspectivefocuses on properties of cases. Cases can be characterized by their paths in the process or by the values of the corresponding data elements, e.g., if a case represents a supply order it is interesting to know the number of products ordered.
In this chapter we focus on the main topic of this dissertation: theorganizational perspec-tive, more precisely in the mining of this perspective. Mining is the method for distilling process description from a set of real executions (stored in event logs). We focus only on the descriptions extracted from log events that are helpful and valuable for the organiza-tional perspective. We will start by explaining from where, process mining extracts the information to derive social networks and finally we will explain which information is used to derive these social networks.
2.1
Deriving social networks from event logs
Since the past few years Process-Aware Information Systems (such as ERP, WFM, CRM and SCM systems) have suffered a high proliferation which has lead the way to a more
8 CHAPTER 2. MINING THE ORGANIZATIONAL PERSPECTIVE
efficient type of method to study the execution of processes - Process Mining. These systems provide a kind ofevent logs, also known asworkflow logoraudit trail entry. In an event log all events executed during a business process execution are recorded and its analysis can yield important knowledge to improve the execution of processes and the quality of the organization’s services.
For all process mining technique, an event log is needed as input. Basically, an event log is the basis and the source that supplies all the information necessary to derive so-ciograms and proceed with this kind of analysis.
An event log is a set of events. Eacheventin the log is linked to a particulartraceand is globally unique (i.e., can not appear twice in the same event log).
Each event refers to an activity which is related to a particular trace and is recognized by an unique identifier and can have several properties associated, like: timestamp; the activity name;resourceorperformer, which is the person that performed the activity; and event typeof the activity, normally the type of an activity is classified as: start or complete. Thus an event may be denoted by (c, a, p) wherecis the case, ais the activity, andpis the person.
Atrace, also known ascase, represents a particular process instance and is a sequence of events such that each event appears only once.
To clarify notions mentioned above let us consider an example adapted from [26]. Con-sider the emergency treatment process in a hospital. Each case in this process refers to patient treatment in emergency. Examples of activities are triage, blood tests, consulta-tion of a specialist, take a scan, etc. The activities are performed by all kind of health-care professional, such as: doctors, nurses, radiologists, surgeons, etc. Example of an event may be taking a thorax scan to a patient by a radiologist at a given point of time. The event log for emergency treatment process will contain all events for this process. A more abstract example of an event log is shown in Table 2.1. In this example the event log is composed by two process instances and each trace consists of a number of events. For example, the first trace is composed by four events (1a, 1b, 1c and 1d) with different properties.
Trace Event Properties
Activity Resource Timestamp Type
1 1a A Mary 20-11-2007 08:00 start 1b A Mary 20-11-2007 08:13 complete 1c B John 20-11-2007 08:16 start 1d B John 20-11-2007 08:40 complete 2 2a A Angela 20-11-2007 09:30 start
Table 2.1:Table representing the content of a fragment from an event log
Now that we have explained carefully which information is stored in event logs, we are now able to explain the metrics that have been developed, to use the information to derive meaningful sociograms. Inside organizational perspective scope, some complex metrics have been studied. We identify four types of metrics that can be used to establish relationships between individuals: (1) metrics based on (possible) causality, (2) metrics based on joint cases, (3) metrics based on joint activities, and (4) metrics based on special
2.2. TECHNIQUES FOR SOCIAL NETWORK MINING 9
event types [25]. This metrics are possible because events are ordered in time, allowing the inference of casual relationship between activities and the corresponding performers. • Metrics based on (possible) causality monitor for individual cases how work moves among performers. Examples of such metrics are: handover of work and subcontracting.
We will explain in a short way which information from event logs is used in this metric. We shall consider Handover of Workmetric and the event log depicted by Table 2.1. Handover of Workdetermines who gives work to whom, and from the event log this information can be extracted from two subsequent activities in the same case. For example, incase1Mary starts and completesactivityA, and right next in the same case, John starts and completesactivityB. Thus we can assume that Mary has delegated or passed work to John.
• Metrics based on joint casescount how frequently two individuals are performing activities for the same case. The metric Working Togetheris an example of these. We will explain in a short way which information, from event logs, is used to make working together analysis. For example, the event log depicted by Table 2.1 we shall consider event1a(Trace1, A, Mary) and event1b(Trace1, B, John). Mary and John, despite of performing different activities, they perform activities in the same case, thus we can assume that they work together. This metric is explained further in the Section 2.2.
• Metrics based on joint activitiesdo not consider how individuals work together on shared cases but focus on the activities they do. One example of the application of this metric isSimilar Task Metric, which is also explained in section 2.2.
We will explain in a short way which information from event logs is used to make similar tasks analysis. Each performer has a profile which stores the frequency the performer executes each task. This metric determines the similarity of two performers based on the similarity of their profile. For example, in the event log depicted by Table 2.1 we can observe that Mary only performs activities of typeA, John only performs activities of typeBand Angela only performs activities of type A. So according to this, since Mary and Angela perform the same type of activities, they are more similar than Mary and John that have completely different profiles. • Metrics based on special event typesconsider the type of event. Using these
met-rics we obtain observations that are particularly interesting for social network anal-ysis because they represent explicit hierarchical relationships. One example of the application of this metric isReassignment metric, which is also explained in Section 2.2.
2.2
Techniques for Social Network Mining
This section discusses a set of existing mining techniques for social network analysis developed until nowadays. The techniques that we will introduce apply all the metrics discussed above.
10 CHAPTER 2. MINING THE ORGANIZATIONAL PERSPECTIVE
Figure 2.2:Doing Similar Tasks as displayed in ProM 5.2.
2.2.1 Social Network Miner
The main idea of this technique is to monitor how individual process instances are routed between actors. The technique provides five kinds of metrics to generate social networks [26]:
• Handover of work metric: This metric determines who passes work to whom. This information can be extracted from an event log finding subsequent activities in the same case (i.e., process instance), where the first activity is completed by one individual and the second one is completed by another individual.
• Subcontracting metric: This metric is similar toHandover of work metric. While in the previous one relationship between two individual is unidirectional, in this one is bidirectional. Considering a single case of an event log and two individuals, we know that individualisubcontracts individualj, when in-between two activities executed by individualithere is an activity executed by individualj.
• Working together metric: Two individuals work together if they perform activi-ties in the same case of an event log. This technique only counts how frequently individuals work in the same case.
• Similar task metric: All the techniques above are based on joint cases, this one is based on joint activities. The main idea is to determine who performs the same type of activities. To do so, each individual has his own profile based on how frequently they conduct specific activities. Then the profiles are compared to determine the similarity. An example of this technique is shown in Figure 2.2.
• Reassignment metric: The basic idea of this metric is to detect the reassigning of activities from one individual to another: if ifrequently delegates work toj but
2.2. TECHNIQUES FOR SOCIAL NETWORK MINING 11
not vice versa it is likely thatiis in a higher hierarchical thanj.
2.2.2 Organizational Miner
This technique works at a higher level of abstraction than the previous techniques. While the Social Network Miner works at the level of the individual, the Organizational Miner technique works at the level of teams, groups or departments. Actually, organizational miner has five kinds of metrics to generate organizational networks:
• Default Miner: It is simple algorithm that shows clearly the relationship between tasks and the originators (activities performers). Although this metric belongs to the organizational miner, it only derives a flat model, excluding all kind of cluster-ing.
• Doing Similar Tasks: This technique joins all the originators that perform similar task in the same group.
• Hierarchical Mining Clustering: On the contrary of the two previous techniques, this one derives a hierarchical model. This technique implements the Agglom-erative Hierarchical Clustering technique based on joint activities. It means that the clusters are determined according the activities that each originator performs. (Fig. 2.3) shows the dendogram derived from this technique. Through the dendo-gram, this technique allows us to derive flat or disjoint organizational entities by cutting the dendogram with a certain value. Figure 2.3 shows, by cutting the den-dogram using a cut-off of value 0,2698 we obtain three clusters. Figure 2.4 shows the organizational entities derived from this dendogram.
• Working Together: Opposing all the metrics mentioned above, this is a metric based on joint cases and not on joint activities. This technique helps identifying teams. It puts in the same group, all the originators that participate in the same cases. Figure 4.10 and Figure 4.11 are examples of the result of this technique. • Self Organizing Map (SOM): This algorithm is an unsupervised method that
per-forms, at the same time, a clustering and a non linear projection of a dataset. SOM is a neural network technique that arranges the data according to a low dimen-sional structure. The original data is partitioned into as many homogeneous clus-ters as units, in such way that close clusclus-ters contain close data points in the original space. In other words, similar cases are mapped close to one another in the SOM [2, 24].
2.2.3 Role Hierarchy Miner
This technique is similar to theDoing Similar Taskstechnique, however it takes the anal-ysis to a higher dimension - organizational dimension. This technique is also based on
12 CHAPTER 2. MINING THE ORGANIZATIONAL PERSPECTIVE
Figure 2.3: Hierarchical clustering result represented as a dendogram (Snapshot from ProM v5.2).
Figure 2.4:Organization model derived from the dendogram. Ovals and the pentagons rep-resent actors/originators and organizational entities respectively. (Snapshot from ProM v5.2)
2.3. THE PROM FRAMEWORK 13
joint activities and the main idea is sustained in the profile concept, which determines the subset of tasks performed by each actor in the network. This technique can generate a role hierarchybased on the different activities performed by actors. A directed arrow between two actors/groups indicates that the actor/group at the base of the arrow can do at least the activities performed by the actor/group at the arrow head [15].
2.2.4 Semantic Organizational Miner
The aim of this technique is to discovergroups of usersthat work together based on task similarity. Tasks are considered to be similar whenever they areinstances of same concepts.
2.2.5 Staff Assignment Miner
Staff assignment rules define who is allowed to do which tasks. This technique mines and compares the ”real” staff assignment rules with the staff assignment rules defined for the underlying process afterwards. Based on this comparison, possible deviations between existing and mined staff assignment rules can be automatically detected [22].
2.3
The ProM Framework
The work developed in this dissertation was implemented as a plug-in for the ProM Framework1 [21, 27]. ProM is a powerful tool aimed at process mining in all the per-spectives (process, organizational and case perspective). This framework is issued under an open-source license and extensible, i.e., it has been developed as a completely plug-able environment. Currently, more than 280 plug-ins have been included. The most relevant plug-ins for this work are mining plug-ins. Figure 2.5 presents an overview of the architecture of ProM showing the relations between the framework, the plug-ins and the event log.
The event log that usually is used as input to the plug-ins is in Mining XML (MXML) format, which is a specific format based on XML and specially designed for this frame-work [28]. Each Process-Aware Information Systems (PAIS) has its own log file format, which difficult the use of process mining tools, because every time we want to use an event log as an input, we first need to convert it to a format supported by the process mining tool. This not only requires knowledge of the PAIS event log format but also the process mining tool event format. To make things easier, developers of ProM decided to create MXML. This format follows a specified schema definition, which means that log does not consist of random and disorganized information; it rather contains all the elements needed by the plug-ins at a known location [17, 25, 26].
Figure 2.6 represents MXML format and Figure 2.7 a snapshot of a MXML log. The process log starts with theWorkflowLogelement that contains SourceandProcess ele-ments. TheSource elementrefers to the information about the software or the system that
14 CHAPTER 2. MINING THE ORGANIZATIONAL PERSPECTIVE
Figure 2.5:Overview of the ProM Framework (adapted from [27])
was used to record the log. While theProcess element represents the process to which the process log belongs to. In mean while,Process element is made up of several audit trailentries. Anaudit trailcorresponds to an atomic event and records information such as: WorkflowModelElement (refers to the activity the event corresponds to), EventType (specifies the type of the event), Timestamp (refers to the time the event occurred), and Originator elements (individual that performed the activity). [17, 25, 26]
As shown the (Fig. 2.5), Process-aware Information Systems (PAIS) generate these event logs and theLog Filteris used to read the logs only if it is necessary to filter them before perform any other task.
As (Fig. 2.5) shows, the ProM framework allows five different types of plug-ins [7, 27]: • Import plug-insa wide variety of models can be loaded ranging from a Petri net
to ITL formulas.
• Mining plug-inswhich implement some mining algorithm, e.g., mining algorithms that construct a Petri net based on some event log. The results are stored as a Frame.
• Analysis plug-ins typically implement some property analysis on some mining result. For example, for Petri nets there is a technique which constructs place in-variants, transition inin-variants, and a cover ability graph.
• Conversion plug-ins take a mining result and transform it into another format, e.g., from EPCs to Petri nets.
• Export plug-ins which implement some ”save as” functionality for some objects (such as graphs). For example, there are plug-ins to save EPCs, Petri nets, spread-sheets, etc.
2.4. CONCLUSION 15
Figure 2.6:MXML format (adapted from [8])
All mining techniques for social network analysis described in Section 2.2 are available in ProM.
2.4
Conclusion
In this chapter we have introduced the main key concept of process mining - Log file. We have explained which type of information about business processes is stored in log event, and how this information is used to derive meaningful sociograms in organiza-tional perspective. A set of metrics have been developed with the porpuse to to establish relationships among individuals from log events information. We have also discussed a set of techniques developed for social network mining. Finally, we have introduced the framework used through this dissertation, and the log file format used on its process mining techniques.
16 CHAPTER 2. MINING THE ORGANIZATIONAL PERSPECTIVE
<?xml v e r s i o n=” 1 . 0 ” encoding=”UTF−8” ?>
<WorkflowLog x m l n s : x s i =” h t t p : //www. w3 . org /2001/XMLSchema−i n s t a n c e ” xsi:noNamespaceSchemaLocation=”WorkflowLog . xsd ”
d e s c r i p t i o n =” T e s t l o g f o r d e c i s i o n miner ”>
<Source program=” name: , d e s c : , d a t a : {program=none}”> <Data>
<A t t r i b u t e name=”program”>name: , d e s c : , d a t a : {program=none}</ A t t r i b u t e> </Data>
</Source>
<P r o c e s s id=” 0 ” d e s c r i p t i o n =” ”>
<P r o c e s s I n s t a n c e id=” Case 4 ” d e s c r i p t i o n =” ”> <A u d i t T r a i l E n t r y>
<WorkflowModelElement>R e g i s t e r Claim</WorkflowModelElement> <EventType>s t a r t</EventType> <Timestamp>2002−04−08 T 0 9 : 5 2 : 0 0 . 0 0 0 + 0 1 : 0 0</Timestamp> <O r i g i n a t o r>Robert</ O r i g i n a t o r> </ A u d i t T r a i l E n t r y> <A u d i t T r a i l E n t r y> <Data> <A t t r i b u t e name=”Amount”>500</ A t t r i b u t e> <A t t r i b u t e name=”CustomerID”>C568120443</ A t t r i b u t e> <A t t r i b u t e name=” PolicyType ”>Normal</ A t t r i b u t e> </Data>
<WorkflowModelElement>R e g i s t e r Claim</WorkflowModelElement> <EventType>complete</EventType>
<Timestamp>2002−04−08 T 1 0 : 1 1 : 0 0 . 0 0 0 + 0 1 : 0 0</Timestamp> <O r i g i n a t o r>Robert</ O r i g i n a t o r>
</ A u d i t T r a i l E n t r y> <A u d i t T r a i l E n t r y>
<WorkflowModelElement>Check p o l i c y only</WorkflowModelElement> <EventType>s t a r t</EventType>
<Timestamp>2002−04−08 T 1 0 : 3 2 : 0 0 . 0 0 0 + 0 1 : 0 0</Timestamp> <O r i g i n a t o r>Mona</ O r i g i n a t o r>
</ A u d i t T r a i l E n t r y> <A u d i t T r a i l E n t r y>
<WorkflowModelElement>Check p o l i c y only</WorkflowModelElement> <EventType>complete</EventType>
<Timestamp>2002−04−08 T 1 0 : 5 9 : 0 0 . 0 0 0 + 0 1 : 0 0</Timestamp> <O r i g i n a t o r>Mona</ O r i g i n a t o r>
</ A u d i t T r a i l E n t r y> <A u d i t T r a i l E n t r y>
<WorkflowModelElement>E v a l u a t e claim</WorkflowModelElement> <EventType>s t a r t</EventType> <Timestamp>2002−04−08 T 1 1 : 2 2 : 0 0 . 0 0 0 + 0 1 : 0 0</Timestamp> <O r i g i n a t o r>Linda</ O r i g i n a t o r> </ A u d i t T r a i l E n t r y> <A u d i t T r a i l E n t r y> <Data> <A t t r i b u t e name=” S t a t u s ”>approved</ A t t r i b u t e> </Data>
<WorkflowModelElement>E v a l u a t e claim</WorkflowModelElement> <EventType>complete</EventType>
<Timestamp>2002−04−08 T 1 1 : 4 7 : 0 0 . 0 0 0 + 0 1 : 0 0</Timestamp> <O r i g i n a t o r>Linda</ O r i g i n a t o r> </ A u d i t T r a i l E n t r y> </ P r o s s I n s t a n c e> . . . . </ P r o c e s s> </WorkflowLog> Figure 2.7:MXML snapshot
Chapter 3
Social Network Analysis
I
n the previous chapter we have explained how to obtain the data for creating the so-ciograms. After having a sociogram we are able to start social network analysis (SNA). We start explaining broadly what SNA consists of and the value and benefits it brings to the business. With SNA tools, several techniques can be applied to analyze social networks and make conclusions both at the individual level (i.e., analyze each node in-dividually and derive relationships between individuals) and the entire network. Finally we will discuss a very common characteristic of social networks - existence of commu-nity structures [8]. The identification and study of these structures can be helpful in SNA, especially the ones with large dimensions.3.1
Social Network Analysis (SNA)
In a very competitive market it is crucial for organizations to have access to knowledge and information, preferably before than other organizations, because unique and valu-able information can guarantee a good competitive advantage. Therefore the acquisition of information allows the organizations to improve the performance of the strategic busi-ness process.
Communication among people is not only important because it allows the spread of information but it is also the key factor to the creation of innovation and consequently creation of value to the organization. All organizations establish a formal social structure where all the hierarchy relationships between employees are defined. However, in most cases, the relationships that really exist in the organizations have nothing to do with the structure previously defined[6].
Social network analysis (SNA), which is the analysis of social networks in the organiza-tional perspective, plays a very important role since it evaluates the relationships among people, teams, departments or even entire organizations[6]. This kind of analysis can achieve important information to improve the flow of communication inside an organi-zation and allows the managers to discover the way work is being done in the informal way. The main goal of SNA is to turn the communication process completely trans-parent and provide tools to turn all the process of communication better and fluent.
18 CHAPTER 3. SOCIAL NETWORK ANALYSIS
All SNA techniques rely all in graphic representation, thus a social network is repre-sented as graph, where each node is a person and each link between two nodes is a relationship[3, 16].
3.2
SNA Measures
After generating a social network as a graph (sociogram), it is necessary to define mea-sures to perform SNA, so that it is possible to make a comparison among actors or net-works. Measures in SNA can be separated in the ones that evaluate the entire network and the ones that only evaluate a specific node [11, 26]. Further we will list and explain some of the existing measures.
3.2.1 Measures for an individual level.
When analyzing a specific individual (i.e., a node in the graph) it is needed to determine his role and influence in the network, i.e., to know if the individual is a leader or is isolated from the rest of the network, to know if it is a crucial link enabling the connection between two other individuals. There are many notions about individual that can be taken. To do so, we explain some of the metrics that are usually used to accomplish these notions.
• Degree: The Degree of a node (sometimes called Degree Centrality) is number of nodes that are connected to it. This measure can be seen as the popularity of each actor.
If a directed graph is being used, the single degree metric would be split into two metrics: (1)In-Degreewhich measures the number of nodes that point toward the node of interest, and (2)Out-Degree, which measures the number of nodes that the node of interest points toward.
• Betweenness Centrality: This measure computes the influence that a node has over the spread of information through the network. In social network context, a node (i.e., person) with high betweenness centrality value means that it performs a crucial role in the network, because this person enables the connection between two different groups. If this node is the only bridge linking these two groups and for some reason this node is no longer available, the change of information and knowledge between these two groups would be impossible.
• Closeness Centrality: This measure computes how close each node is to the other nodes in the network. Unlike other centrality metrics, a lower Closeness Centrality value indicates a more central (i.e., important) position in the network.
In social network context, this means that a node (i.e., person) with a higher close-ness centrality value, to get through the node it wants, it will need to contact a lot of nodes in its ways. One the other hand, a another node with a lower closeness centrality value is able to contact the same node with fewer steps. Therefore, the last case is the best to monitor the information flow in the network as it has the best visibility into what is happening in the network.
3.2. SNA MEASURES 19
• Eigenvector Centrality: This measure is similar to the Degree since it counts how many connections a node has. But this metric goes further and has in consideration the Degree of the vertices that are connected to it. In social network context, two nodes can have the same degree value; however one of them can be connected with nodes that have important roles in the network. Thus this node will have a higher Eigenvector Centrality value than the other node.
• Clustering Coefficient: This measure determines node’s capacity to cluster to-gether. To do this, it is necessary to determine how close node’s neighbours are to being a clique. By clique we understand a network where all possible connec-tions exist, i.e., in a network with 4 nodes and undirected links, it would be a clique if it had 6 links; all nodes are directly connected with each other.
More specifically, the Clustering Coefficient, it is the number of links connecting node’s neighbours divided by the total number of possible links between node’s neighbours.
In social context, a node with high clustering coefficient means that it is much embedded in the network, while a node with low coefficient means that it is a peripheral node and more disconnected from all nodes. The peripheral nodes have lack of new knowledge and information.
3.2.2 Measures for the network level
The metrics above are restricted to a single individual. But when doing network analysis it is also necessary to make some conclusions about the whole network, i.e., to determine the capacity of the network to be separated into smaller sub-networks (clusters), to de-termine if the network is sparse or dense. In order to know this kind of information, we explain some of the metrics that are usually used to accomplish these notions.
• Density: The value of this measure ranges between 0 and 1 indicating how inter-connected the vertices are in the network. In the social context, a dense network means that everyone communicates with everyone. The density is defined as:
Density= n
N2 (3.1)
where nrepresents the links that there are in the network and N represents the maximum number of possible links.
• Clustering coefficient: This metric determines the probability of a network to be partitioned into a finite number of sub-networks. In the social context, a new clus-ter is seen as a new team/group in the organization.
• Centralization: This measure is directly connected to the individual notion of cen-trality, explained in the previous section. The lower the number of Central nodes on the network, the higher is the centrality of a network. In the social context, high centralized network is dominated by one or a few persons. If from some reason this person is removed, the network quickly breaks into unconnected sub-networks. A
20 CHAPTER 3. SOCIAL NETWORK ANALYSIS
highly central network is not a good sign because it means that it has critical points of failure, putting too much trust and power in a single individual.
3.3
Finding community structures in networks
SNA relies a lot in graphic visualization, all SNA algorithm’s output is a graph repre-senting the network. The measures presented above are crucial to analyze the network; however the analysis process must be complemented with a graphical analysis. When dealing with networks of large dimensions it is difficult and complex to make a SNA. Facing this problem many algorithms have been developed to identify communities (sub-networks) in the network, adopting a divide-to-conquer technique. The algorithms developed are a merge of clustering algorithms and the SNA measures discussed in Sec-tion 3.2.
The problem finding good divisions of networks has a long history. For good divisions, we mean finding the most natural sub-groups of a network and the most similar to the groups of the real social structure. We will present, according to the evolution over time, some of the most important clustering methods used to detect community structures in networks. But first we need to make clear what a community structure is.
Community structure definition
Social networks have been studied for quite a while, in fields ranging from modern soci-ology, anthropsoci-ology, social psychsoci-ology, communication studies, information science, to organizational studies as well as Biology.
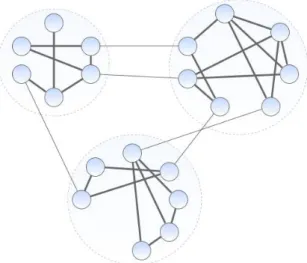
The general notion of community structure in complex networks was first pointed out in physics literature by Girvan and Newman [9], and refers to the fact that nodes in many real networks appear to group in distinct subgraphs/communities. Inside each community there are many edges among nodes, but among communities there are fewer edges, producing a structure like the one shown in Figure 3.8. Density of edges within communities is dense and among communities is sparse.
To better understand how Girvan and Newman got to this definition we will introduce an important theory, developed in sociology area -Strong and Weak Ties theory [10, 16]. Strong and Weak Ties is a theory authored by Granovetter [10, 16] where the author argues that within a social network, weak ties are more powerful than strong ties. In a social network, the strength of a tie that links two individuals may range from weak to strong depending on the quantity, quality and frequency of exchanges between ac-tors. Stronger tiesare characterized by increased frequency of communication and more intimate connections between individuals, for example, stronger ties exists among close friends, family members, workers of one specific department. OnWeak ties, by contrast, more limited investments of time and intimacy are implicit, resulting an array of social acquaintances, for example, weak ties are common among different departments . Granovetter [16] defends that Strong tiesare considered more useful in facilitating the flow of information between individuals. Weak ties, on the other hand, are of greater
3.3. FINDING COMMUNITY STRUCTURES IN NETWORKS 21
Figure 3.8: Network with community structure. In this case there are three communities (represented by the dashed circles) composed by densely connected vertices. Links of lower density (depicted with thinner lines) are the ones that establish a connection between the
different communities
importance in encouraging exchange of a wider variety of information between groups in an organization. People with few weak ties within a community will become restricted from receiving new information from outside circles and will be resigned to hear the same re-circulated information. For this reason weak ties are more powerful than strong ties, because they able to spread new information, innovation and consequently bring value to the company. [12, 16]
This theory idealizes the social network as group of communities, where a community is a set of individuals with dense and strong ties between them, i.e., individuals with a high level of intimacy, while connections between communities should be sparse and weak.
Now that the meaning of community structure is clear we are able to introduce the al-gorithms developed to identify this structures. The alal-gorithms are presented in two main groups: Traditional Approaches, where we introduce the beginning of clustering al-gorithms andRecent Approaches, where we introduce the most recently discovers in this subject.
The algorithms described as follows, assume that the network is the most simple possi-ble, i.e., there are undirected and unweighted links between nodes.
3.3.1 Traditional Approaches
It is commonly stated by literature [8, 9, 19] that the most traditional approaches for this problem have origin in two main fields: Computer Science, which has created the idea of graph partitioning; and Sociology which has created the idea of hierarchical clustering.
22 CHAPTER 3. SOCIAL NETWORK ANALYSIS
Computer Science Approaches
Graph partition[9] is a top-down approach based on interactive bisection. This kind of algorithm finds the best division of the network in two groups. I it is necessary to di-vide the social network in more than two groups, each one of the groups generated in previous interaction is divided into two new groups. The subdivision is repeated until we have the required number of groups. The main disadvantage of this approach is that it only divides the network into two groups and not in an arbitrary number of groups. For example, if we want to divide the network into three clusters the algorithm will first divide the network into two clusters and then divide one of the two clusters in two new clusters, performing at the end three clusters. This approach does not guarantee that this is the best division, and the results produced are far from satisfactory.
Sociological Approaches
Hierarchical algorithms can be agglomerative (bottom-up) or divisive (top-down). Ag-glomerative algorithms begin with a cluster for each element of the network and end with a cluster containing all the members in the network. In Agglomerative algorithms each iteration merges two of the existing clusters, so that we have one cluster less. Divisive algorithms work on the opposite way. They start with a single cluster contain-ing all the elements of the network and end with one cluster for each element. In this kind of algorithm each iteration divides the existing cluster in two, so that at the end we will have a cluster for each element in the network.
Most of the organizational models are hierarchical, thus for the purpose to find commu-nities in networks the agglomerative is more used than the devise algorithms.
Given a network with a set ofN nodes, the basic process of anagglomerative hierarchical clusteringis the following:
1. Each node is assigned to a cluster (if there areN nodes, will existN clusters, each containing just one item). In this step the distances (similarities) between the clus-ters are the same as the distances (similarities) between the items they contain. 2. Find the closest (most similar) pair of clusters and merge them into a single cluster,
so that now there is one cluster less. Compute distances (similarities) between the new cluster and each of the old clusters.
3. Repeat steps 2 and 3 until all items are clustered into a single cluster of sizeN. Step 3, the distance between two clusters, can be done in different ways, which is what distinguishessingle-linkagefromcomplete-linkageandaverage-linkageclustering.
• Single Linkage
Single linkage, also known as the nearest neighbour technique defines similarity between two clusters as the distance between the closest pair of elements of those
3.3. FINDING COMMUNITY STRUCTURES IN NETWORKS 23
clusters. In other words, the distance between two clusters is given by the value of the shortest link between the clusters.
In the single linkage method,D(r, s)is computed asD(r, s) = M ind(i, j) , where elementi is in cluster r and element j is cluster s. This technique computes all possible distances between objects from clustersrand objects from clusters. The minimum value of these distances is known as the distance between clustersrand s.
At each stage of hierarchical clustering, the clustersr ands, for whichD(r, s) is minimum, are merged.
• Complete Linkage
This method is similar to the previous one, but instead of considering the minimum value, it considers the maximum value. Complete Linkage computes the distance between two clusters as the distance between the two most distant elements in the two clusters.
• Average Linkage
Here the distance between two clusters is defined as the average distance from all distances between two clusters.
In the average linkage method,D(r, s) is computed asD(r, s) = T rs/(N r∗N s). WhereT rsis the sum of all distances between clusterrand clusters. N r andN s are the sizes of the clustersrandsrespectively.
At each stage of hierarchical clustering, the clustersr ands, for whichD(r, s) is the minimum, are merged.
The main disadvantage of this approach is that it usually fails finding the rights com-munities in the networks when the real structure is known, which makes difficult to rely in this algorithm in other cases. Another disadvantage is that it tends to neglect the pe-ripheral nodes and find only the cores of the communities. The nodes that are in the core of the network tend to have stronger similarity between them, so the agglomerative algorithm will tend to cluster early these nodes.
3.3.2 Recent Approaches
Trying to address the problems of the two approaches above and due to the emerge of more complex networks such as Internet, the World-Wide-Web and e-mail, some efforts have been made and new approaches have emerged. Almost recent approaches rely in the hierarchical clustering; however each approach tries to make an improvement of the algorithm applying some SNA measures discussed in ˜refsecond:2.
For example, thealgorithm of Girvan and Newman[9, 19] is one of the recent algorithms that can find the most similar communities when comparing with the real community structure, giving us the most satisfactory results. This is a divisive method based on the removal of nodes, i.e., it believes that removing the nodes with high betweenness will split the network into its natural communities. The nodes with high betweenness
24 CHAPTER 3. SOCIAL NETWORK ANALYSIS
can be imagined as being a bridge among communities, and so, the boundaries between communities.
Although the results are very satisfactory, the performance of the algorithm when deal-ing with networks of big dimensions is very poor. The algorithm is very heavy, because every time that a node is removed from the network, we need to evaluate the new value betweenness of each node. As an effort to overcome this performance issue, thealgorithm of Tyler[20] (used in studies of email networks) was developed. Although they made an algorithm faster, the accuracy of the results reduced.
Along the years some algorithms such as: the algorithm of Radicchi[19], the algorithm of Wu and Huberman[19], have appeared to address the limitations of the previous algo-rithm. Although they are faster, the results are poor and worse than Girvan and Newman Algorithm [19].
All the algorithms mentioned above, both Traditional and Recent Approaches, have drawbacks. Although each one is an attempt to address and overcome the issues of the previous one, there is a disadvantage that is common to all approaches and it is drawing all attentions. The problem is that none of the algorithms, gives a guide to how many communities a network should be split into.
To address this problem, performance and accuracy, recently a new concept has emerged -Modularity[19, 20]. The authors of thealgorithm of Girvan and Newman[20] developed this concept when they were faced with the handicap of the algorithm do not provide any hint about how many communities should be split. Modularity is a quality mea-sure for graph clustering. It meamea-sures if a specific division of a network into a group of communities is good or not, in the sense that the connections inside a community are dense and the connections between communities are sparse. Further, in Chapter 5.3 modularity will be explained in more detail.
3.4
Conclusion
In this chapter we have introduced Social Network Analysis, one of the three perspective of process mining and the one where our dissertation is focused. The kind of information that can be depicted with this analyze was also explained in this chapter. Social Network Analysis is not only able to extract information about each individual in the network but also about the entire network. We have also presented some algorithms that can derive meaningful sociograms.
Chapter 4
Proposed Approach
I
n this chapter we analyze the existing social mining tools available in the market andcompare it with ProM. This way we attempt to address the major challenges present in social mining tools, in particular ProM. We will present a proposal to overcome the challenges found.In this chapter we also make clear why we decided to develop a plug-in in ProM frame-work rather than another frameframe-work.
4.1
Motivation
Nowadays there is paraphernalia of software for Process Mining with Social Network analysis tools, some of them are: NetDraw1, Pajek2, NetMiner3, UCINET4, MultiNet5, ProM among many others.
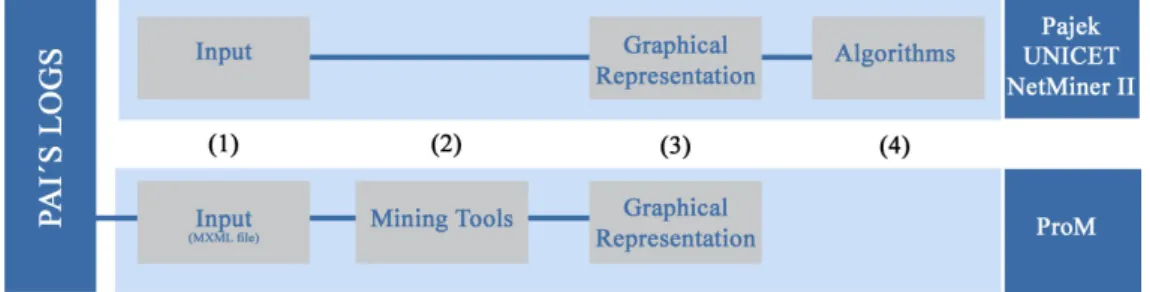
To better understand the advantages and limitations of ProM it was made a comparison with three of the most famous open-source software. Figure 4.9 illustrates this com-parison showing the different phases supported by software packages during a social network analysis.
The goal of process mining is to extract information about processes from event logs. Nowadays, most of the Process-aware Information Systems (PAIS) generate the event logs. However each of them has its own data structure, and its own language to describe the internal structure. When trying to use events from different system to do process mining, we need to be able to present logs in a standardized way, so that the software for SNA that we are using can process and analyze the event logs [7]. One of the main advantage of ProM over other software is that it can do the mapping between the meta-model of widely-used information systems to his own meta-meta-model - MXML. Unfortu-nately, all the other software do not establish this direct connection with PAIs. If the user wants to do a social network analyze through one log, the user has to do the mapping
1http://www.analytictech.com/downloadnd.htm 2http://pajek.imfm.si/doku.php?id=download 3http://www.netminer.com/NetMiner/home_01.jsp 4ttp://www.analytictech.com/ucinet/ 5http://www.sfu.ca/personal/archives/richards/Multinet/Pages/multinet.htm 27
28 CHAPTER 4. PROPOSED APPROACH
Figure 4.9: Comparison of the different phases supported by the ProM and other softwar packages during a social network analysis
between the meta-model of the PAI to the input format supported by the software. This process requests knowledge of both meta-model [7, 13].
Another advantage of ProM over other tools is that while others only represent the data in a graphic way (sociogram) and determine some of the Social Network Analysis Mea-sures described in Section 3.2. ProM offers many mining tools that not only can de-termine SNA measures but also can derive meaningful sociograms from the event logs. These mining techniques were described in Section 2.2.
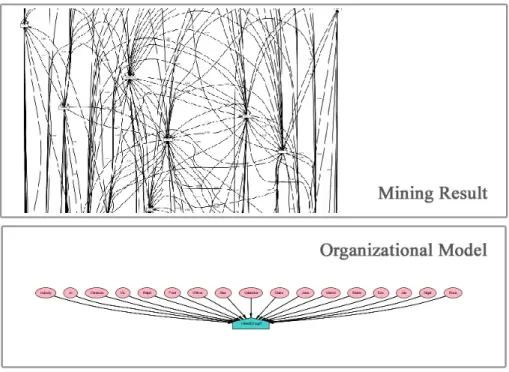
ProM is the most complete Process Mining tool since it is able to mine all three perspec-tives (process, organizational and case). However in ProM becomes very challenging to analyze large networks. One of the requirements of process mining is a graphic repre-sentation of data. Data represented in a graphic, dot or social networks becomes much easier to analyze the data. In this way ProM is a bad tool. Figure 4.11 shows a large network represented by ProM, as we can see it is a confusing representation of the data and the image is static, i.e., the user can not manipulate the image (move nodes away, re-arrange the positions of nodes, etc).
4.2
Proposal
In previous section we have shown that ProM is a more complete framework than the others enumerated, however it has poor and limited visualization capabilities. As shown in Section 2.2, ProM has many plug-ins available for the organizational mining perspec-tive, but most of these plug-ins make analysis at the individual level, enabling the user to detect communities or groups inside the network. For example,Working Togetherplug-in, ProM tells us thatoriginatorAworks withoriginatorB, but cannot give us any informa-tion about teams, for example: how many teams exist in the company and how different teams interact and are connected with one another.
This way our proposal attempts to overcome both issues presented above. The main goals of our proposal are:
1. we intend to develop ProM plug-ins for the organizational perspective, making possible to identify groups/communities of originators in the social network; 2. provide ProM with advanced visualization capabilities so that it becomes easier to
4.2. PROPOSAL 29
analyze and have more interesting and richer outcomes. Next subsections will explain how we intend to achieve our goals.
4.2.1 Application of Agglomerative Hierarchical Clustering in SNA
In Section 3 we have discussed some of the most important traditional and recent clus-tering methods used to detect community structures in networks. From those we have decided to implement Agglomerative Hierarchical Clustering (AHC) from different rea-sons that we will explain now.
All networks generated by mining tools of ProM are weighted graphs, and the analysis process has in consideration the weights of the links. This information brings value to the analysis since it makes the analysis richer and more interesting. The weights of links are extracted from information in event logs; this information can be, for example, how many times two originators work together or how many tasks two originators perform in common. The weights of links represent the power of relationship between two nodes, i.e., how frequently they work together.
Recent algorithms, discussed in Section 3.3.2, were made for simple networks, undi-rected and unweighted. If we were adopting one of the recent algorithms we could not have weighted links and would be wasting important and crucial information for net-work analysis.
Recent algorithms do not exploit the information on event-logs and they do not apply any mining tool neither use metrics like the ones discussed in section 2.1 They only map the information into a graph and then determine the communities based on SNA measures (most of them usebetweennessanddegreemeasures) or distance measures such as the Euclidean and Hamming distance.
Due to these limitations, we excluded recent approaches.
We also excluded traditional approaches based on graph partitioning because of the dis-advantages of this technique mentioned above.
Therefore we decided to choose Hierarchical clustering, which is the fundamental base of the most algorithms to find communities. This approach allows us to analyze a grad-ual agglomeration of the nodes into communities, starting from the individgrad-ual perspec-tive to the organizational perspecperspec-tive. Although we have implemented Agglomeraperspec-tive Hierarchical Clustering, we did it with some improvements and adjustments:
1. The first adaptation of the algorithm consists in using the power of the relationship between nodes to determine if they belong to the same cluster. If two actors:actor A andactor Bwork together in five cases, andactor Aandactor Cwork together only in two cases, than the relationship betweenactor Aandactor Bis stronger than the relationship betweenactor Aandactor C[16].
2. We will add the concept of modularity to the algorithm. Our algorithm will de-termine the modularity to each division so that we can know which one has the highest quality (the one with the highest value of modularity). The modularity of each division will be shown in a chart and the best one will be highlighted.
30 CHAPTER 4. PROPOSED APPROACH
Given a network with a set of N nodes, our plug-in is the following:
1. Each node is assigned to a cluster (if there areN nodes, will existN clusters, each containing just one item). In this step the distances (similarities) between the clus-ters correspond to the power of the relationship of the nodes they contain;
2. Then we will search for the most powerful relationship between two clusters and merge them into a single cluster, so that it will be one cluster less;
(a) If there are several candidates, i.e., more than a couple of clusters with the most powerful relationship, we decide which candidates to agglomerate based on two options: (1) we choose the last couple of clusters found, or (2) we choose the couple of clusters that maximizes the modularity.
3. Compute distances (similarities) between the new cluster and each of the old clus-ters. For this step we may use one of these methods:single-linkage,complete-linkage oraverage-linkage;
4. We determine the value of modularity for this number of clusters;
5. Repeat steps 2, 3 and 4 until all items are clustered into a single cluster of sizeN. Adopting this approach it will help us to achieve both of our main goals. The first goal will be achieved because Agglomerative Hierarchical Clustering (AHC) is widely used to identify teams/groups/communities in the network. And the second goal will also be achieved because in some way AHC reduces the size of the network. AHC allow us to analyze the network at the individual level (first iteration), i.e., the relationships between originators; and also allow us to analyze the network at the organizational level, i.e., identifies communities and shows the relationships between those communities.
The ideal was to implement our proposal in all five tools discussed in Section 2.2.1. However, we decided to apply our proposal only in two algorithms: Working Together andSimilar Tasks. We will now explain why we have chosen these algorithms.
• Workin


![Figure 2.5: Overview of the ProM Framework (adapted from [27])](https://thumb-us.123doks.com/thumbv2/123dok_us/396682.2544347/28.892.164.637.162.474/figure-overview-prom-framework-adapted.webp)
![Figure 2.6: MXML format (adapted from [8])](https://thumb-us.123doks.com/thumbv2/123dok_us/396682.2544347/29.892.170.811.129.507/figure-mxml-format-adapted-from.webp)