Code Ownership in Open-Source Software
Matthieu Foucault, Jean-R´
emy Falleri, Xavier Blanc
To cite this version:
Matthieu Foucault, Jean-R´
emy Falleri, Xavier Blanc. Code Ownership in Open-Source
Soft-ware. 9 pages. 2014.
<
hal-00976024
>
HAL Id: hal-00976024
https://hal.archives-ouvertes.fr/hal-00976024
Submitted on 11 Apr 2014
HAL
is a multi-disciplinary open access
archive for the deposit and dissemination of
sci-entific research documents, whether they are
pub-lished or not.
The documents may come from
teaching and research institutions in France or
abroad, or from public or private research centers.
L’archive ouverte pluridisciplinaire
HAL, est
destin´
ee au d´
epˆ
ot et `
a la diffusion de documents
scientifiques de niveau recherche, publi´
es ou non,
´
emanant des ´
etablissements d’enseignement et de
recherche fran¸cais ou ´
etrangers, des laboratoires
publics ou priv´
es.
Code Ownership in Open-Source Software
Matthieu Foucault
University of Bordeaux LaBRI, UMR 5800 F-33400, Talence, France[email protected]
Jean-Rémy Falleri
University of Bordeaux LaBRI, UMR 5800 F-33400, Talence, France[email protected]
Xavier Blanc
University of Bordeaux LaBRI, UMR 5800 F-33400, Talence, France[email protected]
ABSTRACT
Context: Ownership metrics measure how the workload of software modules is shared among their developers. They have been shown to be accurate indicators of software qual-ity. Objective: Since ownership metrics studies were done only on industrial software projects, we replicated such a study on Java free/libre and open source software (FLOSS) projects. Our goal was to generalize an “ownership law” that stated that minor developers should be avoided. Method:
We explored the relationship between ownership metrics and fault-proneness on seven FLOSS projects, using publicly available corpora to retrieve the fault-related information.
Results:In our corpus, the relationship between ownership metrics and module faults is weak. At best, less than half of projects exhibit a significant correlation, and at worst, no projects at all. Moreover, fault-proneness seems to be much more influenced by module size than by ownership. Conclu-sion:The results of ownership studies done on closed-source projects do not generalize to FLOSS projects. To under-stand the reasons for that, we performed an in-depth analy-sis and found that the lack of correlation between ownership metrics and module faults is due to the distributions of con-tributions among developers and the presence of “heroes” in FLOSS projects.
Categories and Subject Descriptors
D.2 [Software]: Software Engineering; D.2.8 [Software Engineering]: Metrics—process metrics
General Terms
Management, Measurement
Keywords
Process metrics, code ownership, reproduction study
1.
INTRODUCTION
Permission to make digital or hard copies of all or part of this work for personal or classroom use is granted without fee provided that copies are not made or distributed for profit or commercial advantage and that copies bear this notice and the full citation on the first page. To copy otherwise, to republish, to post on servers or to redistribute to lists, requires prior specific permission and/or a fee.
Copyright 20XX ACM X-XXXXX-XX-X/XX/XX ...$15.00.
Software metrics are designed to express quantitative mea-sures that can serve as indicators for software quality [3]. Although they were originally defined to measure software artifact characteristics, such as the number of lines of code, the number of methods, etc., nowadays metrics are defined to measure developer’s activity [19]. The main intuition of these metrics, also calledprocess metrics, is that developers habits have a deeper impact on software quality than the in-trinsic characteristics of software artifacts, as suggested by previous research [15, 20].
Among process metrics, those measuring code ownership are of a particular interest. They measure the level to which a developer “owns” a module of a software project, by mea-suring the ratio of contributions made by the developer to the total number of contributions for the module. More pre-cisely, if a developer authored more than 5% of commits to a module, she is considered to be a major contributor of that module. On the other hand, a developer who authored less than 5% of commits to a module is considered to be a minor contributor. According to Bird et al. [2], ownership metrics are a good indicator for software quality, as the more minor developers contribute to a software module, the more faults it contains.
Such a result may therefore be used to reorganize the de-velopment teams: major owners should be assigned for each module of a software project and minor owners should be avoided at all costs. However, prior to reorganizing devel-opment teams, a stronger validation of ownership metrics is needed, and this is the purpose of this paper. First, it should be noted that the empirical validation of ownership metrics performed by Bird et al. was done solely on industrial soft-ware — Windows Vista and Windows 7 modules. Further, the metric granularity used by Bird et al., which considers binaries (i.e., .dll files) as modules, is not applicable to every programming language.
This paper aims to replicate the empirical study of own-ership metrics originally performed by Bird et al. We per-formed a similar study but considered Java free/libre and open source software (FLOSS) projects rather than indus-trial closed-source projects. Moreover, we tested ownership metrics using two granularities: Java packages and source code files. Initially, our objective was to make a step towards generalization of the “ownership law” stating that develop-ers, involved in developing a module, should be its major owners and that minor owners should be avoided. However, the results we obtained do not support the “ownership law.” We did find a correlation between ownership metrics and module faults but, at the best, only in half of the projects.
Then, when blocking for module sizes (i.e., eliminating the impact of size) we did not find any relationship between ownership metrics and module faults. These findings show that the “ownership law” cannot be generalized and that code metrics are better indicators of software quality than ownership metrics on Java FLOSS projects. In order to un-derstand why the correlation between ownership metrics and module faults was not ubiquitously found, we performed a thorough analysis of the software projects under examina-tion and noticed that the distribuexamina-tion of ownership metrics may have an impact on this correlation.
This paper is structured as follows: Section 2 gives an overview of the related work. Section 3 describes the method-ology used in the ownership metrics studies: first that of the original ownership study performed by Bird et al. and then the one we used in our replication study. Section 4 states the main results of our study, which are further discussed in Section 6, and Section 7 concludes.
2.
RELATED WORK
In the late 2000s, several studies have shown evidence of a relationship between the number of developers of a software artifact and its fault-proneness. Illes-Seifert and Paech [11, 12] found a correlation between the number of faults iden-tified on a file and its number of authors. Later, they ex-plored the relationship between several process metrics and fault-proneness, and did not find a metric where the relation-ship with fault-proneness existed in all projects. However, they found that the number of distinct authors of a file was correlated to the number of faults inalmost every project. Weyuker et al. [23] found that adding the number of devel-opers who edited a file to their prediction model provides a slight improvement to the model’s precision.
Many studies used fault prediction models to validate the relevance of process metrics for measuring software quality. Moser et al. [18] compared the predictive power of two sets of software metrics — code and process metrics — on several Eclipse projects. They found that process metrics are better indicators of software quality than code metrics. Similar results have been found by other researchers who also used fault prediction as a quality indicators for their metrics, such as in [15, 20].
D’Ambros et al. [5] evaluated different sets of metrics in a thorough study on fault prediction. They compared the pro-cess metrics introduced by Moser et al. [18] to other metrics, such as the classical source code metrics from Chidamber and Kemerer [3], the measure of entropy of changes intro-duced by Hassan [9], the churn of source code metrics and the entropy of source code metrics. They found that the pro-cess metrics, the churn metrics, and the entropy of source code metrics are the best performers for fault prediction. However, the authors expressed serious concerns with the external validity of their study (i.e., whether the results are generalizable), which calls for more empirical studies on that matter.
As the number of developers is not always the process metric that shows the highest correlation, ownership metrics rely on other information which is the proportion of contri-butions made by the developers. Using this information it is possible to classify developers as major and minor contribu-tors. The relationship between measures of code ownership and faults was studied by Bird et al. [2] on Windows Vista and Windows 7 binaries. Their study showed that the
num-ber of minor contributors of a binary is strongly correlated to the number of pre- and post-release faults of Windows binaries.
Mockus et al. [17] observed two code ownership patterns in open-source projects: In the Apache project, they found that almost every source code file with more than 30 changes had several contributors who authored more than 10% of the changes. In the Mozilla project they found that code own-ership was enforced by the development guidelines, which stated that all contributions should be reviewed and ap-proved by the module owner. Although the focus of their work was FLOSS projects and ownership in them, the au-thors did not attempt to examine the connection between the ownership patterns and fault-proneness.
3.
METHODOLOGY
This section starts by describing the methodology used in the original study of ownership metrics performed by Bird et al. [2] and continues with the methodology used in our replication study.
3.1
Original Ownership Study
The goal of the original study by Bird et al. was to eval-uate whether analyzing how many developers contributed to a project and in which proportions influenced the fault-proneness of software modules. With this questions in mind, they performed a study where they analyzed two commercial Microsoft projects: Windows Vista and Windows 7. Their data corpus includes pre- and post-release faults, precisely linked to the faulty software modules. They introduced sev-eralownership metricsthat characterize the way in which a software module was built by the developers. These metrics are described more in-depth in the next subsection.
3.1.1
Ownership Metrics
Before explaining how the ownership metrics are mea-sured, we need to define the model we use to represent a software development process and define the pertinent con-cepts, such as a software module and developer contribution. We assume that a software project is composed of a finite set of software modules that are developed by a finite set of developers who submit their code modifications by sending commits to a shared code repository. In our formal model, we use the following notations:
• M is the set of software modules of a given software project,
• Dis the set of developers, and
• Cis the set of commits they send.
Each module is defined by a finite set of source code files. When a developer modifies one of the files of a software module by committing her work, she is contributing to that module. The contributions made by a developer to a given module can be measured with different metrics (e.g., by counting the number of modified lines of codes). Bird et al. chose to measure the weight of a developer contribution by counting the number of touched files. For instance, if Alice contributes to a module by modifying three files and then another five files, she is contributing with a score of eight. More formally, let
be the number of files that belong to a software module where
• mi is the software module in question,
• djis the contributing developer who modified the
mod-ule, and
• ckis the commit made by the developer to modify the
module.
Further, for the sake of simplicity, we introduce the fol-lowing notations:
• w(m) is the sum of all developer contributions per-formed on a software modulem,
• w(d) is the sum of all contributions performed by a developerd, and
• w(m, d) is the sum of all contributions performed by a developerdon a modulem.
Based on this definition of developer contribution, the ownership metrics measure the ratio of contributions made by one developer to the rest of the developers. In other words, for each modulemand for each developerdthe own-ership metric is
ownm,d=
w(m, d)
w(m) .
In addition, Bird et al. developed the ownership metrics by defining four scores that are computed for each software module:
Ownership This score is the highest value of the ratio of contributions performed by all developers, i.e., for a given software modulem, itsOwnershipscore is
max({ownm,d|d∈D}).
Minor This score counts how many developers have a ra-tio that is lower than 5%. More formally, for a given software modulem, itsMinor score is
|{0< ownm,d≤5%|d∈D }|.
Such developers are considered to be minor contribu-tors of the software module.
Major This score counts how many developers have a ratio that is greater than 5%. In other words, for a given software modulem, itsMajor score is
|{ownm,d>5%|d∈D}|.
Such developers are considered to be major contribu-tors of the software module.
Total This score is simply the total number of developers of a modulemand is defined as:
Total = Minor + Major.
The 5% threshold used by the Minor and Major scores was arbitrarily chosen by Bird et al. as their experiments with thresholds from 2% to 10% produced similar results.
Along with the ownership metrics, Bird et al. computed several classical code metrics for each software module, such as:
Size The number of lines of code of a modulem.
Complexity Although the exact definition of the complex-ity metric used in Bird et al. study was not given, we choose to use the weighted method count (WMC) of a module m, using the definition of Chidamber and Kemerer [3].
3.1.2
Methodology and Results
Bird et al. computed the described metrics on every bi-nary file of Windows Vista and Windows 7. Having access to the number of pre- and post-release faults for each binary, they computed the correlation coefficients between the met-rics and the number of faults by using the non-parametric Spearman method.
To ensure that ownership metrics have a real added value, in contrast to classical code metrics such asSize, which was found to have a confounding effect by El Emam et al. [6], Bird et al. also performed multiple linear regression and compared the results of a model using the classical metrics and a model using both classical and ownership metrics to explain the fault numbers. Their results indicate that own-ership metrics were strongly correlated with the pre-release faults, even better than the classical metrics. They also found that it is beneficial to consider the ownership metrics in addition to the classical metrics.
3.2
Our Replication
Having presented the original, Bird et al. study, we now move on to describing our replica of their study.
3.2.1
Corpus
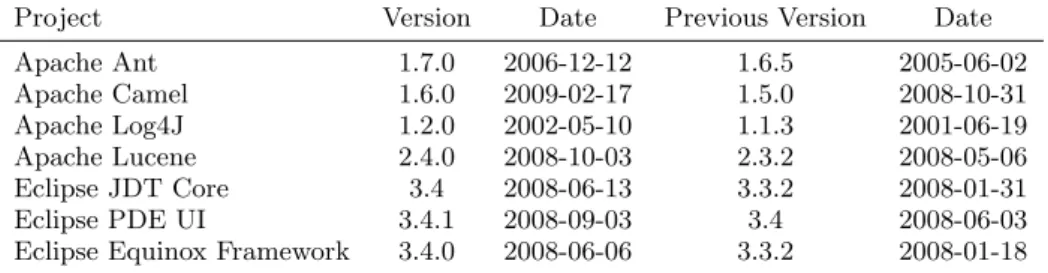
The original projects chosen by Bird et al. were Windows Vista and Windows 7, which are commercial closed-source projects. For our replication of the code ownership study, we choose seven Java FLOSS projects, shown in Table 1, as we believe that the development process of an commercial closed-source project and that of an open-source project is rather different. Therefore, being able to generalize the re-sults of the Bird et al.’s study on a corpus of FLOSS projects would provide considerable support for the ubiquity of the ownership law.
In the original study, Bird et al. had access to tools used at Microsoft and Microsoft’s internal information, which sig-nificantly helped in finding the links between faults and soft-ware modules. Obtaining such information for Java FLOSS projects is much harder as they do not use the same con-ventions and fault tracking tools. To overcome this issue, we leveraged previous empirical data that provided publicly available corpora: the PROMISE corpus [16] and the cor-pus used in the D’Ambros et al.’s study [5], available online1
. Both corpora associate Java classes to their number of faults for specific releases of the projects. Moreover, these corpora provide code metrics including the number of lines of code of a class and its complexity, which were necessary for our study.
Another noteworthy difference between our corpus and that of Bird et al. is that our corpus contains only post-release faults whereas in the original study the corpus con-tained both pre- and post-release faults [2].
1
Table 1: The Java FLOSS projects included in our corpus
Project Version Date Previous Version Date Apache Ant 1.7.0 2006-12-12 1.6.5 2005-06-02 Apache Camel 1.6.0 2009-02-17 1.5.0 2008-10-31 Apache Log4J 1.2.0 2002-05-10 1.1.3 2001-06-19 Apache Lucene 2.4.0 2008-10-03 2.3.2 2008-05-06 Eclipse JDT Core 3.4 2008-06-13 3.3.2 2008-01-31 Eclipse PDE UI 3.4.1 2008-09-03 3.4 2008-06-03 Eclipse Equinox Framework 3.4.0 2008-06-06 3.3.2 2008-01-18
3.2.2
Module Granularity
In the study performed by Bird et al., software modules are said to be compiled Window binaries. In contrast, in the Java world, it seems to be more natural to use Java classes as software modules, with a reasonable approximation of a Java class being the file in which it is written. However, we think that it may be too fine-grained, because typical Java classes are much smaller than Windows’ binary files. Hence, we decided to use two definitions of a software module in our corpus using two different granularities. A software modules can either be a Java source files (calledfilegranularity) or a Java package (calledpackage granularity), the latter being a more comparable to Windows binaries.
3.2.3
Analyzed Time Period
Ownership metrics are computed from the modifications performed by the developers of a module. Therefore, the amount of modifications taken into account has an impact on the metrics values. In the original study, Bird et al. con-sidered all the modifications performed since the last release of the software, which in that case was the previous version of the Windows operating system. Regarding this point, we wanted to explore what happens when we consider only the modifications performed since the previous release, and when considering a wider period such as the whole history available in the software repository. Thus, we use two dif-ferent time periods to compute ownership metrics: from the beginning (called thewholeperiod) and from the last release (called thelast release period).
3.2.4
Correlation and Module Size
In the original study, Bird et al. used multiple linear re-gression to take into account the effect of using ownership metrics in addition to classical code metrics, following the advice given in [6]. To that end, they compared the amount of variance in failures explained by a model that includes the ownership metrics to a model that only includes a classical code metric, such asSize. In our study, we measured this ef-fect as well, yet we used a slightly different statistical frame-work. Indeed, using multiple linear regression assumes nor-mally distributed residuals, which we did not get. To avoid this difficulty, we used partial correlation [14]. Partial corre-lation aims to compute a correcorre-lation coefficient between two variables by taking into account the effect of a set of control-ling variables. We made the necessary computations using the Spearman method (as it is a non-parametric test) and by taking into account the effect of theSize metric, which was shown to have a strong effect on the fault-proneness [6]. Using partial correlation, we were therefore able to analyze the added value of ownership metrics compared to using only
theSize metric.
3.2.5
Toolset
Since the information about bugs was readily available in the chosen FLOSS corpora, all that was left to do is to ex-tract are the contributions of the developers. The necessary data was available in the version control systems (VCSs) of the projects. In order to ease the extraction of information from the VCSs, we used an open source framework ded-icated to mining software repositories called Harmony [7] (available from its website2
). This framework, previously used for a number of empirical studies, such as [8] and [22], provides a homogeneous model for several VCSs, including Git3
and Subversion4
that were used by the projects in our FLOSS corpus. The set of Harmony analyses performed in our study is available online.5
4.
RESULTS
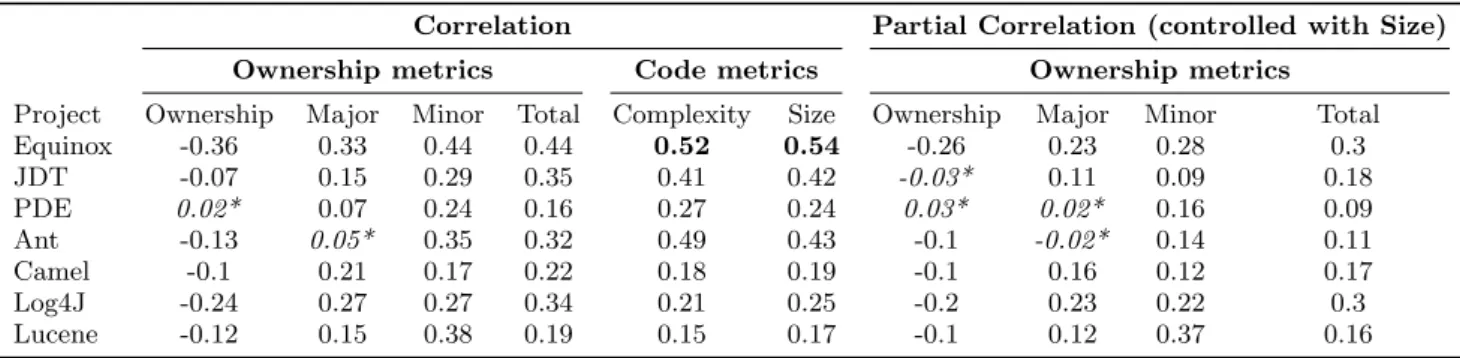
As we have two factors—module granularity and analyzed time period—with two possibilities for each—file and pack-age for the former and whole and last release for the latter, we ran our experiment four times. The results are shown in Tables 2-5.
In these tables, the columns underCorrelation show the Spearman correlation coefficients with our metrics and the module faults. Correlation coefficients range from −1 to 1, with 0 representing a total absence of correlation and
−1 and 1 representing perfect negative and perfect positive correlations respectively. The first four columns show sep-arately the coefficients for ownership metrics and the next two columns show the coefficients for code metrics. The four columns underPartial Correlation part show the coef-ficients of the partial correlation between ownership metrics and module faults, taking into account the effect of theSize
metric. They are computed using partial correlation in com-bination with the Spearman method.
For the sake of clarity, correlation coefficients are dis-played in bold if their absolute values are above the 0.50 value, meaning that they show a significant correlation. Also, we show in italic with a* symbol the correlation coefficients that were not statistically significant, i.e., with a p-value above 0.05.
4.1
Ownership vs Code Metrics
The results shown in the four tables indicate that the code metrics are better correlated with the number of faults
2 http://code.google.com/p/harmony 3 http://git-scm.com 4 http://subversion.apache.org/ 5 http://se.labri.fr/articles/ownership
Table 2: Regular and partial correlation for thepackage granularity and last release history. Correlation Partial Correlation (controlled with Size)
Ownership metrics Code metrics Ownership metrics
Project Ownership Major Minor Total Complexity Size Ownership Major Minor Total Equinox 0.6 0.64 0.00 0.64 0.72 0.73 0.38 0.41 0.00 0.41 JDT 0.11* 0.54 0.63 0.73 0.85 0.84 -0.01* 0.23* 0.18* 0.26* PDE 0.42 0.49 0.00 0.49 0.58 0.61 0.33 0.38 0.00 0.38 Ant -0.52 0.54 0.64 0.67 0.63 0.56 -0.34 0.32 0.36 0.4 Camel 0.16* 0.34 0.1* 0.33 0.36 0.4 0.08* 0.19 0.04* 0.19 Log4J 0.22* 0.2* 0.53 0.42 0.85 0.9 0.15* 0.19* 0.38* 0.3* Lucene 0* 0.34 0.39 0.41 0.47 0.49 -0.01* 0.2* 0.28 0.27 Coefficients are displayed in bold if their absolute values are above the 0.50 value, and in italic with a* symbol if the
correlation coefficients were not statistically significant, i.e., with a p-value above 0.05.
Table 3: Regular and partial correlation for thefile granularity andlast release history.
Correlation Partial Correlation (controlled with Size)
Ownership metrics Code metrics Ownership metrics
Project Ownership Major Minor Total Complexity Size Ownership Major Minor Total Equinox 0.27 0.3 0.00 0.3 0.52 0.54 0.15 0.17 0.00 0.17 JDT 0.21 0.35 0.00 0.35 0.41 0.42 0.1 0.21 0.00 0.21 PDE 0.22 0.23 0.00 0.23 0.27 0.24 0.19 0.2 0.00 0.2 Ant -0.32 0.39 0.16 0.39 0.49 0.43 -0.15 0.19 0.11 0.2 Camel 0.11 0.13 0.00 0.13 0.18 0.19 0.05* 0.07 0.00 0.07 Log4J 0.02* 0.37 0.16 0.39 0.21 0.25 0.04* 0.33 0.12* 0.35 Lucene 0.12 0.16 0.00 0.16 0.15 0.17 0.1 0.13 0.00 0.13
Table 4: Regular and partial correlation for thepackage granularity and whole history.
Correlation Partial Correlation (controlled with Size)
Ownership metrics Code metrics Ownership metrics
Project Ownership Major Minor Total Complexity Size Ownership Major Minor Total Equinox -0.46 0.45 0.46 0.52 0.72 0.73 -0.14* 0.12* 0.22 0.18* JDT -0.13* 0.18* 0.71 0.73 0.85 0.84 -0.02* 0.12* 0.3 0.36 PDE -0.21 0.4 0.49 0.54 0.58 0.61 -0.08* 0.25 0.23 0.33 Ant -0.38 0.08* 0.48 0.44 0.63 0.56 -0.24* -0.04* 0.01* -0.04* Camel -0.25 0.36 0.44 0.49 0.36 0.4 -0.22 0.23 0.29 0.35 Log4J 0.23* 0* 0.56 0.34* 0.85 0.9 0.02* 0.03* 0.54 0.33* Lucene -0.25 0.37 0.51 0.44 0.47 0.49 -0.17* 0.21* 0.35 0.26
Table 5: Regular and partial correlation for thefile granularity and whole history.
Correlation Partial Correlation (controlled with Size)
Ownership metrics Code metrics Ownership metrics
Project Ownership Major Minor Total Complexity Size Ownership Major Minor Total Equinox -0.36 0.33 0.44 0.44 0.52 0.54 -0.26 0.23 0.28 0.3 JDT -0.07 0.15 0.29 0.35 0.41 0.42 -0.03* 0.11 0.09 0.18 PDE 0.02* 0.07 0.24 0.16 0.27 0.24 0.03* 0.02* 0.16 0.09 Ant -0.13 0.05* 0.35 0.32 0.49 0.43 -0.1 -0.02* 0.14 0.11 Camel -0.1 0.21 0.17 0.22 0.18 0.19 -0.1 0.16 0.12 0.17 Log4J -0.24 0.27 0.27 0.34 0.21 0.25 -0.2 0.23 0.22 0.3 Lucene -0.12 0.15 0.38 0.19 0.15 0.17 -0.1 0.12 0.37 0.16
rather than with the ownership metrics. There are only few cases where ownership metrics have better correlation co-efficients than code metrics. This is a completely different result from the Bird et al. study where they found a more considerable correlation with ownership metrics. It therefore shows that, for the Java FLOSS projects, code metrics are better indicators of fault proneness than ownership metrics. Among ownership metrics correlation coefficients, the most notable is theTotal score, although the Major and Minor
scores can be roughly as good as theTotal score in some cases. This differs from the results in Bird et al.’s study where theMinor score was performing the best. Within the selected Java projects corpus, there are several cases where there was not a single minor developer, because there was not enough commits made to the project in the studied pe-riod. Hence, in Java FLOSS projects, thetotal number of developersseems to be a better indicator of fault-proneness than the number of minor developers. Regarding the code metrics, there is almost no difference between the size and complexity metrics.
4.2
File vs Package
Experiments where package granularity was used (Tables 2 and 4) exhibit more significant correlation than experi-ments where file granularity was used (Tables 3 and 5). Us-ing file granularity, the results do not contain any cases of correlation with a coefficient above 0.50 between a metric and the number of bugs, whereas using package granularity, there are 17 such cases. Therefore, for Java FLOSS projects, ownership metrics and code metrics should be computed at package granularity and not at file granularity. This con-firms the correctness of our initial intuition that Java classes (essentially, Java files) are too fine-grained entities compared to Windows binaries.
4.3
Whole Time Period vs Last Release
Computing ownership metrics over the last release of a project (Tables 2 and 3) show overall more significant cor-relations than metrics computed with the whole history of a project (Tables 4 and 5). With the last release period, we found 11 correlation coefficients above the 0.50 threshold and only 6 coefficients above this threshold with the whole history period. Note that, as stated above, all coefficients above 0.50 were found using package granularity.
Although the coefficients are generally more significant when analyzing the last release of the projects, there are few cases where, as discussed previously, there is not a sin-gle minor developer in the whole project, thus, causing ab-solutely no correlation. The cases when we did not observe any correlation were more common when we analyzed only the last release of the projects and when we used file gran-ularity. Analyzing only the last release of a project appears to be more promising than analyzing whole history of the project. However, for theMinor metric to provide useful information, the studied project needs to have a sufficient number of commits and developers working on the release under analysis, which is not true for some of the cases in the corpus projects.
4.4
Controlling for Size
Partial correlation controlled with the module size looks for a relationship between ownership metrics and bugs while canceling the effect of the relationships between the module
size and both the number of bugs and ownership metrics. When considering a package as a unit of module granular-ity (Tables 2 and 4), many tests produce statistically in-significant results, due to sample sizes that were not large enough. Statistically significant results show only a low, at most moderate, relationship between ownership metrics and module faults. With file granularity (Tables 3 and 5), as there are more data points, the number of statistically sig-nificant results is higher. Nevertheless, the correlations are weaker than with the package granularity. As a consequence, although we used a distinct statistical test, we were not able to confirm the results of Bird et al. on Java FLOSS projects regarding the relationship between ownership metrics and post-release bugs when controlling for the module size.
5.
THREATS TO VALIDITY
In this section, we discuss three standard threats to va-lidity with regards to our study: construct vava-lidity, external validity, and statistical conclusion validity.
Construct validityrefers to whether or not our actual mea-sures correspond to the conceptual ones. In our study, two main concepts are measured: post-release bugs and owner-ship metrics. The count of number of bugs we used in our study was extracted in previous research works by Jureczko et al. [13] and D’Ambros et al. [5] and made publicly avail-able. Both studies acknowledge threats to validity related to the construction of these corpora, particularly, the algo-rithms linking faults to their fixing commits. In both cases the algorithm analyzes commit messages to find a fault iden-tifier. When a fault identifier is found, the commit is tagged as a fixing commit, and all the classes modified in this com-mit are linked to the fault. Although this technique repre-sents the state of the art in the literature of linking faults to commits [24], it suffers from a poor recall as all the fix-ing commits that do not contain a reference to the fault are ignored. This fact threatens the validity of the study as it introduces a bias in the bugs included in the corpus [1].
Another threat related to the faults and identified by pre-vious research is the quality of the data stored in the issue tracker itself. According to Herzig et al. [10], many issues classified as faults in open source projects are in fact evo-lution or optimization requests. To ensure this, D’Ambros et al. performed a manual check on one of the projects of their corpus and found that most of the bugs were correctly classified. However, we do not know if such a verification was done on the corpus of Jureczko et al.
External validityanswers the question of whether the re-sults of a study can be generalized or not. A parameter which may threaten external validity is how the subject of the study (Java FLOSS projects in our case) were se-lected. As noted by D’Ambros et al., their corpus is com-posed of Eclipse projects, that possess a prominent indus-trial style. This observation may threaten the generalization of the results obtained with these projects to other open-source projects, as the development process may be differ-ent.
The second threat to external validity is linked to the pro-gramming language and the module granularities we used. All the projects in our corpus are written in Java, and package-level granularity is strongly linked to this language as it re-lies on one of its feature. To resolve this issue, we could include projects developed in different languages and use a language-agnostic approach to split projects into modules
(e.g., [4]). Ultimately, when trying to determine where an “ownership law” applies, the only way to test external valid-ity is by replicating the study with different projects and/or different settings.
Statistical conclusion validityrelates to the statistical sig-nificance (or statistical power) of the results. In the case of correlation tests, the statistical power of the results is expressed with ap-value, representing the probability that we find a type I error (i.e., finding a correlation when none exists). In the tables from the previous section, the correla-tion coefficient marked with a* had a p-value above 0.05, which means that for these particular results, there is more than a 5% chance to find the same scores by taking ran-dom values. However, we obtained a sufficient amount of statistically significant scores to provide reliable results.
6.
DISCUSSION
Bird et al. [2] found a strong correlation between owner-ship metrics and module faults in industrial projects whereas the results of our study of Java FLOSS projects are quite dif-ferent. This may be due to the inherent differences between industrial and FLOSS projects.
One main difference between industrial and FLOSS projects is in the distribution of workload between developers. In in-dustrial projects, the majority of developers spend 100% of their time on the project and contribute to it for several months. In FLOSS projects, there are two kinds of devel-opers: few “heroes,” who contribute to all modules of the project for a long time, and a number of minor contribu-tors, who develop a single feature or fix a bug and then stop their involvement with the project [21]. This appears to be a plausible explanation of the absence of minor developers when analyzing only the last release of the projects in our corpus. It is possible that, in the considered release, only “heroes” contributed to the project, or that the number of contributions per module was not enough to have minor de-velopers.
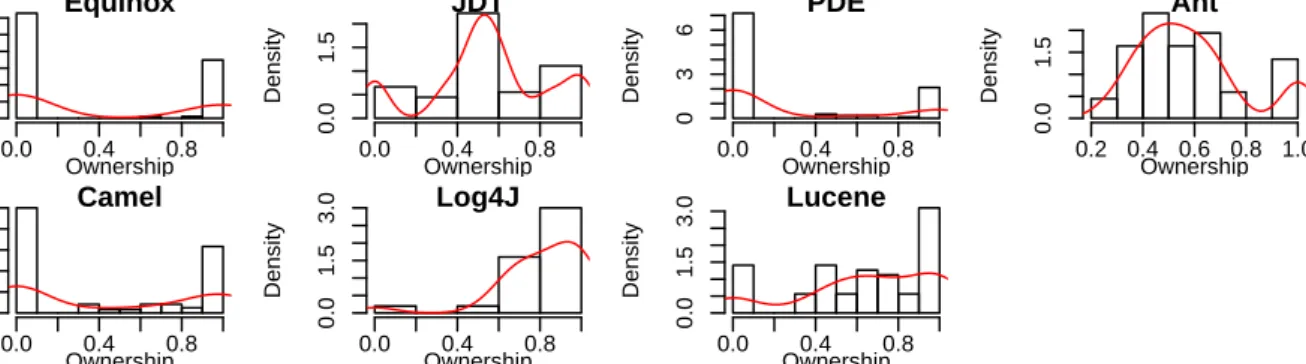
To verify our conjectures, we investigated the distribu-tions of ownership metrics and module faults to check if they have an impact on the correlation coefficients. Rather than investigating the distributions for both granularities and for both time periods, we chose to focus on the setting that pro-vided the best overall result, which is with the package-level metrics computed over the last release of the projects.
Figure 1 displays the distribution of theOwnershipscore in each project. There are two different types of distribu-tions for this metric. In the projects Equinox, PDE, Camel, Log4J, and Lucene, most of the packages with contribu-tions have a single “hero” who performs most of the com-mits, as shown by theOwnership values that are close to 1. This suggests that there is an “enforced ownership” in these projects, similar to the findings of Mockus et al. for the Mozilla project [17]. In the projects JDT and Ant, as most of theOwnershipvalues are around 0.50, it seems that there is no strong ownership on the packages, which would resemble the ownership pattern found by Mockus et al. on the Apache project [17].
Figure 2 shows the distribution of theMajor score in each project. The distribution of the number of major developers in the projects Equinox, PDE, and Camel is consistent with the previous observations, with most packages with no or a single major developer. Most packages of Log4J have either one or two major developers whereas JDT and Ant show
once again similar distributions, which here are lightly right-skewed. These distributions confirm the interpretation we made of the ownership metric, which is that two ownership patterns are found in the FLOSS projects of our corpus: projects with a strong ownership and projects withseveral major developers per module.
Figure 3 depicts the distribution of the Minor score in each project. Distributions for Equinox and PDE are omit-ted as the package of these projects do not have any mi-nor developer on their last release. Distributions for other projects are all heavily right-skewed.
Finally, Figure 4 displays the distribution of the number of bugs in each project. Distributions are heavily right-skewed for every project. The main difference between the projects is the maximum number of bugs, which ranges from about 50 bugs to 130 bugs per package.
As a consequence, it appears to us that the intrinsic nature of FLOSS projects is a major bias for measuring a correla-tion between ownership metrics and module faults. In other words, if a FLOSS project is developed by a single “hero” on each module, with “enforced ownership”, and if other de-velopers provide hardly any or no modifications then the ownership metrics are not a good indicator for quality.
7.
CONCLUSION AND FUTURE WORK
The objective of our study was to replicate the study of ownership metrics of Bird et al. on FLOSS projects. Such metrics are known to be good quality indicators and can be used to organize software development teams. Ownership metrics were validated, but only on Microsoft industrial soft-ware projects. We chose to validate them on FLOSS projects to check if they can be applied in this new context.
Surprisingly, the results we obtained are at odds with those obtained in the original study. In particular, we did not observe a strong correlation between ownership metrics and module faults in the seven popular Java FLOSS projects of our corpus. Furthermore, we observed that classical code metrics are better quality indicators, and no relationship was found between ownership metrics and module faults when controlling for module size.
As we were not able to reuse the definitions of modules from Bird et al. paper, we had to define modules in a differ-ent way. We considered modules to be either files or pack-ages. Trying both definitions, we discovered that the size of a software module is an important factor: file granularity is excessively fine, and package granularity is better but still not good enough to observe significant correlation.
We investigated the distribution of ownership in each project, and found that two different patterns emerge. On one hand, the projects with “hero” contributors, and on the other hand, the projects without “enforced ownership”, where there are several major developers in each module. No significant dif-ference in the correlation scores were observed between these two categories of projects.
As future work, we seek to improve measures of owner-ship for FLOSS projects. In the original study of Bird et al., major developers of a module were most of the time minor developers of another module. This might not be the case in FLOSS projects due to the organization of the open-source development where there is a clear distinction between the core developers of a project (“heroes”) and incidental tributors. Our hypothesis is that although incidental con-tributors do not have significant impact on the quality of a
Density 0.0 0.4 0.8 0 2 4 6 Equinox Ownership Density 0.0 0.4 0.8 0.0 1.5 JDT Ownership Density 0.0 0.4 0.8 0 3 6 PDE Ownership Density 0.2 0.4 0.6 0.8 1.0 0.0 1.5 Ant Ownership Density 0.0 0.4 0.8 0 2 4 Camel Ownership Density 0.0 0.4 0.8 0.0 1.5 3.0 Log4J Ownership Density 0.0 0.4 0.8 0.0 1.5 3.0 Lucene Ownership
Figure 1: Distribution of theOwnership metric perpackage, with the whole history of the project.
Density 0.0 0.5 1.0 1.5 2.0 0.0 2.0 Equinox Major Density 0 1 2 3 4 5 0.00 0.20 JDT Major Density 0.0 0.5 1.0 1.5 2.0 0.0 2.0 PDE Major Density 1 2 3 4 5 6 7 0.00 0.20 Ant Major Density 0 1 2 3 4 5 0.0 0.6 Camel Major Density 0.0 0.5 1.0 1.5 2.0 0.0 0.6 1.2 Log4J Major Density 0 1 2 3 4 0.0 0.4 0.8 Lucene Major
Figure 2: Distribution of the number ofmajor developers perpackage, with the whole history of the project.
Density 0 1 2 3 4 0.0 1.0 JDT Minor Density 0 2 4 6 0.0 0.4 0.8 Ant Minor Density 0.0 0.4 0.8 0 4 8 Camel Minor Density 0.0 0.5 1.0 1.5 2.0 0.0 1.0 Log4J Minor Density 0.0 1.0 2.0 3.0 0.0 1.0 Lucene Minor
Figure 3: Distribution of the number ofminor developers perpackage, with the whole history of the project. Equinox and PDE are not displayed as there is no minor developers in these projects.
Density 0 20 60 100 0.00 0.06 Equinox Bugs Density 0 20 40 60 0.00 0.06 JDT Bugs Density 0 10 20 30 40 0.00 0.10 PDE Bugs Density 0 40 80 120 0.00 0.03 Ant Bugs Density 0 20 60 100 0.00 0.06 Camel Bugs Density 0 20 60 100 0.000 0.030 Log4J Bugs Density 0 10 30 50 0.00 0.15 Lucene Bugs
project, they introduce noise to the measures of ownership.
8.
ACKNOWLEDGMENTS
The authors would like to thank anonymous reviewers for their helpful comments, and Darya Kurilova for her thor-ough review of the paper.
9.
REFERENCES
[1] C. Bird, A. Bachmann, E. Aune, J. Duffy, A. Bernstein, V. Filkov, and P. Devanbu. Fair and balanced?: bias in bug-fix datasets. InProceedings of the the 7th joint meeting of the European software engineering conference and the ACM SIGSOFT symposium on The foundations of software engineering, pages 121–130, 2009.
[2] C. Bird, N. Nagappan, B. Murphy, H. Gall, and P. Devanbu. Don’t touch my code!: examining the effects of ownership on software quality. InProceedings of the 19th ACM SIGSOFT symposium and the 13th European conference on Foundations of software engineering, ESEC/FSE ’11, pages 4–14. ACM, 2011. [3] S. R. Chidamber and C. F. Kemerer. A metrics suite
for object oriented design.IEEE Transaction on Software Engineering, 20(6):476–493, June 1994. [4] J. F. Cui and H. S. Chae. Applying agglomerative
hierarchical clustering algorithms to component identification for legacy systems.Information and Software Technology, 53(6):601–614, June 2011. [5] M. D’Ambros, M. Lanza, and R. Robbes. Evaluating
defect prediction approaches: a benchmark and an extensive comparison.Empirical Software Engineering, 17(4-5):531–577, 2012.
[6] K. E. Emam, S. Benlarbi, N. Goel, and S. N. Rai. The confounding effect of class size on the validity of object-oriented metrics.IEEE Trans. Software Eng., 27(7):630–650, 2001.
[7] J.-R. Falleri, C. Teyton, M. Foucault, M. Palyart, F. Morandat, and X. Blanc. The harmony platform. Technical report, Univ. Bordeaux, LaBRI, UMR 5800, Sept. 2013.
[8] M. Foucault, M. Palyart, J.-R. Falleri, and X. Blanc. Computing Contextual Metric Thresholds. In ACM, editor,29th Symposium On Applied Computing, Gyeongju, Republic of Korea, Mar. 2014.
[9] A. E. Hassan. Predicting faults using the complexity of code changes. InProceedings of the 31st
International Conference on Software Engineering, pages 78–88, 2009.
[10] K. Herzig, S. Just, and A. Zeller. It’s not a bug, it’s a feature: how misclassification impacts bug prediction. InProceedings of the 2013 International Conference on Software Engineering, pages 392–401, 2013. [11] T. Illes-Seifert and B. Paech. Exploring the
relationship of history characteristics and defect count: an empirical study. InProceedings of the 2008 workshop on Defects in large software systems, pages 11–15, 2008.
[12] T. Illes-Seifert and B. Paech. Exploring the
relationship of a file’s history and its fault-proneness: An empirical method and its application to open source programs.Information and Software Technology, 52(5):539–558, May 2010.
[13] M. Jureczko and L. Madeyski. Towards identifying software project clusters with regard to defect prediction. InProceedings of the 6th International Conference on Predictive Models in Software Engineering, PROMISE ’10, pages 9:1–9:10. ACM, 2010.
[14] M. G. Kendall and S. Alan. The advanced theory of statistics. vols. ii and iii. 1961.
[15] S. Matsumoto, Y. Kamei, A. Monden, K.-i. Matsumoto, and M. Nakamura. An analysis of developer metrics for fault prediction. InProceedings of the 6th International Conference on Predictive Models in Software Engineering, page 18, 2010. [16] T. Menzies, B. Caglayan, Z. He, E. Kocaguneli,
J. Krall, F. Peters, and B. Turhan. The promise repository of empirical software engineering data, June 2012.
[17] A. Mockus, R. T. Fielding, and J. D. Herbsleb. Two case studies of open source software development: Apache and mozilla.ACM Transactions on Software Engineering and Methodology (TOSEM),
11(3):309–346, 2002.
[18] R. Moser, W. Pedrycz, and G. Succi. A comparative analysis of the efficiency of change metrics and static code attributes for defect prediction. InACM/IEEE 30th International Conference on Software
Engineering, 2008. ICSE’08., pages 181–190, 2008. [19] J. C. Munson and S. G. Elbaum. Code churn: A
measure for estimating the impact of code change. In
Proceedings of the International Conference on Software Maintenance, 1998., pages 24–31, 1998. [20] F. Rahman and P. Devanbu. How, and why, process
metrics are better. InProceedings of the 2013 International Conference on Software Engineering, pages 432–441, 2013.
[21] F. Ricca and A. Marchetto. Are heroes common in FLOSS projects? InProceedings of the 2010 ACM-IEEE International Symposium on Empirical Software Engineering and Measurement, page 55, 2010.
[22] C. Teyton, J.-R. Falleri, F. Morandat, and X. Blanc. Find your library experts. In20th Working Conference on Reverse Engineering 2013, 14th-17th October 2013, Koblenz, Germany, pages 202–211. IEEE, 2013. [23] E. J. Weyuker, T. J. Ostrand, and R. M. Bell. Using
developer information as a factor for fault prediction. InProceedings of the Third International Workshop on Predictor Models in Software Engineering, page 8, 2007.
[24] T. Zimmermann, R. Premraj, and A. Zeller. Predicting defects for eclipse. InInternational Workshop on Predictor Models in Software
Engineering, 2007. PROMISE’07: ICSE Workshops 2007, page 9, May 2007.