i
TECHNOLOGY SOLUTIONS
FOR WIND INTEGRATION IN ERCOT
INTERIM TECHNOLOGY PERFORMANCE REPORT #1
Rev 0 Chg 1
September 30, 2013SUBMITTED FOR COOPERATIVE AGREEMENT DE-OE0000194
PREPARED FOR U. S. Department of Energy National Energy Technology Laboratory
PREPARED BY
Center for the Commercialization of Electric Technologies 114 West 7th Street, Suite 1210
ii
Disclaimer
This report was prepared as an account of work sponsored by an agency of the United States Government. Neither the United States Government nor any agency thereof, nor any of their
employees, makes any warranty, express or implied, or assumes any legal liability or responsibility for the accuracy, completeness, or usefulness of any information, apparatus, product, or process disclosed, or represents that its use would not infringe privately owned rights. Reference herein to any specific commercial product, process, or service by trade name, trademark, manufacturer, or otherwise does not necessarily constitute or imply its endorsement, recommendation, or favoring by the United States Government or any agency thereof. The views and opinions of authors expressed herein do not necessarily state or reflect those of the United States Government or any agency thereof.
Acknowledgment
This material is based upon work supported by the Department of Energy (DOE) under Award Number DE-OE-0000194.
iii
Revision History
Version Identifier Date of Issue Summary of Changes Rev 0 Chg 1 December 30, 2013 Incorporated the following changes:
• Section 2.2 – added organizational chart • Section 2.3.2 – moved quantities to Section 4
• Section 2.3.2.3 – moved discussion of technical hurdles to Section 4
• Section 2.3.4 – added this section with key project milestones
• Section 2.3.5 – add this section with key decision points • Section 3.1.1.2 – moved status discussion to Section 4 • Section 3.1.1.3 – moved status discussion to Section 4 • Section 3.4.1 – moved status discussion to Section 4 • Section 3.5.1 – moved status discussion to Section 4 • Section 5 – added this section for primary CCET and
DOE contact information
• Appendix A – added this appendix for most recent build metrics
Rev 0 Chg 0 September 30, 2013 Original Technology Performance Report submitted to DOE This document contains information that is as complete as possible. Where final numerical values or specification references are not available, best estimates are given and noted To Be Reviewed (TBR). Items which are not yet defined are noted To Be Determined (TBD). The following table summarizes the TBD/TBR items in this revision of the document, and supplements the revision notice above.
iv
Table of Contents
1.
INTRODUCTION ... 2
2.
SCOPE ... 3
2.1 Overall Project Description ... 3
2.2 Team Members ... 3
2.2.1 CCET ... 4
2.2.2 DOE-Funded Partners ... 5
2.2.2.1 BV Services ... 5
2.2.2.2 Comverge ... 5
2.2.2.3 Electric Power Group ... 5
2.2.2.4 Frontier Associates ... 5
2.2.2.5 Group NIRE ... 6
2.2.2.6 Pecan Street ... 6
2.2.2.7 Southwest Research Institute ... 6
2.2.2.8 Texas Tech University ... 7
2.2.3 Cost Share Partners ... 7
2.2.3.1 American Electric Power/Electric Transmission Texas ... 7
2.2.3.2 CenterPoint Energy ... 7
2.2.3.3 Electric Reliability Council of Texas ... 8
2.2.3.4 Oncor... 8
2.2.3.5 Sharyland Utilities ... 8
2.2.3.6 TXU Energy ... 8
2.2.4 Other Partners Providing Technical Assistance or Oversight ... 9
2.2.4.1 Frito Lay ... 9
2.2.4.2 Golden Spread Electric Cooperative ... 9
2.2.4.3 South Plains Electric Cooperative ... 9
v
2.2.5.1 CCET Board of Directors ... 9
2.2.5.2 CCET PM Board ... 9
2.3 Project Overview ... 9
2.3.1 Project Location ... 10
2.3.2 Project Objectives ... 11
2.3.2.1 Demonstrating Wide-Area Grid Monitoring and Visualization using Synchrophasors.. 11
2.3.2.2 Demonstrating Aspects of the Future Smart Grid Residential Community ... 12
2.3.2.3 Demonstrating Demand Response by Leveraging the Smart Meter Texas Portal ... 12
2.3.3 Project Timeline ... 13
2.3.4 Key Project Milestones ... 13
2.3.5 Key Decision Points ... 14
2.4 Major Demonstration Components and Smart Grid Technologies and Systems ... 15
2.4.1 Synchrophasor Monitoring, Visualization, and Event Reporting ... 15
2.4.2 Synchrophasor Security Fabric ... 17
2.4.3 Residential Circuit Monitoring ... 17
2.4.4 Residential TOU Pricing Trial ... 18
2.4.5 Residential Demand Response ... 19
2.4.6 Distribution-Level Battery Energy Storage System (BESS) ... 21
2.4.7 Fast Response Regulation Service with Fleet Electric Vehicles ... 25
2.5 Anticipated Project Benefits ... 26
2.6 Basic Interoperability and Cyber Security Approach ... 27
2.6.1 Interoperability ... 27
2.6.2 Cyber Security ... 27
2.7 Interactions with Key Stakeholders ... 28
3.
TECHNICAL APPROACH ... 29
3.1 Synchrophasor Monitoring, Visualization, and Event Reporting ... 29
3.1.1 Project Plan ... 29
3.1.1.1 Key Tasks ... 29
3.1.1.2 ERCOT Synchrophasor Network ... 30
vi
3.1.2 Data Collection and Benefits Analysis ... 31
3.2 Synchrophasor Security Fabric ... 32
3.2.1 Project Plan ... 32
3.2.2 Data Collection and Benefits Analysis ... 34
3.3 Residential Circuit Monitoring ... 35
3.3.1 Project Plan ... 35
3.3.2 Data Collection and Benefits Analysis ... 35
3.4 Residential TOU Pricing Trial ... 36
3.4.1 Project Plan ... 36
3.4.2 Data Collection and Benefits Analysis ... 41
3.5 Residential Demand Response ... 43
3.5.1 Project Plan ... 43
3.5.2 Data Collection and Benefits Analysis ... 45
3.6 Distribution-Level Battery Energy Storage System ... 46
3.6.1 Project Plan ... 46
3.6.2 Data Collection and Benefits Analysis ... 51
3.7 Fast Response Regulation Service with Fleet Electric Vehicles ... 51
3.7.1 Project Plan ... 51
3.7.2 Data Collection and Benefits Analysis ... 52
4.
PERFORMANCE RESULTS ... 53
4.1 Synchrophasor Monitoring, Visualization, and Event Reporting ... 53
4.1.1 Operation of Smart Grid Technologies and Systems ... 53
4.1.1.1 PMU Monitoring Coverage ... 53
4.1.1.2 Baselining Study ... 55
4.1.1.3 Data Quality Study ... 56
4.1.1.4 Lessons Learned from Mitigating PMU Data Loss ... 56
4.1.1.5 Event Analysis of Generation Outages ... 58
4.1.1.6 Event Analysis of Wind Interactions ... 59
4.1.1.7 Requirements for Control Room and Network Production Upgrades... 59
vii
4.1.1.9 Slow Scan Synchrophasors ... 61
4.1.1.10 Synchrophasor Use Cases ... 62
4.1.2 Impact Metrics and Benefits Analysis ... 63
4.1.3 Stakeholder Feedback ... 64
4.2 Synchrophasor Security Fabric ... 64
4.2.1 Operation of Smart Grid Technologies and Systems ... 64
4.2.2 Impact Metrics and Benefits Analysis ... 64
4.2.3 Stakeholder Feedback ... 65
4.3 Residential Circuit Monitoring ... 65
4.3.1 Operation of Smart Grid Technologies and Systems ... 65
4.3.2 Impact Metrics and Benefits Analysis ... 65
4.3.3 Stakeholder Feedback ... 65
4.4 Residential TOU Pricing Trial ... 65
4.4.1 Operation of Smart Grid Technologies and Systems ... 65
4.4.2 Impact Metrics and Benefits Analysis ... 72
4.4.3 Stakeholder Feedback ... 72
4.5 Residential Demand Response ... 73
4.5.1 Operation of Smart Grid Technologies and Systems ... 73
4.5.2 Impact Metrics and Benefits Analysis ... 76
4.5.3 Stakeholder Feedback ... 76
4.6 Distribution-Level Battery Energy Storage System ... 76
4.6.1 Operation of Smart Grid Technologies and Systems ... 76
4.6.2 Impact Metrics and Benefits Analysis ... 80
4.6.3 Stakeholder Feedback ... 80
4.7 Fast Response Regulation Service with Fleet Electric Vehicles ... 80
4.7.1 Operation of Smart Grid Technologies and Systems ... 80
4.7.2 Impact Metrics and Benefits Analysis ... 80
4.7.3 Stakeholder Feedback ... 81
5.
CONTACTS ... 82
viii
ix
Figures and Tables
Figure 1. ERCOT and SPP Regions of Texas ... 10
Figure 2. CCET Project Phase III Timeline ... 13
Figure 3. SMT Planning Project Objective ... 20
Figure 4. BESS Installed at the RTC ... 21
Figure 5. SWiFT Facility at Reese Technology Center ... 22
Figure 6. Aerial View of the BESS and the SWiFT Facility Turbines ... 23
Figure 7. Reese Technology Center Electrical Layout ... 24
Figure 8. BESS Block Diagram ... 24
Figure 9. Current and Planned TTU PMU Locations ... 31
Figure 10. Basic Synchrophasor Network and the Security Fabric-enabled Network at TTU ... 34
Figure 11. Web Portal’s Display of Representative Pricing Trial Information for One TOU Participant .. 37
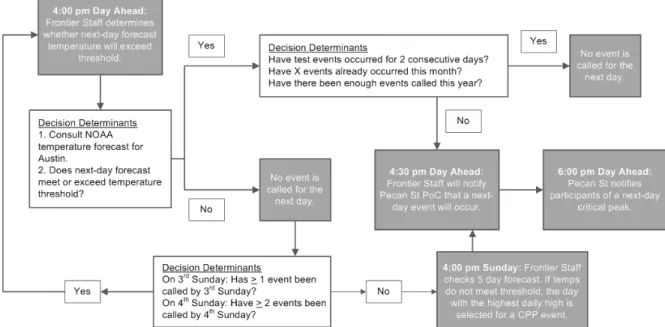
Figure 12. Flowchart for Calling Next-Day Peak Events ... 38
Figure 13. TOU Group Text Message ... 41
Figure 14. CCET Objectives for Phases 1 and 2 ... 44
Figure 15. Basic Circuit of DP Model ... 47
Figure 16. Accurate Battery Model Taken from Chen, et al ... 48
Figure 17. Battery Cell Model in PSCAD ... 48
Figure 18. Controls for the Battery Cell Model in PSCAD ... 49
Figure 19. Output of Battery Cell Model in PSCAD ... 49
Figure 20. PSCAD Model of the BESS ... 50
Figure 21. A Single Rack of the BESS with 913 V, 1138 Ah ... 50
Figure 22. PMU Locations in Texas ... 54
Figure 23. ERCOT PMU Data Quality and Availability ... 57
Figure 24. Synchrophasor Upgrade Diagram ... 60
Figure 25. Relative Phase Angle Dial Illustration ... 61
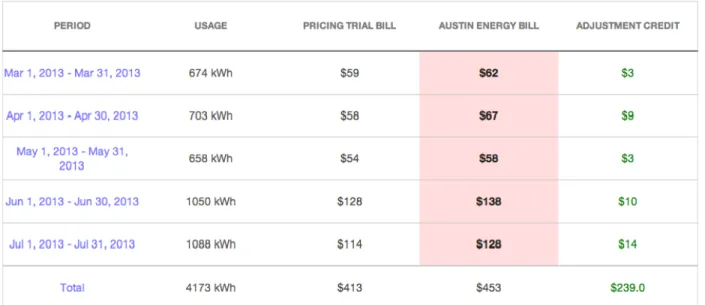
Figure 26. Adjustment Credit Earnings Distribution ... 66
x
Figure 28. June 2013 Overall Hourly Usage Profile in Percentage ... 68
Figure 29. March to May 2013 Average Daily Electric Car Usage Pattern in Percentage ... 68
Figure 30. June 2013 Average Daily Electric Car Usage Pattern in Percentage ... 69
Figure 31. Second Critical Peak Day (26 June) Load Pattern Comparison ... 70
Figure 32. Sixth Critical Peak Day (1 August) Load Pattern Comparison ... 70
Figure 33. Repeat of Phase 1 ... 74
Figure 34. Daily Averages for April 2013 ... 77
Figure 35. Daily Averages for May 2013 ... 77
Figure 36. Daily Averages for June 2013 ... 77
Figure 37. Alstom Turbine Daily Average Power during July 2013 ... 78
Figure 38. SWiFT Turbine Daily Average Power during July 2013 ... 78
Figure 39. Alstom Turbine Daily Average Power during August 2013 ... 79
Figure 40. SWiFT Turbine Daily Average Power during August 2013 ... 79
Figure 41. Daily Average Power Production for the Alstom and SWiFT Turbines – July 2013 ... 79
Figure 42. Daily Average Power Production for the Alstom and SWiFT Turbines – August 2013 ... 80
Table 1. Key Project Milestones ... 13
Table 2. Goals and Thresholds for Calling Peak Days ... 39
Table 3. Ratings for BESS ... 51
Table 4. Revised Thresholds for Calling Peak Days... 66
Table 5. Example of Critical Peak Pricing Day kW Savings Calculation (Day Matching Method) ... 71
Table 6. Estimated kW Savings for First 11 CPP Days ... 71
1
Preface
The Center for the Commercialization of Electric Technologies (CCET) has prepared this Technology Performance Report (TPR) for its smart grid regional demonstration project in response to specified DOE reporting requirements. The format of this document follows DOE’s TPR Guidelines dated June 17, 2011.
As the first interim report, this TPR is based on less data than will be available for subsequent TPRs, including the final Technical Report which will be delivered at the end of the project. Although the original goal was to collect at least 24 months of data on all aspects of the CCET project, certain components such as the synchrophasor monitoring and visualization efforts have been collecting data from almost Day 1 while newer efforts, such as demonstration of unique cyber security protection schemes for synchrophasor networks, are still being implemented so data collection efforts have been limited. As a consequence, some reported results will have a higher level of certainty while others will be reported as initial findings based on data sets for limited durations.
Readers should view all findings in this report as preliminary and, at best, indicative of what the final results and lessons learned may be. These preliminary results may change due to additional data collection over longer periods of time, and also changes in the demonstration particulars over time.
2
1. INTRODUCTION
This document represents the first interim TPR for the CCET Smart Grid Regional Demonstration Project (SGRDP) entitled, “Technology Solutions for Wind Integration in Electric Reliability Council of Texas,” commonly known as Discovery Across Texas. The CCET project is partially funded by the DOE cooperative agreement DE-OE0000194 and partially funded by various CCET team members and ERCOT stakeholders.
This interim TPR summarizes the CCET SGRDP as of September 30, 2013 and includes information on the project technical components, the respective data collection efforts, the cost and benefit methodologies being applied to determine the value proposition, summaries of the key analytic results, and lessons learned as of that date.
3
2. SCOPE
This section provides relevant information on the overall project, its objectives, the major demonstration components and their relevant smart grid technologies and systems being
demonstrated, the anticipated benefits, the team members, the basic approach for interoperability and cyber security, and interactions with project stakeholders.
2.1
Overall Project Description
This project represents a multi-faceted synergistic approach to managing fluctuations in wind power in the large Electric Reliability Council of Texas (ERCOT) transmission grid through better system
monitoring capabilities, enhanced operator visualization, and improved load management. It will demonstrate the use of synchrophasor technology to assist in better determining grid operating status and margins that avoid either conservative operating margins or grid instability when moving remote wind resources through the ERCOT transmission grid to consumers. By taking advantage of this technology, ERCOT grid operators will be better able to accommodate wind resource variability, unexpected transmission line outages, or instability developments. As necessary, ERCOT operators, transmission and distribution service providers (TDSPs) and retail electric providers (REPs) will leverage existing capabilities, including the Smart Meter Texas (SMT) Portal, to call upon controllable home area network (HAN) loads as part of initiated demand response (DR) events via the advanced meter systems (AMS) of utilities. These HANs will be part of an advanced integrated smart grid community of the future that combines distribution level energy storage systems and homes equipped with smart meters, 3-5 kW solar photovoltaic (PV), load-interruptible DR appliances, efficient building envelope standards, and electric vehicle (EV) charging to demonstrate consumer responsiveness to variable electric pricing schemes and an innovative DR program. All together, this project will help define a new business model for managing wind resources through complementary residential solar energy resources, DR, and storage by validating the value of combined yet separable smart grid components. ERCOT and other market participants will eventually be able to utilize this project’s collection of tools to shed load to meet reliability needs across the entire interconnection in response to wind lapses and related grid disturbances.
2.2
Team Members
This CCET project represents a collaborative effort on the part of four ERCOT region utilities, electric cooperatives, a large Texas REP, a university, an EV fleet owner, third-party vendors and technology firms. Additionally, this project benefits from advice and guidance provided by the CCET Board of Directors, a Project Management Board, and ERCOT, all of which comprise key players in the Texas electric market. The team member descriptions are provided below, and organized by those receiving DOE funds, those providing cost share, and others that provide technical advice and oversight.
4
To address the project goals, there are technical teams addressing three primary demonstration components: synchrophasors, future smart grid community, and the SMT Portal. The high level team organizational structure is shown below.
CCET PMO
CCET BOARD
CCET PM
Synchrophasor Future Community
CCET PM Board
Accounting
Pecan Street CenterPoint TTU Group NIRE Frontier SPEC EPG AEP/ETT ERCOT Oncor Sharyland SMT Portal TXU EnergyBlack & Veatch Comverge SwRI Samsung Alstom GSEC TTU Xtreme Power SwRI 2.2.1 CCET
The CCET is a consortium of utilities, retail electric providers, and technology companies dedicated to developing new capabilities that will improve grid operations in Texas, and CCET has performed a number of projects in the ERCOT region. Most project team members are members of CCET and have worked together on many projects over the years. The CCET President serves as the Project Manager (PM) and is fully responsible for the successful execution of this project. He is governed by a Board of Directors that approves all projects. The CCET PM has access to Board members for assistance and support, and reports monthly to the Board on the programmatic status of the project. The CCET PM also has access to a special PM Board formed by technical leaders of the Board companies, and meets monthly with this group for advice and guidance on the conduct of this project.
5 2.2.2 DOE-Funded Partners
2.2.2.1 BV Services
For this project, BV Services is assisting CCET and TXU Energy with the SMT Planning portion, which involves dual-path demand response services. BV Services is planning and managing this part of the project as well as leading technical discussions and workshops regarding solution configurations, program design, testing approaches, and impacts to customers. BV Services resources have been working with TXU Energy and Comverge to support enhancements to the iThermostat program for the past couple of years.
2.2.2.2 Comverge
Comverge is a CCET member that provides intelligent energy management solutions to utilities and commercial and industrial companies. Comverge worked with TXU Energy to develop its current Brighten® iThermostat program for residential and small commercial customers, which includes
installing programmable thermostats and gateways, and providing software to manage the registration, installation, operation, and support of that program. In this project, Comverge is participating in design, development, and testing of demand response solutions.
2.2.2.3 Electric Power Group
Electric Power Group (EPG), a CCET member, serves as the Team Lead for the Synchrophasor
component. They have been involved in synchrophasor-related activities for many years in support of the Western and Eastern Interconnections. For this project, EPG provides software, including the Real Time Dynamics Monitoring System (RTDMS) and the Phasor Grid Dynamics Analyzer (PGDA), and professional and consulting services. They also have a phasor data concentrator (PDC), which may be deployed as well. EPG is also closely involved in the development and implementation of ERCOT’s synchrophasor monitoring system, and will continue to provide that support.
Recently, EPG formed an alliance with Intel/McAfee to investigate a new cyber security capability that should greatly enhance the protection of data streams from PMUs and PDCs to the grid operator. As part of this project, EPG will integrate that new capability into a PDC and then demonstrate its ability to provide enhanced protection.
2.2.2.4 Frontier Associates
Frontier Associates, a CCET member, has been providing data collection, analysis, and various
assessments for key utility players in Texas, including ERCOT. For this project, they are responsible for the overall data collection and analysis planning, the methodology for the pricing experiments, and analysis of electrical data collected by CenterPoint Energy on residential distribution service lines in Houston. They developed the metrics and benefits reporting plan, and worked closely with DOE to define the data metrics, formats, etc. for those programs. They are helping to design the consumer pricing experiments, and will be providing the majority of data analysis, economic value assessments,
6
and other inputs to the TPRs. They also provide advice and guidance to other project members performing data collection and analysis.
2.2.2.5 Group NIRE
Group NIRE, a CCET member, is a clean energy development company that provides project
development, finance and consulting services. It is currently developing wind projects and working with several renewable energy manufacturers of original equipment and component to commercialize new products and technologies. Group NIRE is affiliated with the National Institute for Renewable Energy and with the National Wind Resource Center.
Although Group NIRE does receive some minimal DOE funding, it is also a major cost share contributor for this project, and is providing facilities for field testing and validation of various wind turbines at the RTC in Lubbock, Texas. For this project, Group NIRE is facilitating access to the wind turbines and managing the installation of a utility-grade battery energy storage system that will be tested in various functional roles.
2.2.2.6 Pecan Street
Headquartered at The University of Texas at Austin, Pecan Street Inc. is a nonprofit research and development organization focused on developing and testing advanced technology, business models, and customer behavior surrounding advanced energy management systems. Pecan Street is focused on advancing understanding and solutions addressing utility system reliability, climate change, renewable energy integration, and customer needs and preferences. Its specific research expertise consists of creating, managing, protecting, analyzing, and responsibly sharing the highest quality original research data on how customers use electricity, natural gas, and water in their homes and businesses. For the CCET project, Pecan Street is receiving DOE funds and is also a significant cost share partner. It will be involved in facilitating new electricity pricing models, electric vehicle research, and sub-circuit level energy use data collection among select volunteer participants located in Austin's Mueller community. 2.2.2.7 Southwest Research Institute
Southwest Research Institute (SwRI), a CCET member, is a large independent, nonprofit organization located in San Antonio, Texas, that provides applied research and development for both government and commercial clients. It has 11 technical divisions that offer a wide range of technical expertise and services in such areas as chemistry, space science, nondestructive evaluation, automation, engine design, mechanical engineering, electronics, and automation and data systems.
For the CCET project, SwRI is providing project management office (PMO) support including the preparation of required management and technical reports for CCET and DOE. SwRI is also leading the effort to provide fast response regulation service (FRRS) to ERCOT using fleet EVs.
7
2.2.2.8 Texas Tech University
Texas Tech University (TTU) is a teaching and research institution located in Lubbock, Texas. It is home to the Wind and Science Engineering (WiSE) Research Center, which is focused on how to efficiently harvest wind energy and mitigate wind-related damage. It is the only university in the nation that offers degree programs, from Bachelor to Ph.D., in wind energy related studies.
For the CCET project, TTU is providing its exceptional knowledge, expertise and analytic skills to facilitate the integration of wind turbines located at the Reese Technology Center (RTC) with a utility-scale
battery system along with subsequent analysis of battery functionality to support dynamic, variable energy sources like wind. TTU is also working with several local electric cooperatives to install a synchrophasor network in the Texas Panhandle portion of the SPP. This network will serve to augment the data from the ERCOT network for the purposes of theory and model development and validation. The network will additionally be utilized as a test-bed for the cybersecurity fabric demonstration, where TTU cybersecurity researchers can provide an independent analysis of the system.
2.2.3 Cost Share Partners
2.2.3.1 American Electric Power/Electric Transmission Texas
American Electric Power (AEP) is a Board member of CCET and has been actively involved in the deployment of synchrophasor components. AEP is committing resources to this effort and is working collaboratively with ERCOT, Oncor, Sharyland Utilities, and Electric Power Group to accomplish the objectives of the synchrophasor component. AEP has installed PMUs, provides phasor data to ERCOT, and has determined the best utilization of phasor data for management of AEP stations and the ERCOT grid.
Electric Transmission Texas (ETT) is a joint venture between subsidiaries of American Electric Power and MidAmerican Energy Holdings Company. ETT owns and operates transmission facilities within the ERCOT region of Texas. For this project, ETT is installing a number of PMUs and providing the phasor data to ERCOT.
2.2.3.2 CenterPoint Energy
CenterPoint Energy is the TDSP for the Houston area, and a Board member of CCET. CenterPoint is completing its smart grid investment grant that provided for the deployment of smart meters and a distribution automation system in their service territory. As part of this project, they have installed a number of circuit monitoring devices with the intent of comparing load shape curves among two similar neighborhoods, one with high-efficiency homes and solar, and another without solar. They are
collecting data from those devices, and will provide input to the TPRs on power usage, load profiles, and voltage levels for both communities. By comparing similarly sized homes at the two neighboring
subdivisions, analysis will show the extent to which there is a sustained decrease in power usage and reduction in peak demand. CenterPoint will also compare the voltage levels at the two locations to determine if the levels are within normal range and if they are at a steady level or if they fluctuate.
8
2.2.3.3 Electric Reliability Council of Texas
The Electric Reliability Council of Texas (ERCOT) manages the flow of electric power to 23 million Texas customers - representing 85 percent of the state's electric load. As the independent system operator for the region, ERCOT schedules power on an electric grid that connects 40,500 miles of transmission lines and more than 550 generation units. ERCOT also performs financial settlement for the competitive wholesale bulk-power market and administers retail switching for 6.7 million premises in competitive choice areas. ERCOT is a membership-based 501(c) (4) nonprofit corporation, governed by a board of directors and subject to oversight by the Public Utility Commission of Texas and the Texas Legislature. ERCOT's members include consumers, cooperatives, generators, power marketers, retail electric providers, investor-owned electric utilities (transmission and distribution providers), and municipal-owned electric utilities.
The ERCOT serves as an advisor on the CCET Board of Directors, and is providing synchrophasor analysis and event reporting for this CCET project. The staff produces a daily PMU performance report that is distributed to members of ERCOT, and the CCET synchrophasor team. They also are introducing the capabilities of synchrophasor technology to organized ERCOT stakeholder committees that are important to the implementation of the technology for active grid management.
2.2.3.4 Oncor
Oncor, a CCET Board member, is a large transmission and distribution utility and also a key transmission avenue for wind energy from West Texas to other parts of the ERCOT grid for consumers. Oncor has been actively engaged in ongoing efforts to establish a phasor network within the ERCOT grid, providing PMU installations and communications for streaming data to ERCOT. Oncor has also supported the project’s SMT planning efforts by conducting testing of various end use components.
2.2.3.5 Sharyland Utilities
Sharyland Utilities, a CCET member, is involved in the synchrophasor component of this project. Sharyland is implementing PMUs at three locations, providing a phasor data stream to ERCOT, and determining the best use of phasor data for station management and the ERCOT grid.
2.2.3.6 TXU Energy
In 2002, the deregulated electricity market opened in Texas. At that time, TXU Energy began offering service as a certificated retail electric provider. One of their hallmark products is an intelligent
thermostat and accompanying gateway that has been installed in thousands of consumer homes across Texas, and provides consumers with broadband access to the thermostats. For the CCET project, TXU Energy is undertaking a demand response program that involves sending load control signals through the Smart Meter Texas portal to the home thermostats and gateways. These devices will now be provisioned to the consumer smart meters so that they receive the signals via the AMS networks as well as via the residential broadband networks. TXU Energy is a Board member of CCET.
9
2.2.4 Other Partners Providing Technical Assistance or Oversight 2.2.4.1 Frito Lay
Frito Lay has a distribution facility with 11 fleet EVs that make deliveries during the nighttime and morning hours up until noon, and are therefore idle during the remainder of the day. For the FRRS portion of the project, Frito-Lay is providing the EV fleet and charging infrastructure to support this demonstration.
2.2.4.2 Golden Spread Electric Cooperative
The Golden Spread Electric Cooperative (GSEC) is a consumer-owned public utility that provides electric service for its rural distribution cooperative members. It serves consumers located in the Oklahoma Panhandle and an area covering 24 percent of Texas land area including the Panhandle, South Plains, and Edwards Plateau Regions. It provides the power and service for the South Plains Electric
Cooperative which is involved in this project. For the CCET project, GSEC is deploying a number of PMUs to provide comparative data on their area of Texas with respect to wind events.
2.2.4.3 South Plains Electric Cooperative
The South Plains Electric Cooperative (SPEC) is a local, consumer-owned electric utility headquartered in Lubbock, Texas and serving the South Plains of West Texas. For this project, SPEC owns and operates the 1MW/1MWh battery energy storage system purchased by the project and located at the RTC. 2.2.5 CCET Advisory Boards
2.2.5.1 CCET Board of Directors
The CCET Board of Directors provides oversight of the project and assistance as needed. The Principal Investigator for the project is also the President and Chief Operating Officer of CCET and reports to the Board.
2.2.5.2 CCET PM Board
For this project, CCET has created a Project Management (PM) Board from member CCET companies with specialized technical expertise in the project focus areas. The members of this Board provide unbiased, objective evaluations and assessments of all technical aspects of the project. This Board meets monthly with the Principal Investigator and his team to review the technical project status, and provide advice and assistance on the direction of the project. Additionally, as the need arises, this Board is convened to address specific technical issues or risks and provide early resolutions.
2.3
Project Overview
Texas currently has the largest wind generation capability in the United States. With a growing electric load, the region served by the ERCOT grid reached a peak load of 68,305 MW in 2011. At the end of 2012, wind generation capacity of 10,407 MW represented 13% of overall generation capacity, and wind
10
had supplied 9.2% of total energy to the ERCOT grid. With the completion of new transmission lines into West Texas and the Panhandle area of Texas, the capacity of wind generation can grow to 18,500 MW, and a significant number of interconnection applications are on file with ERCOT for wind farms that would take advantage of this new transmission capability. Further, wind farms also are being added in the coastal areas of South Texas, presenting somewhat different power profiles to system operators than the wind from West Texas. All wind farms are distant from the main load centers, and present grid management challenges for ERCOT’s system operators in accommodating both grid reliability and generation dispatch related to wind variability.
The vulnerability to the Texas electric grid posed by additional growth in wind generation underscores the need to establish new response mechanisms to wind variability. This project represents a multi-faceted synergistic approach to managing fluctuations in wind power in the large ERCOT transmission grid through better system monitoring capabilities, enhanced operator visualization, and improved load management.
2.3.1 Project Location
This project is primarily being performed in the ERCOT region, although the utility-scale battery and some additional synchrophasor efforts are being performed in the Northwest area of Texas that is actually in the Southwest Power Pool (SPP) region. These regions are shown in the figure below.
11
Texas is unique among other regions with its high penetration of remote wind generation, one interconnection and one Independent System Operator (ISO), ERCOT. Texas includes a deregulated energy market for the large investor-owned segment, with TDSPs providing regulated wires and meter services to customers, and competitive REPs servicing and billing these customers. Texas not only leads the nation in wind generation plans, but also in the implementation of advanced metering systems. The most recent tally for the ERCOT region as of July 2013 indicates more than 6.5 million smart meters have been deployed, and there are plans for installation of about 250,000 more smart meters in the next year. Another unique aspect of Texas is the availability of the Smart Meter Texas (SMT) Portal which hosts the 15-minute incremental meter data from those smart meters and is used for settlement purposes as well as permitting customers to view and share their current and historical electrical usage information, and provision home area network devices to their smart meter.
2.3.2 Project Objectives
This project will demonstrate that Texas, and the rest of the nation, can manage increasing levels of wind power through smart grid technologies applied at the system operator level through wide-area visualization; related operator control through DR as a resource utilizing AMS capability; wind variability control through energy storage; and application of DR, distributed generation (DG), and load curtailment at an advanced smart grid community.
2.3.2.1 Demonstrating Wide-Area Grid Monitoring and Visualization using Synchrophasors
The Synchrophasor Team was originally comprised of ERCOT, TDSPs, and Electric Power Group (EPG). This group had already recognized the need to monitor the grid variability due to wind resources and had deployed phasor measurement units (PMUs) at three locations. The project permitted this group to expand this effort, initially with a plan to increase the number of locations to 16. Internal to ERCOT, the data management, visualization, and post-event analysis software has been upgraded to a commercial readiness status. PMU data is providing new tools and insights to grid operations personnel who support the grid operators, and will eventually provide a much-needed alert capability for the grid operator.
Additionally, this team has been expanded to include Golden Spread Electric Cooperative (GSEC), which is deploying and managing other PMUs in the northern Texas panhandle area (4 to date), and Texas Tech University (TTU), which is providing technical and operational assistance and data analysis. The overall role of this component is to stream data from the PMUs to the respective TDSPs that then furnish it to the grid operator (ERCOT), and then demonstrate the benefits of synchrophasor monitoring and analysis in effectively managing power reliability associated with variable wind power resources. This requires a collaborative effort to implement and maintain the supporting infrastructure, develop effective monitoring metrics, and identify, design, test, and deploy tools and procedures to improve overall grid operations and control based on the synchrophasor data system.
EPG brings considerable experience with synchrophasor tools and applications, and the underlying PMU data acquisition, communications and management, from its projects in the Eastern and Western
12
Interconnections of North America. Each of the TDSPs includes representatives with power system engineering backgrounds, knowledge of PMUs and synchrophasor technology, and specific knowledge of the ERCOT grid. ERCOT brings the unique perspective of operating the integrated smart grid across 85% of Texas. The addition of GSEC will provide measurement capabilities for adjoining areas of Texas that are part of the Southwest Power Pool (SPP), and specifically measurement and analysis of various wind turbines installed at the TTU Wind Science and Engineering (WiSE) Research Center.
2.3.2.2 Demonstrating Aspects of the Future Smart Grid Residential Community
The Future Community Team originally comprised entities in an area North of Houston, and their goal was to demonstrate the benefits of equipping a solar community with a variety of smart grid
technologies, including HAN devices, home energy management (HEM) systems, residential storage systems, and plug-in electric vehicles (PEVs), and then perform various electric pricing experiments to measure consumer behavioral changes in response to variable pricing schemes. This project team was restructured in 2012, and now leverages an existing smart grid community equipped with similar technologies in Austin. However, the intent of conducting consumer pricing experiments remains the same, and this team has planned, recruited participants for, and executed the experiments, and is continuing to collect and analyze the data from ongoing pricing experiments.
Additionally, the original project envisioned a large battery system to support community assets such as a water treatment plant and potentially community PEV charging stations. This battery, which was recently installed at the RTC in Lubbock, is now being used in conjunction with adjacent wind turbines to demonstrate a variety of ways that utility-grade energy storage systems can support the integration of wind into the electric grid.
Finally, the TDSP in the Houston area installed a number of monitoring devices to assess the differences between two similar neighborhoods, one with solar and one without solar. This data continues to be collected and analyzed.
2.3.2.3 Demonstrating Demand Response by Leveraging the Smart Meter Texas Portal
The SMT Portal Team initially envisioned a planning effort to define additional functionality for
enhancing the SMT Portal. As the SMT Portal has continued to be enhanced, this Team has expanded its focus to utilize the SMT Portal to support demand response (DR) initiatives. Many of these programs already exist and typically operate by sending signals through residential broadband networks to various HAN devices that then curtail the devices or adjust settings to conserve energy use during critical times; however, for a variety of reasons, the broadband approach has been limited in success. The Team is, therefore, focused on demonstrating that those DR efforts can be improved by also transmitting the DR signals through the SMT Portal and across the TDSP AMS networks to the same residential HAN devices located behind the smart meters.
13 2.3.3 Project Timeline
This section includes a high-level schedule of the CCET project activities being performed by the various project components. Phases I and II of this project, 1) Planning and NEPA Compliance, and 2) Design and Installation, were completed in the fourth quarter of 2012, and some of that time was spent
restructuring the project. The schedule shown below is for Phase III, the final phase, which is currently ongoing and will continue until January 2015.
Figure 2. CCET Project Phase III Timeline 2.3.4 Key Project Milestones
The key project milestones for the CCET project are listed in the table below. The milestones serve as key verification dates for measuring progress, and they are typically characterized as deliverables to provide a verification method for accomplishing the milestone on time. During project performance, CCET reports the milestone status as part of the required Monthly Progress Report.
The table identifies the respective project phase, milestone description and planned completion date. Table 1. Key Project Milestones
Phase Milestone Description Planned Completion
I Update the PMP 05/25/2010
I Prepare NEPA Environmental Questionnaires 02/26/2010
I Update I&CS Plan 03/08/2010
II Update the PMP 11/26/2010
II Update I&CS Plan 11/26/2010
II Develop metrics and benefits reporting plan 01/28/2011, 05/16/2011 II Complete system design documents 09/09/2011 II Provide quarterly build metrics Quarterly as of 3Q11 II Create initial market transformation plan 12/16/2011
III Update the PMP 12/14/2012
III Update the I&CS Plan 01/15/2013
14
III Provide quarterly build metrics Quarterly as of 4Q12
III Prepare interim TPRs 09/30/2013,04/30/2014
III Prepare Final Technical Report and TPR 12/30/2014 2.3.5 Key Decision Points
Decision points are used by the CCET Team and DOE to assess the technical status, results, funding requirements, programmatic needs, and relevant risk factors of the project. The success criteria at these decision points are used to assess achievement of specific goals which are typically at the end of each phase or at appropriate points in the project execution.
The success criteria shown below are objective and stated in terms of specific, measurable and
repeatable data. Some of these success criteria pertain to desirable outcomes, results and observations from the demonstration efforts, and encompass certain project aspects such as:
• Validation/confirmation/identification of scientific/engineering knowledge • Cost savings expected over existing technologies
• Performance enhancements to existing technologies • Reduction in health, safety and environmental risks • Ease of installation, operation, and maintenance • Decrease in capital, operating, and maintenance cost
Listed below are the decision points and success criteria for each one.
Decision Point 1 – Planning and NEPA Compliance
• Updated PMP is completed and submitted to DOE
• NEPA Environmental Questionnaires are completed and provided to DOE • Interoperability & Cyber Security (I&CS) Plan is completed and provided to DOE
Go/No-Go Decision Point 1 – End of Phase I
• Previous Decision Point 1 was successfully accomplished • Project efforts are on schedule and within budget • Plans for Phase II are approved
Decision point 2 – Design and Installation
• System design documents are completed and provided to DOE • Market transformation plan is completed and provided to DOE • Quarterly build metrics are provided to DOE
Go/No-Go Decision Point 2 – End of Phase II
• Previous Decision Point 2 was successfully accomplished • Project efforts are on schedule and within budget • Plans for Phase III are approved
Decision Point 3 – Demonstration and Analysis
• Quarterly build metrics are provided to DOE15 • Interim TPRs are provided to DOE
• Final technical report is provided to DOE
2.4
Major Demonstration Components and Smart Grid Technologies and Systems
As summarized earlier in this report, the project began with three primary components: synchrophasor, future community, and SMT portal. As a result of a restructuring effort that ultimately attracted new team partners, and while retaining the same project goals and objectives, the project expanded its scope to now include seven technical demonstrations as part of these three components.
• Synchrophasor
o Synchrophasor monitoring, visualization and event report o Synchrophasor Security Fabric
• Future Community
o Residential circuit monitoring o Residential time-of-use pricing trial
o Distribution-level battery energy storage system
o Fast response regulation service with fleet electric vehicles • SMT Portal
o Residential demand response
This TPR section provides the relevant details on each of these seven demonstration efforts including their smart grid technologies and systems.
2.4.1 Synchrophasor Monitoring, Visualization, and Event Reporting
This demonstration effort will enable ERCOT to better manage the transmission grid to accommodate the very large quantities of wind generation that are coming onto the grid in remote locations, and to detect and identify potential undesirable conditions on the grid and enable ERCOT operators to make adjustments to resolve the conditions. These activities will improve the overall operating reliability of the grid and provide economic value by increasing the amount of wind that can be successfully integrated with the transmission grid.
This effort will demonstrate:
• A method for establishing and maintaining a reliable synchrophasor network to provide real-time dynamic information on large-scale wind resources and their impact on the transmission grid, including assessing the optimal number and location of PMUs for effective wind
integration, thereby advancing transmission operations management practices.
• The use of synchrophasor measurements to identify precursor conditions to undesirable grid performance and behavior, or to grid interruptions which, in turn, can lead to analysis,
investigation, and ultimately changes in operating procedures or actions to facilitate integration of intermittent resources, hence improving grid reliability when employing large amounts of variable renewable energy sources.
16
• Defining the value of the demonstration in replicating and transferring lessons learned for this wind dynamics monitoring and management to other parts of the U.S, thereby promoting the use of variable renewable energy sources.
Measurements that might be collected for recalibrating the engineering models could include voltages, transmission line loadings and angle measurements, small signal stability monitoring, and damping. Measurements that might be collected for identifying precursors to grid interruptions could include low voltage margins, poor system damping, low frequency oscillations, and transmission system angles. Lessons learned that could be transferred from this project component’s efforts include data adequacy, data quality, reliability and robustness for real time grid operations, wind integration, and reliability management.
The key project activities include:
• Establishing a robust synchrophasor network • Validating and managing the synchrophasor data
• Performing analysis and assessment of grid performance based on synchrophasor data • Reviewing and updating policies and procedures related to managing and maintaining the
synchrophasor network and data storage archives.
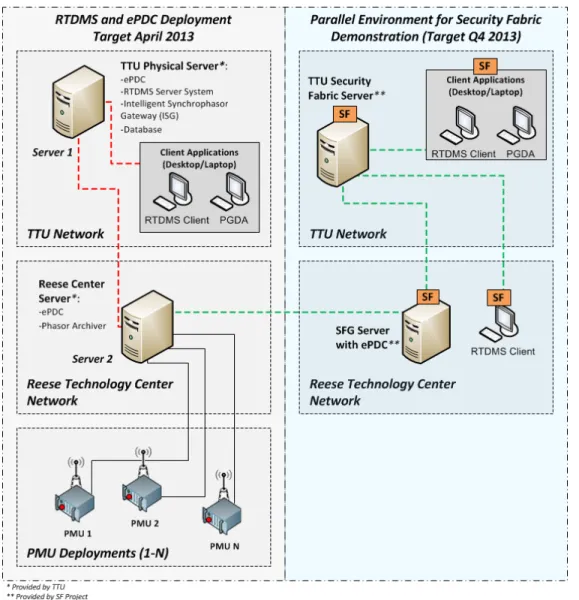
At the inception of this project, the ERCOT network was being monitored by PMUs at three locations (one in northwest Texas, and two in southern Texas). Synchrophasor data was being captured and streamed from those devices to a phasor data concentrator (ePDC) at ERCOT. The data was then synchronized based on timestamps and displayed via the EPG Real Time Dynamics Monitoring System (RTDMS), which was running in the test environment at ERCOT. As part of this demonstration project, three TDSPs (Oncor Electric Delivery, American Electric Power, and Sharyland Utilities) committed to install PMUs at 13 additional locations, and to stream their synchrophasor data to ERCOT for monitoring and display in the RTDMS. After recognizing the true value proposition of this early warning network of devices, the TDSPs began adding PMUs at even more locations on their networks. As of the end of July 2013, there were a total of 48 PMUs, at 28 different locations, delivering synchrophasor data to the ERCOT RTDMS. These efforts also attracted the attention of other utilities across Texas who began planning for deployment of additional PMUs. By early 2014, it is anticipated that the number of PMUs will grow to nearly 60 devices at 36 locations across ERCOT. This network of PMUs currently provides monitoring of about 54% of ERCOT’s regional grid footprint, and this should increase to about 75% coverage by the end of the project.
In addition to the ERCOT synchrophasor network, TTU is working with several electric cooperatives to deploy a synchrophasor network in the Texas Panhandle portion of SPP. This includes a few devices that will be situated near wind turbines at the RTC, not only providing close proximity to wind turbine
measurements, but also supporting a distribution grid. Additionally, this network provides a unique value to this project given its location. As this network is electrically isolated from ERCOT, but located closely to the ERCOT transmission grids, it is likely that any events which occur in both systems can be attributed to environmental factors in the region such as high temperature or high winds. Additionally, this region is effectively a peninsula with limited connectivity to the rest of the SPP and the Eastern
17
Interconnect. These factors make this synchrophasor network an ideal complement to the ERCOT system, providing an independent dataset for the testing of theories and the development of new engineering models which will aid future wind energy efforts.
2.4.2 Synchrophasor Security Fabric
Another synchrophasor demonstration effort is focused on incorporating enhanced security protection mechanisms in the synchrophasor network. For this effort, Intel/McAfee is providing Security Fabric components that are architected to address the seven security tenets of the NIST-IR 7628 for synchrophasor networks. EPG is integrating these capabilities with its monitoring, visualization and reporting platforms (ePDC, RTDMS, and Security Fabric Gateway) to demonstrate secure data transport and data visualization.
One of the key concepts of the Security Fabric approach is the separation of protection and security.
Protection is a mechanism while security is a policy. Therefore, making the protection-security
distinction for separation of mechanism and policy principle is important. Protection is provided as a fault tolerance mechanism by hardware/firmware and kernel whereas the operating system and applications implement their security policies. In this design, security policies rely therefore on the protection mechanisms and on additional cryptography techniques.
The technical objectives of this effort include:
• Intrusion detection using protocol whitelisting • Attack detection and remediation
• Secure encryption communications operating efficiently at all levels • Audit logging and real-time correlation
• Upgrades for devices already operating in the field
The project will employ contemporary concepts of silicon-driven security to stop attacks that easily defeat software-only security attempts. It will provide whitelist attestation to verify the trust basis for all changes and transition control to promote changes at a safe and convenient time.
For this demonstration, EPG is designing, integrating, validating, and testing the Security Fabric enhancements to its ePDC and RTDMS applications in its laboratory environment. This testing is ongoing presently. Once it is proven successful in the laboratory, a field demonstration will be
performed on the TTU synchrophasor network to demonstrate the use of the Security Fabric to secure the phasor data stream between a “virtual Transmission Owner/Utility” and a “virtual Independent System Operator”. The goal of the demonstration is to validate that the phasor data stream can be successfully secured from cyber-attack while still delivering timely phasor data to the “virtual ISO’s” wide-area monitoring and visualization system.
2.4.3 Residential Circuit Monitoring
With the proliferation of residential rooftop solar photovoltaic (PV) distributed generation comes increasing power quality impacts to distribution circuits, such as harmonic voltage and current distortion
18
(THDv, THDi), thought to originate largely from the solar PV inverters, and voltage fluctuations from
varying solar output due to weather variations. By IEEE Standard 519, THDv must be limited to5%.
For one of the future community aspects of the project, CenterPoint Energy is undertaking an effort to examine correlations between solar PV and electric circuit power quality impacts by comparing two neighborhoods in an area north of Houston. The goal of this monitoring and analysis is to identify (and quantify if possible) the drivers, impacts, and corrective measures for power quality and/or operating voltage problems in neighborhoods with extensive solar PV generation.
One of these neighborhoods, Harmony (formerly Discovery at Spring Trails), emphasizes homes with very efficient building features, energy efficient appliances, rooftop or trestle-mounted solar, and HEM systems for monitoring electric and water use. The second neighborhood, Legends Ranch, includes similar type homes but they are built without enhanced energy efficiency features and are not equipped with solar or HEM systems, representing more typical Texas neighborhoods.
For this effort, CenterPoint Energy is monitoring three 38kV distribution lines in each of the two neighborhoods. They installed monitoring on 3 underground residential distribution (URD) circuits in the Harmony community and 3 more on URD circuits in the Legends Ranch community. This is allowing them to monitor the data related to 158 homes in Harmony and 182 homes in Legends Ranch.
There were some technical issues related to fiber access, streaming of data, and data storage, as well as data integrity, but most of these issues have been resolved and data is now being captured, stored, displayed, and analyzed. Extensive power quality data is now being collected by CenterPoint Energy in five-minute intervals, and Frontier Associates is analyzing the data to quantify the solar PV impact on power quality at distribution voltage.
2.4.4 Residential TOU Pricing Trial
In addition to using technology-based tools to address load management challenges, utilities and regulators are evaluating the viability of demand management methods that produce changes in
customer behavior and consumption. Metrics that utilities frequently apply to customer behavior-based load management include:
• Predictability – does the method produce an immediate and lasting change in customer electricity usage that is sufficiently predictable for incorporation into system planning? • Cost/Savings – what are the costs and potential savings for both customers and utilities? • Complexity – how complex are the devices and pricing programs to implement and sustain
for both customers and utilities?
• Satisfaction – how satisfied are customers with the pricing programs?
• Impacts – how are the impacts different for specific customer groups such as older or low-income customers?
To evaluate the effectiveness of behavior-based tools for managing and shifting customer consumption, this part of the future community effort involves a 20-month experiment using varied pricing programs. The experiment, running from March 2013 through October 2014, will include 62 homes in a
time-of-19
use (TOU) pricing group and a control group consisting of another 60 homes. The purpose of this experiment is to determine the degree to which electric customers are willing to alter their pattern of electricity use in response to prices that vary with the time of day. Section 3.4.1 details the experiment design, communication, and data management considerations for the residential TOU Pricing Trial. At present, the pricing experiment consists of two main pricing programs: 1) a reduced night-time price per kilowatt hour based on availability of wind generation during the five windiest (shoulder) months, and 2) a much more expensive price during designated peak hours on ”critical peak” days during four summer months.
The homes within the TOU pricing group and the control group have been outfitted with HEM systems. These devices attach to the home’s electrical breaker panel(s) and collect whole home and circuit (appliance) level energy use data at a one-minute interval. The energy use data is used to perform comparative analysis among the TOU and control groups based on the TOU group’s response to the pricing programs.
2.4.5 Residential Demand Response
TXU Energy launched the Brighten® iThermostat and Brighten® Conservation Program in June of 2008.
The program includes a enabled programmable thermostat that communicates to a Zigbee-enabled gateway. The gateway is connected to the Internet via a customer-provided router to give customers a full range of remote thermostat controls and reporting, which can be accessed from most computers and smart phones. The initial 2008 pilot started as a customer self-install model with the option for professional installation. The program was converted to a 100% professional installation model in 2009 where trained technicians install the thermostat and gateway, then provision the equipment to ensure remote connectivity.
Results of the self-install model quickly revealed that less than 35% of the devices came “online”
primarily because customers didn’t bother to install the thermostat and/or the gateway. By switching to a professional installation model TXU Energy was able to ensure initial connectivity; however, the online devices percentage still remains well below anticipated levels. While some of the offline devices can be attributed to hardware/software issues, the majority are assumed to be the result of other customer driven issues (disconnecting the gateway, Internet issues, etc.). As the customer base grows, so does the number of offline devices that are not able to receive a DR command.
Based on the historical online percentage, for every 10,000 thermostats participating in the Brighten®
Conservation Program, TXU Energy is only able to cycle approximately 5,500 air conditioners. Assuming each air conditioning system uses an average of 1.5 kW, then the remaining 4,500 offline devices equate to approximately 6,750 kW. By creating a dual communication path to the thermostat, both through the Internet and through the smart meter via the utility AMI network, TXU Energy expects to increase the percentage of controllable devices to over 95%.
20
• Gateway configured as a router. Early tests using a gateway configured as a coordinator (standard installation) demonstrated that this device could not pair to the residential smart meter. The current gateway configured as a router is an iDigi X2e device. The gateway is expecting to access (via Ethernet) a customer’s existing Internet connection via the customer’s existing cable/DSL modem.
• Programmable control thermostat (PCT). The PCT controls a home’s heating and cooling system and it can be programmed to automatically change temperature at certain times of the day, generally to save energy. TXU Energy has deployed various models of PCTs in support of its iThermostat DR program, and for the CCET project, they will be leveraging Carrier PCTs. • Smart meter. Texas has installed more than 6 million residential smart meters, and homes
participating in this project are so equipped. For the initial demonstrations, this project will leverage the Landis & Gyr smart meters deployed in the Oncor Electric territory.
• Cable/DSL modem. These devices support the existing DR programs which use the Internet and provide the customers with the ability to control their PCTs and monitor various results. The figure below illustrates the devices and the proposed architecture:
21
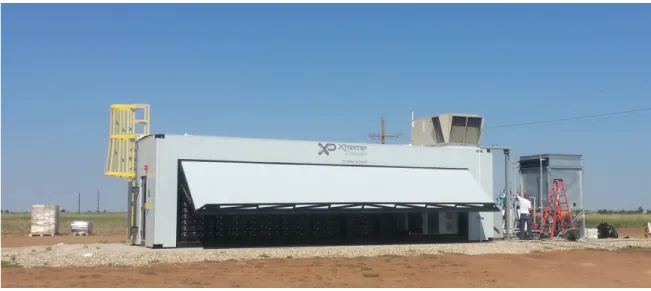
2.4.6 Distribution-Level Battery Energy Storage System (BESS)
As part of the future community component, a 1MW grid-connected battery energy storage system (BESS) has been installed at the RTC, and is shown below.
Figure 4. BESS Installed at the RTC
The BESS uses 18 racks with 256 Li-Ion batteries totaling 4,608 battery cells with a combined energy storage capacity of 1 MW-hr. Depicted above on the right side of the unit are the air conditioning systems.
The BESS will operate in conjunction with about 2.6 MW of wind generation at the site. This includes an Alstom ECO86 1.67 MW wind turbine, and three V27 300kW Vestas turbines that were recently
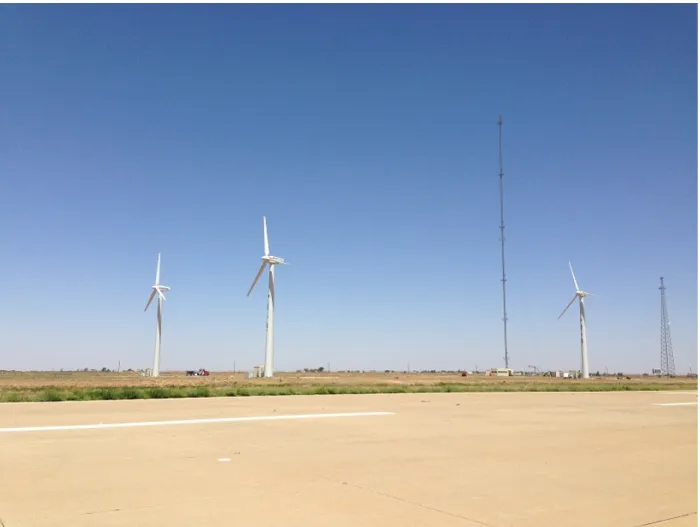
deployed by Sandia National Laboratories as part of its new Scaled Wind Farm Technology (SWiFT) facility which currently produces 900kW, and will eventually be expanded to produce 3.6 MW. The site also includes a 200-meter meteorological tower to provide atmospheric measurements for wind analysis. Two images of the SWiFT facility are shown below. The first image shows a view of the three SWiFT turbines and the meteorological tower. The second image shows an aerial view of the SWiFT turbines and the close proximity of the BESS.
22
23
Figure 6. Aerial View of the BESS and the SWiFT Facility Turbines
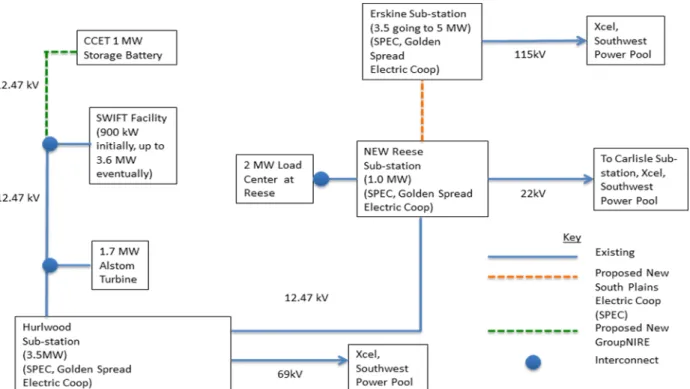
The BESS will be utilized to supply some of the energy necessary to meet the demands of a local
substation electric load, especially during peak periods. The battery and wind generation are connected such that they are only used for local capacity and do not feed back onto the transmission grid. The electrical system layout is shown below.
24
Figure 7. Reese Technology Center Electrical Layout
The BESS utilizes a series of deep-cycle Lithium Manganese Oxide (LMO) batteries developed by Samsung and designed for use in renewable energy applications. The BESS is connected via a
bi-directional converter through a transformer to the main distribution grid. The energy produced by wind generation is intermittent, so the BESS serves as a backup storage unit to supply power to the grid at peak demand times which often coincide with low instantaneous wind power generation. The BESS is connected at the 12.47 kV medium voltage level, and it can be charged or discharged by the bi-directional converter as shown below to manage power flow into the grid.
25
In addition to peak shaving for the local cooperative, South Plains Electric Cooperative (SPEC), the BESS is also designed to perform other operations such as mitigating intermittent fluctuations of a number of nearby wind turbines, regulating the distribution bus voltage, serving as spinning reserve, and providing frequency support during the loss of generation. These and other potential uses of the BESS will be exercised and evaluated as part of its ongoing operation.
2.4.7 Fast Response Regulation Service with Fleet Electric Vehicles
Frequency regulation is a grid ancillary service that allows electricity generators to bid services into the energy market to assist in maintaining grid frequency at 60Hz. Providers of this type of service
guarantee to be able to adjust generation during a specified time period by either ramping up or ramping down production according to ERCOT instructions in order to maintain the balance of
generation/load on the grid, and thus the frequency. Traditionally this was accomplished through the use of a four-second signal generated by ERCOT, with each frequency regulation generation resource then responding within their pre-established ramp rate until they met the full capacity specified in the signal. Participants in the frequency regulation market get paid whether they are called upon to adjust power or not, thus they are paid to be "on standby".
In January 2013 ERCOT began a new pilot program to provide Fast Response Regulation Services (FRRS). In FRRS, signals from ERCOT are responded to at full power within one second of signal receipt.
Additionally, participants in FRRS monitor grid frequency, and can respond automatically when a deviation of .09Hz or greater is detected. ERCOT's goal is to develop regulation services that can respond faster to grid frequency deviations, thus saving both in reduced congestion (and its associated costs to the market) and in reduced frequency regulation services by having services that can respond faster to a deviation which requires less participants to be standing idle and ready to provide frequency regulation.
Batteries can serve as an ideal provider for FRRS, since batteries have a much faster response time than gas or coal-fired generators, which must ramp to the regulation goal based on the simple physics of heating or cooling boilers. A great resource for batteries that could serve this purpose without
significant investment (such as a utility scale battery) is electric vehicles (EVs). In particular, supporting regulation-up services (the reducing of load on the system) can be as simple as "flipping a switch", i.e. turning the EV charger off. Regulation-down (the addition of load on the system) could be provided almost as quickly although the delivery of load to the grid would be managed by the EV battery management system (BMS) and so would be slightly slower.
The purpose of this part of the CCET project is to demonstrate an FRRS capability using an EV fleet at the Frito-Lay Distribution Facility in Fort Worth, Texas. Frito-Lay has a fleet of 11 EVs that are used primarily at night for deliveries around the Dallas/Fort Worth metroplex. These vehicles are typically charged during the day, when grid loads are highest and the need for frequency regulation is most apparent. This effort will entail the development and demonstration of an EV aggregation control system to support regulation-up services in response to either an ERCOT signal or a detected deviation of grid frequency of greater than .09Hz. FRRS services will be bid into the market in one-hour intervals during
26
the time the vehicles are absorbing full load from the grid, thus providing an excellent source for power reduction to support FRRS.
2.5
Anticipated Project Benefits
Broadly, the expected benefits of the CCET demonstration project will be derived from a more reliable electric grid that can facilitate effective management of and responses to increased wind resources in Texas and from supporting the deployment of new products, technologies, and infrastructure to help customers make informed decisions about their energy usage. Customers will be empowered to effectively and reliably manage their peak demand, therefore resulting in reduced customer electricity costs, reduced system-wide capacity needs, reduced electrical losses, and reduced environmental impacts.
Specific smart grid benefits that are potentially supported by CCET’s project and aligned with the functions identified by DOE are included below:
• Economic
o Arbitrage revenue o Capacity revenue
o Ancillary service revenue o Optimized generator operation
o Deferred generation capacity investments o Reduced ancillary service cost
o Reduced congestion cost
o Deferred transmission capacity investments o Deferred distribution capacity investments o Reduced electricity losses
o Reduced electricity cost • Reliability
o Reduced sustained outages o Reduced major outages o Reduced momentary outages o Reduced sags and swells o Enhanced resource planning • Environmental
o Reduced carbon dioxide emissions o Reduced SOX, NOX, and PM-2.5 emissions • Energy Security
o Increased reliance on domestic sources of energy o Reduced oil usage
27
2.6
Basic Interoperability and Cyber Security Approach
One of the key requirements for the DOE SGRDPs is to ensure that interoperability and cyber security are addressed. For this project, CCET chose a cross-cutting approach whereby interoperability and cyber security efforts were integrated into each technical component of the project. The technical approaches for performing these cross-cutting efforts are outlined in the next two sub-sections.
2.6.1 Interoperability
The CCET project members take measures to ensure that technologies in this project comply with documented standards for interoperability. During the project, the demonstrated technologies are exercised and evaluated to ensure they interoperate with both the existing electrical infrastructure as well as anticipated grid enhancements.
• Synchrophasor network: The teams have chosen devices from proven commercial vendors that have been in field use for years and have been validated by their vendors as satisfying
interoperable standards. Although communication issues have been defined, these are related more to operating frequencies, environment and atmospherics rather than interoperability. • Utility-scale BESS: For the BESS, the vendor, the local cooperative SPEC, and TTU are responsible
for any necessary interoperability testing. The BESS vendor performed laboratory testing and replicated that testing when the BESS was fielded. Since the BESS is a self-contained unit, using proven and reliable technologies, no issues were anticipated and none were revealed. There is still potential data transmission, storage and data visualization issues, but none of these are expected to be related to interoperability and field testing should verify this.
• Residential home area networks (HANs): The HAN devices are chosen by the partners based partly on compliance with standards and partly on their technological capabilities. One set of these HAN devices that have been selected for the pricing program has been rigorously tested as part of its own demonstration project.
• SMT Portal and DR: Another set of HAN devices that are being used for DR have undergone both laboratory and field testing to demonstrate interoperability with both smart meters and broadband networks. The testing did in fact reveal that some older fielded devices actually had issues with interoperability and these findings were documented and revealed to the respective REP. To continue the DR program, the REP and CCET chose to leverage newly fielded devices that were guaranteed by the vendor to be compliant with interoperability standards. These devices have also undergone both laboratory and field testing to validate their compliance. • Distribution-level monitoring systems: The TDSP implementing the neighborhood circuit
monitoring effort is responsible for performing all necessary interoperability testing. • FRRS: The team is following established ERCOT standards implemented in similar efforts and
verified through a certification process. 2.6.2 Cyber Security
The CCET project members recognize the impo