1
Measuring health related quality of life of care home residents,
1comparison of self-report with staff proxy responses for
EQ-5D-25L and HowRu: Protocol for Assessing Proxy Reliability In Care
3home Outcome Testing
4 5 Adeela Usman 1 6 Sarah Lewis 2 7 Kathryn Hinsliff-Smith 1 8 Annabelle Long 1 9 Gemma Housley 3 10 Jake Jordan 4 11 Heather Gage 4 12 Tom Dening 5 13 John R F Gladman 6, 7 14 Adam L Gordon 1, 8 151. Division of Medical Sciences and Graduate Entry Medicine, School of Medicine,
16
University of Nottingham, UK.
17
2. Division of Epidemiology and Public Health, School of Medicine, University of
18
Nottingham, UK.
19
3. East Midlands East Midlands Academic Health Science Network, Nottingham, UK. 20
4. School of Economics, University of Surrey, UK.
21
5. Institute of Mental Health, University of Nottingham, UK.
22
6. Division of Rehabilitation and Ageing, University of Nottingham, UK
23
7. East Midlands Collaboration for Leadership in Applied Health Research and Care, UK
24
8. School of Health Sciences, City, University of London, UK.
25 26
Corresponding Author: Adam Gordon, Division of Medical Sciences and Graduate 27
Entry Medicine, University of Nottingham, Room 4113, Derby Medical School, Derby. 28
DE22 3NE. 29
Email: [email protected]; Tel: 01332 724668; Fax:01332 724697
30 31 32
Word Count: 2793 words 33
34 35 36 37
2 Abstract
38
Introduction 39
Research into interventions to improve health and wellbeing for older people living in 40
care homes is increasingly common. Health-Related Quality of Life (HRQoL) is 41
frequently used as an outcome measure but collecting both self-reported and proxy 42
HRQoL measures is challenging in this setting. This study will investigate the reliability 43
of UK care home staff as proxy respondents for the EQ-5D-5L and HowRu measures. 44
45
Methods and Analysis 46
This is a prospective cohort study of a sub-population of care home residents recruited 47
to the larger Proactive Healthcare for Older People in Care Homes (PEACH) study. It 48
will recruit residents ≥ 60 years across 24 care homes and not receiving short stay or 49
respite care. The sample size is 160 participants. Resident and care home staff proxy 50
EQ-5D-5L and HowRu responses will be collected monthly for three months. Weighted 51
kappa statistics and intraclass correlation adjusted for clustering at the care home 52
level will be used to measure agreement between resident and proxy responses. The 53
extent to which staff variables (gender, age group, length of time caring, role, how well 54
they know the resident, length of time working in care homes and in specialist 55
gerontological practice) influence the level of agreement between self-reported and 56
proxy responses will be considered using a multilevel mixed-effect regression model. 57
58
Ethics and Dissemination 59
The PEACH study protocol was reviewed by the UK Health Research Authority and 60
University of Nottingham Research Ethics Committee and was determined to be a 61
service development project. We will publish this study in a peer-reviewed journal with 62
international readership and disseminate it through relevant national stakeholder 63
networks and specialist societies. 64 65 66 67 68 69 70 71 72 73 74
3 Introduction
75
Long term care facilities in the UK are called care homes, and are classified as either 76
care homes with or without nursing based upon the availability of registered nurses 77
on-site (1). The types of residents cared for in both classifications of facility are similar 78
and all UK care homes are included in the international consensus definition of a 79
nursing home (2). Around 425,000 people live in care homes in the UK (3) with most 80
residents requiring care due to disability from long-term conditions. The majority of 81
residents are aged over 85, 75-80% of residents live with dementia (4), and over half 82
of residents die within 12 months of admission to care home (5). 83
84
Improving the quality of care for older people in long-term care has become a focus of 85
attention for health and social care providers, both within the UK and internationally 86
(2), and an increasing number of evaluative research studies are being published that 87
test the effectiveness and cost-effectiveness of interventions in this setting. Residents’ 88
quality of life (QoL) is frequently used as an outcome measure in these studies both 89
to maintain a patient-centred focus and to facilitate health economic evaluation. The 90
prevalent frailty and cognitive impairment in the care home population, however, 91
means that collecting self-reported QoL measures from residents is challenging. As a 92
response to this, proxy responses to QoL items have sometimes been used. For these 93
a consultee, drawn from one of care home staff, or a relative or friend, answers 94
questions on the resident’s behalf. Using proxy respondents can be unreliable in care 95
home settings. There may be lack of continuity of care home staff contact with 96
individual residents due to shift working and staff turnover, and family and friends may 97
not be well placed to judge QoL domains if they visit residents for only short periods 98
(6). 99
100
The EurQoL questionnaire is a widely-used preference-based health-related quality of 101
life (HRQoL) measure suitable for use in economic evaluations. The EQ-5D-5L version 102
measures HRQoL across five domains (mobility, self-care, usual activities, pain, 103
anxiety/depression) with the scale for each domain ranging from level 1 (no problems) 104
to level 5 (extreme problems). The responses from the five domains are converted to 105
QoL index scores (utilities) generated from a given country’s general population (7). 106
These index scores can be used to calculate quality adjusted life years (QALYs), which 107
are a measure of the person’s state of health – one QALY equates to one year in 108
perfect health. QALYs are calculated using the area under the curve (8) defined by 109
utility scores at the different assessment points over the study period. The cost per 110
QALY gained from an intervention when compared to usual care is the chosen cost-111
utility measure for determining eligibility for public support of the intervention through 112
the UK National Health Service (9). 113
114
The scale for the first version of EQ-5D had only three levels (EQ-5D-3L). EQ-5D-3L 115
has been shown to have good construct validity for self-report (10), and has been used 116
to measure QoL of older people living in their own homes and in care homes (11). The 117
5L version was developed subsequently to deal with identified issues with sensitivity 118
and a ceiling effect on the EQ-5D-3L which limited its ability to discriminate between 119
health states, particularly in those with higher quality of life (12). There is also an EQ-120
5D visual analogue scale (VAS) used to assess overall health status, ranging from 0 121
(worst imaginable) to 100 (best imaginable). VAS is recognised to have specific 122
strengths and weaknesses(13) but is recommended to be used routinely alongside 123
4
the self-classification questionnaire by the EuroQoL group because of its usefulness 124
in establishing global health status(14). 125
126
It is recognised that the EQ-5D, in all its forms, is limited by consequence of being a 127
generic measure that fails to take account of the difference in what constitutes “quality 128
of life” in a long-term care setting. It doesn’t take account of shifts in emphasis about 129
what constitutes wellbeing as residents enter long-term care, which means that social 130
care related quality of life (SCRQoL) measures such as the Adult Social Care 131
Outcomes Toolkit (ASCOT) may be preferable in this setting (15-16). A further critique 132
has been that it fails to separate capability (what a resident is able to do) from 133
preference (what a resident chooses to do under the circumstances), with the result 134
that some authors have championed capability-based outcome measures, such as the 135
ICEpop Capability Measure for Older People (ICECAP-O), in care homes (17-18). 136
Best practice suggests that, if EQ-5D is used in this setting, it is used in combination 137
with more specific instruments. 138
139
The R-outcome tool howRu has been specifically designed for use in long term care 140
settings in order to address quality of life in a straightforward way that is practical with 141
older people. HowRu is a Patient Recorded Outcome Measure (PROM) that records 142
four variables (pain or discomfort, feeling low or worried, limitation in activities, and 143
dependency on others) related to quality of life at a fixed point in time (“How are you 144
doing today?”) on a four-point scale (none, slight, quite a lot, extreme) (19, 20). The 145
HowRu score is calculated by summing up the values for each domain to give a value 146
on a 13-point scale ranging from 0 (worst) to 12 (best). The HowRu PROM was 147
designed with older adults in mind (19,20), and may have a cogency and immediacy 148
that improves upon some of the measurement uncertainty introduced by the relative 149
abstraction of the questions included in highly validated general population indices 150
such as EQ-5D-5L. 151
152
In a comparison with EQ-5D in patients attending a cardiovascular outpatient clinic, 153
HowRu was reported to have better readability, higher completion rate, wider range of 154
states used and smaller ceiling effect(17). No national tariffs exist to enable calculation 155
of HowRu indices that would facilitate its use as a preference-based measure in cost-156
utility analysis. Understanding how and whether R outcomes correlate with EQ-5D 157
scores in the care home setting is, however, helpful when considering additional 158
information that can help triangulate our understanding of how interventions affect 159
quality of life in this context. Knowing that HowRu correlates with EQ-5D may provide 160
further justification for using it in clinical settings where broad judgements about impact 161
on quality of life have to be made without the need for detailed cost-utility analysis. 162
163
Proxies have been used to capture EQ-5D-3L responses from people with dementia, 164
although poor agreement between patient and proxy ratings has raised concerns 165
(15,16) and differences between professional and family carer ratings have led to 166
questions about the appropriate choice of proxy (16). In a comparison of clinicians and 167
family carers as proxies, clinician responses had better construct validity in the more 168
observable domains of mobility and self-care, and family carer responses had better 169
construct validity in the less observable domains of usual activities and 170
anxiety/depression (16). There is limited evidence, however, comparing self-reported 171
and proxy responses to the EQ-5D-5L in care home populations (17). There is, in 172
particular, a paucity of data as to how it performs in UK care home populations. This 173
5
is important because institutional care is structured differently between nations, with 174
differing professional carer competencies, patterns of working and job roles. This 175
means that carers in different countries will have differential exposure to residents and 176
different competencies in terms of their ability to interpret residents’ experiences, and 177
a tool that works for professional proxy response in the US may not, therefore, work 178
as well in the UK. 179
180
The HowRu, as a recently developed PROM, is yet to be fully evaluated for older 181
people living in care homes (21). It is not known whether proxy responses in this 182
setting may be useful in completing HowRU and there are no data on how HowRu 183
correlates with EQ-5D in the care home populations. 184
This study seeks to fill these evidence gaps. 185
186
Aim 187
The Assessing Proxy Reliability In Care home Outcome Testing (APRICOT) study is 188
a preparatory piece of work for the Proactive Healthcare for Older People Living in 189
Care Homes (PEACH) study. It aims to examine the level of agreement between the 190
responses to EQ-5D-5L and HowRu by care home staff and residents, and between 191
EQ-5D-5L and HowRu as quality of life measures. Findings will assist in the 192
interpretation of quality of life data gathered for the larger PEACH study. 193
194
Objectives 195
To determine the level of agreement between: 196
• Resident EQ-5D-5L and staff-proxy EQ-5D-5L responses
197
• Resident HowRu and staff-proxy HowRu responses
198
• Resident EQ-5D-5L and HowRu responses
199
• Proxy EQ-5D-5L and HowRu responses
200
Methods 201
Setting 202
24 care homes in the East Midlands area of England. These are long-term care 203
institutions, housing predominantly older people with frailty who can no longer be 204
cared for at home. Detailed descriptions of the UK care home sector and the residents 205
living within it have been published elsewhere (4). 206
207
Brief description of the Proactive Healthcare in Older Peoples’ Care Homes (PEACH) 208
study 209
The PEACH intervention involves using Quality Improvement Collaboratives as a 210
mechanism to encourage implementation of Comprehensive Geriatric Assessment 211
(CGA) as a unifying framework for assessment and delivery of healthcare in UK care 212
homes. CGA is widely recognised as a gold-standard way to deliver care for older 213
people with frailty (22). The aim of PEACH is to improve quality of care and quality of 214
life for care home residents. Outcome data quantifying healthcare resource use and 215
resident level quality of life will be collected on a monthly basis to assess the impact 216
of the intervention. 217
218
Two instruments are being used in PEACH to assess residents’ quality of life, the EQ-219
5D-5L and HowRu. The rationale is that these reflect measurable differences in the 220
6
patient experience that may translate, with some interpretation, into an understanding 221
of how CGA influences quality of care and general wellbeing. APRICOT has been 222
designed as a preparatory sub-study within PEACH to better enable interpretation of 223
proxy EQ-5D-5L and HowRU responses collected as part of outcome measurement. 224
225
Participants 226
Care home recruitment for PEACH took place between October 2016 and January 227
2017, with individual resident recruitment from January 2017. A prospective cohort of 228
a sub-population of residents will be included in the comparison of proxy and self-229
report measurement of EQ-5D-5L and HowRu in APRICOT. Residents included in the 230
study will be those ≥ 60 years across 24 care homes and not receiving short stay or 231
respite care .To have a better reflection of self-reported and proxy agreement in a care 232
home setting we will include residents with and without mental capacity.Care home 233
managers will provide guidance with regards to residents with and without capacity to 234
participate. When managers are unsure, researchers will make judgements based on 235
the framework for mental capacity outlined in the 2005 Mental Capacity Act for 236
England and Wales (23) and in keeping with the recommendations of that Act for 237
inclusion research, for residents that lack capacity to provide consent to participation 238
an appropriate person will be consulted to make a decision with regards to 239
participation in the study. 240
241
This study will be conducted in parallel to the main PEACH study. In addition to the 242
routine collection of EQ-5D-5L and HowRu from residents recruited to PEACH, proxy 243
responses to EQ-5D-5L and HowRu will be gathered from staff. We will include staff 244
such as care home assistants, care home manager and registered nurses, who 245
know the resident well. We will exclude staff employed in a supportive role, such as 246
activity coordinators, since their orientation to supporting residents is more variable. 247
248
Data collection 249
Data from proxies will be collected on three consecutive months. Due to the high staff 250
turnover amongst care home staff, and to enable the influence of carer characteristics 251
on the level of agreement to be estimated, data on the carer will be gathered at each 252
assessment. Repeated measures are required for the final analysis in the PEACH 253
study for calculating costs per QALY gained (comparing the intervention with usual 254
care condition) and understanding how the agreement changes at different time points 255
is therefore of interest. 256
257
Staff proxies will be asked to consider the proxy-resident’s perspective when 258
completing the questionnaire using the following statement: “Please rate how you 259
(staff) think the resident will rate his/her own health-realted quality of life, if the resident 260
was to communicate” (24). Both self-reported and proxy EQ-5D will be completed on 261
the same day to minimize any variations in responses. 262
263
The EQ-5D VAS will be used in the study in keeping with the recommendations of the 264 EuroQoL group. 265 266 Primary analysis 267
7
An overall agreement between the self-reported and staff proxy responses on the 268
domain levels of the EQ-5D-5L and HowRu will be computed. Weighted kappa statistic 269
and Intra-class correlation (ICC) will be used to calculate the level of agreement for 270
categorical and continuous outcomes respectively. All reliability indices will be 271
calculated at the domain levels and overall index scores/QALYs for the EQ-5D-5L.To 272
calculate the EQ-5D-5L index scores, responses from the descriptive system will be 273
transformed into index scores derived from the UK general population. This will be 274
done using the crosswalk value set (25), which maps the 5L descriptive system data 275
onto the 3L valuation. 276
277
Weighted kappa helps to distinguish between small and large difference in agreement 278
ratings assigned to the different levels of each domain but equal importance is given 279
to disagreement (26, 27). The weighting for kappa will be done using linear weight - 280
this assigns the same importance to the difference between any two categories within 281
the response scale (28). The confidence interval for the weighted kappa will be 282
calculated by bootstrapping in Stata 15 (Statcorp, LLC, 2015) with 1000 replications. 283
This will be done for each time point. 284
285
The kappa statistic ranges from -1 to 1, and the strength of the agreement will be 286
interpreted with regards to published guidelines (29) with agreement being: 287 • Poor, if kappa ≤ 0.00 288 • Slight, if kappa = 0.00 to 0.20 289 • Fair, if kappa = 0.21 to 0.40 290 • Moderate, if kappa = 0.41 to 0.60 291 • Substantial, if kappa = 0.61 to 0.80 292
• Almost perfect, if kappa ≥ 0.80
293
Unadjusted ICC will be calculated using two-way mixed effect ANOVA model to 294
examine the level of agreement between the self-reported and proxy responses for 295
the EQ-5D-VAS, EQ-5D index scores and total QALYs.ANOVA models are reported 296
to be robust to deviations in normality and have been used in other quality of life 297
agreement studies (16,30).The Bland-Altman graph (plotting the mean difference 298
between the EQ-5D-5L-S (self-report) and EQ-5D-5L-P (proxy) against the mean of 299
the two measures) will be constructed to supplement the ICC . 300
301
Analysis will be done at each time point for Kappa and ICC. However, a single ICC 302
value for QALYs will be calculated for individuals with data on all three consecutive 303
months as this will be used in practice in the PEACH study, where analysis will be 304
done on consecutive measures made over time. 305
306
To allow for comparability of the level of agreement at the domain and index score 307
level; the same benchmarks used for kappa will be used for the ICC. 308
309
Clustering 310
Clustering will be adjusted for because the calculation of kappa and ICC assumes 311
independence of observations. In our study, clustering could occur at three levels at 312
each time point. Firstly, at the care home level, where residents within the same care 313
home have similar characteristics and are different from those in other care homes. 314
Secondly, at the individual level, where responses are clustered within each resident 315
8
and lastly, at staff level, where staff members within a care home responds on behalf 316
of multiple residents. 317
318
The ICC value will be calculated allowing for clustering using a nested two-way 319
mixed effect model calculated by fitting a 2 level random effect model with a random 320
effect for care home and individuals. 321
322
A cluster adjusted kappa will be calculated using a variance formula. This will include 323
calculating kappa and its variance for each care home, then estimating the within 324
cluster variance
𝜎
#$using the average of the individual variances, and between cluster 325variance
𝜎
%$using the variance of the individual kappa. Using these estimates the 326clustered Kappa and its variance will be calculated using the formulas below: 327 328 329 Where 330 𝑛' = Size of cluster 𝑖 331
𝜌 = Intra-cluster correlation coefficient for Kappa 332
333 334
Variance of the cluster adjusted kappa will be obtained using the equation below 335
(24): 336
337 338
The clustered kappa and its variance will then be divided by the square root of the 339
number of individuals to get the standard error. The 95% confidence interval will be 340
calculated using this standard error. 341
342
Cluster adjusted kappa (EQ-5D-5L and HowRu domain levels) and ICC (EQ-VAS and 343
EQ-5D index scores) will be reported for each time point. However, QALYs will be 344
presented over time, three months, similar to how it will be calculated in the PEACH 345
study. 346
347
Sample size calculation 348
We need a sample size of 160 residents assuming a kappa of 0.145 and a confidence 349
level width of 0.153 derived from a previous study (16), given that 50% of residents 350
will have any problems. 351
352
Secondary analyses 353
The effect of age, sex and length of stay in care home (for residents), length time 354
working in care of older people/care homes and role/rank (for staff) at baseline on the 355
difference between staff and proxy EQ-5D-5L-S scores will be analysed using a 356
multilevel mixed effect regression model. 357
9 358
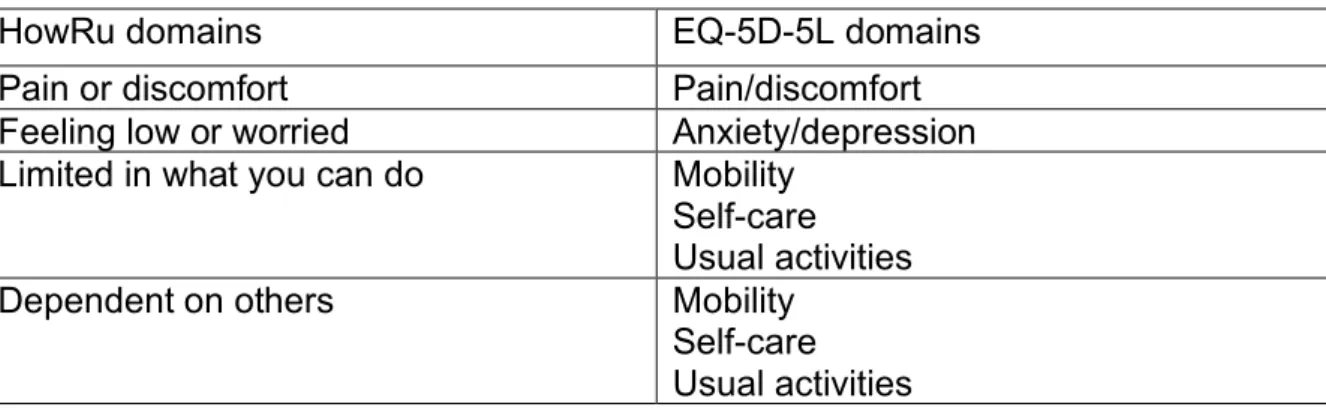
To investigate the reliability of using HowRu as a quality of life measure in the care 359
home population compared with EQ-5D-5L, we will assess agreement between these 360
indices using weighted kappa statistics. This will involve testing the level of agreement 361
between domains with similar construct on both scales (31) as shown in table 1. 362
363
Table 1 - Planned pair-wise alignment of HowRU and EQ-5D-5L domains for agreement analysis using kappa 364
HowRu domains EQ-5D-5L domains
Pain or discomfort Pain/discomfort
Feeling low or worried Anxiety/depression Limited in what you can do Mobility
Self-care Usual activities
Dependent on others Mobility
Self-care Usual activities 365
Patient and Public Involvement 366
The APRICOT and PEACH studies were developed and designed in discussion with 367
both Care Home Sector and Patient and Public Involvement (PPI) representatives. 368
The initial research proposal and protocol was presented, prior to submission for 369
funding, to the Dementia and Frail Older Person’s PPI group hosted in the Division of 370
Rehabilitation and Ageing, University of Nottingham. Amendments were made to the 371
proposal and protocol in light of their feedback. The PEACH study team includes 372
one PPI and two care home sector representatives who are present at all study 373
management meetings, with oversight for the APRICOT sub-study. We keep all 374
participating care homes working with PEACH updated through quarterly newsletters 375
which will include dissemination of our findings in lay terms as these become 376
available. 377
378
Strengths and Limitations of this study 379
• To our knowledge, this is the first study to investigate the reliability of staff 380
proxy using the EQ-5D-5L and HowRu, and the reliability of HowRu as a 381
quality of life measure in a UK care home setting. 382
• The scales will be administered to residents and staff on the same day, thus 383
reducing any variations that will affect the level of agreement. 384
• Analysing the characteristics of staff respondents will help generate insights 385
into how proxies might better be selected or prepared to maximise the validity 386
of proxy responses. 387
• The use of multiple time points will help increase the sample size and account 388
for the influence of staff turnover on the quality of proxy-response. 389
• Working with residents with mental capacity will optimise their responses as a 390
gold standard against which proxies can be compared. The way in which staff 391
interpret quality of life in this more communicative and able group may, 392
however, be different to the way in which the interpret quality of life in 393
advanced dementia. 394
10 Ethics and dissemination
396
This study is part of preparatory work for the larger PEACH study. PEACH was 397
reviewed by both the UK Health Research Authority and the University of 398
Nottingham Research Ethics Committee and determined by both to be a service 399
development and evaluation project. We will obtain informed consent from residents 400
who have mental capacity and use a consultee when residents lack mental capacity. 401
The PEACH study protocol has been reviewed as part of good governance by the 402
Nottinghamshire Healthcare Foundation Trust. We aim to publish this study in a 403
peer-reviewed journal with international readership and disseminate it further using 404
relevant national stakeholder networks and specialist societies. 405
406
Funding 407
This work has been conducted as part of the Proactive Healthcare of Older People in 408
Care Homes (PEACH) study, supported by the Dunhill Medical Trust, award number 409 FOP1/0115. 410 411 Contributors 412
All authors meet the ICJME criteria for authorship. AU, SL, KHS, AL, GH, JJ, HG, 413
TD, JRFG and ALG conceived the study at a PEACH study management meeting 414
and specified the aims and objectives. AU, SL and ALG produced the initial draft of 415
the protocol, with KHS, AL, GH, JJ, HG, TD and JRFG contributing to subsequent 416
redrafts. AU and SL led on aspects of statistical design. JJ and HG provided 417
specialist health economics input. AU, SL, KHS, AL, GH, JJ, HG, TD, JRFG and 418
ALG all reviewed the final manuscript and approved it prior to submission. 419 Competing interests 420 None declared. 421 422 Acknowledgements 423
The authors would like to acknowledge the broader PEACH study team: Mr Zimran 424
Alam, Ms Anita Astle, Professor Tony Avery, Dr Jaydip Banerjee, Professor Clive 425
Bowman, Dr Neil H Chadborn, Mr Michael Crossley, Dr Reena Devi, Professor Claire 426
Goodman, Professor Pip Logan, Professor Finbarr Martin, Professor Julienne Meyer, 427
Dr Dominick Shaw, Professor David Stott and Dr Maria Zubair. 428
References 429
1. Aspden T, Bradshaw SA, Playford ED, Riazi A. Quality-of-life measures for use
430
within care homes: a systematic review of their measurement properties. Age and
431
Ageing. 2014; 43(5):596-603.
432
2. Sanford AM, Orrell M, Tolson D, Abbatecola AM, Arai H, Bauer JM, et al. An
433
International Definition for “Nursing Home”. Journal of the American Medical
434
Directors Association. 2015;16(3):181-184.
435
3. Laing & Buisson. Care of the Elderly People Market Survey. London: Laing and
436
Buisson 2010; 2009.
437
4. Gordon AL, Franklin M, Bradshaw L, Logan P, Elliott R, Gladman JRF. Health
438
status of UK care home residents: a cohort study. Age and Ageing.
439
2014;43(1):97-103.
440
5. Kinley J, Hockley J, Stone L, Dewey M, Hansford P, Stewart R, et al. The
441
provision of care for residents dying in UK nursing care homes. Age and Ageing.
442
2014;43(3):375-379.
11
6. Kane RL, Kane RA, Bershadsky B, Degenholtz H, Kling K, Totten A, et al. Proxy
444
sources for information on nursing home residents' quality of life. The journals of
445
gerontology Series B, Psychological sciences and social sciences.
446
2005;60(6):S318-s325.
447
7. Devlin N, Shah K, Feng Y, Mulhern B, van Hout B. Valuing health-related quality
448
of Life: An EQ-5D-5L Value Set for England. Health Economics. 2017; 1-16.
449
8. Whitehead SJ, Ali S. Health outcomes in economic evaluation: the QALY and
450
utilities. Br Med Bull. 2010;96(1):5–21.
451
9. McCabe C, Claxton K, Culyer AJ. The NICE Cost-EffectivenessThreshold.
452
Pharmacoeconomics. 2008;26(9):733-744.
453
10. Janssen MF, Simon Pickard A, Golicki D, Gudex C, Niewada M et al.
454
Measurement properties of the EQ-5D-5L compared to the EQ-5D-3L across
455
eight patient groups: a multi-country study. Qual Life Res. 2013; 22(7): 1717-27
456
11. Borowiak E, Kostka T. Predictors of quality of life in older people living at home
457
and in institutions. Aging Clinical and Experimental Research.
2004;16(3):212-458
220.
459
12. Devlin NJ, Brooks R. EQ-5D and the EuroQol Group: Past, Present and Future.
460
Appl Health Econ Health Policy. 2017;15(2):127–37.
461
13. Parkin D, Devlin N. Is there a case for using visual analogue scale valuations in
462
cost-utility analysis? Health Econ [Internet]. 2006 Jul 1 [cited 2018 Apr
463
25];15(7):653–64. Available from: http://doi.wiley.com/10.1002/hec.1086
464
14. Feng Y, Parkin D, Devlin NJ. Assessing the performance of the EQ-VAS in the
465
NHS PROMs programme. Qual Life Res. 2014; 23(3):977–89.
466
15. Hounsome N, Orrell M, Edwards RT. EQ-5D as a Quality of Life Measure in
467
People with Dementia and Their Carers: Evidence and Key Issues. Value in
468
Health. 2011;14(2):390-399.
469
16. Devine A, Taylor SJC, Spencer A, Diaz-Ordaz K, Eldridge S, Underwood M. The
470
agreement between proxy and self-completed EQ-5D for care home residents
471
was better for index scores than individual domains. Journal of Clinical
472
Epidemiology. 2014;67(9):1035-1043.
473
17. Bulamu NB, Kaambwa B, Ratcliffe J. A systematic review of instruments for
474
measuring outcomes in economic evaluation within aged care. Health and Quality
475
of Life Outcomes. 2015;13(1).
476
18. van Leeuwen KM, Bosmans JE, Jansen AP, Hoogendijk EO, van Tulder MW, van
477
der Horst HE, et al. Comparing Measurement Properties of the EQ-5D-3L,
478
ICECAP-O, and ASCOT in Frail Older Adults. Value in health : the Journal of the
479
International Society for Pharmacoeconomics and Outcomes Research.
480
2015;18(1):35-43.
481
19. Benson T, Williams DH, Potts HWW. Performance of EQ-5D, howRu and Oxford
482
hip & knee scores in assessing the outcome of hip and knee replacements. BMC
483
Health Services Research. 2016;16(1).
484
20. Benson T, Potts HWW, Whatling JM, Patterson D. Comparison of howRU and
485
EQ-5D measures of health-related quality of life in an outpatient clinic. Inform
486
Prim Care. 2013;21(1):12-17.
487
21. Hendriks SH, Rutgers J, van Dijk PR, Groenier KH, Bilo HJG, Kleefstra N, et al.
488
Validation of the howRu and howRwe questionnaires at the individual patient
489
level. BMC Health Services Research. 2015;15(1).
490
22. Welsh TJ, Gordon AL, Gladman JR. Comprehensive geriatric assessment - a
491
guide for the non-specialist. Int J Clin Pract. 2014. 68(3): 290–293 492
23. Dobson C. Conducting research with people not having the capacity to consent to
493
their participation. A practical guide for researchers [Internet]. Leicester, UK: The
494
British Psychological Society; 2017 [cited 1 December 2017]. Available from:
495
https://pdfs.semanticscholar.org/f97c/5a3d8605e24eaaf965b64e42c690d42a618 496
2.pdf 497
12
24. Selai C, Pickard S, Johnston JA. The collection of EuroQol EQ-5D data via
498
proxies. EQ Plenary Meeting in York: September, 2002
499
25. van Hout B, Janssen MF, Feng Y-S, Kohlmann T, Busschbach J, Golicki D, et al.
500
Interim Scoring for the EQ-5D-5L: Mapping the EQ-5D-5L to EQ-5D-3L Value
501
Sets. Value Heal.;15(5):708–15.
502
26. Vanbelle S, Albert A. A note on the linearly weighted kappa coefficient for ordinal
503
scales. Statistical Methodology. 2009; 6(2):157-163.
504
27. Brenner H, Kliebsch U. Dependence of Weighted Kappa Coefficients on the
505
Number of Categories. Epidemiology. 1996;7(2):199-202.
506
28. Cicchetti DV, Allison T. A New Procedure for Assessing Reliability of Scoring
507
EEG Sleep Recordings. American Journal of EEG Technology.
1971;11(3):101-508
110.
509
29. Landis JR, Koch GG. The measurement of observer agreement for categorical
510
data. Biometrics. 1977;33(1):159.
511
30. Harwell MR, Rubinstein EN, Hayes WS, Olds CC. Summarizing Monte Carlo
512
Results in Methodological Research: The One- and Two-Factor Fixed Effects
513
ANOVA Cases. J Educ Stat. 1992 Dec 23;17(4):315–39.
514
31. Kerry SM, Bland JM. Unequal cluster sizes for trials in English and Welsh general
515
practice: implications for sample size calculations. Statistics in Medicine.
516