First Impressions on the State of Cellular Data
Connectivity in India
Zahir Koradia
ΘGoutham Mannava
§Aravindh Raman
§Gaurav Aggarwal
§Vinay Ribeiro
§Aaditeshwar Seth
§Sebastian Ardon
ξAnirban Mahanti
ξSipat Triukose
ξDept. of Comp Sc
IIT BombayΘ Mumbai, IndiaDept. of Comp Sc
IIT Delhi§ New Delhi, IndiaNational ICT Australia
ξ Sydney, AustraliaABSTRACT
Cellular penetration in India has grown tremendously in re-cent years and provides an opportunity to bridge the digital divide. However, there is little understanding of the state of cellular data connectivity in India. In this paper, we present first impressions on cellular data network performance in In-dia. We present a measurement framework designed specif-ically for remote deployments and intermittent connectiv-ity. Using this framework we evaluate three GSM based and one CDMA based cellular service providers through active measurements conducted at five rural, one semi-urban, and one urban locations. Through analysis of about 450 hours of measurement data collected over a 3-month period, we present the throughput and latency performance of cellular service providers and provide insights into the architecture of the service provider networks. Our analysis reveals as-pects in cellular network design that interfere with standard protocols such as TCP, and suggests ways to improve per-formance.
Categories and Subject Descriptors
C.4 [Performance of Systems]: Reliability, availability, and serviceability
General Terms
Measurement, Performance, Reliability
Keywords
Cellular data networks
1.
INTRODUCTION
Permission to make digital or hard copies of all or part of this work for per-sonal or classroom use is granted without fee provided that copies are not made or distributed for profit or commercial advantage and that copies bear this notice and the full citation on the first page. Copyrights for components of this work owned by others than the author(s) must be honored. Abstract-ing with credit is permitted. To copy otherwise, or republish, to post on servers or to redistribute to lists, requires prior specific permission and/or a fee. Request permissions from [email protected].
ACM DEV-4,December 06–07, 2013. Cape Town, South Africa
Copyright is held by the authors. Publication rights licensed to ACM. ACM 978-1-4503-2558-5/13/12 ...$15.00
http://dx.doi.org/10.1145/2537052.2537064.
India has experienced significant growth in cellular pen-etration in recent years. A recent report by the Telecom Regulatory Authority of India notes that India has about 860 million cellular network subscriptions [8]. With wired broadband (>256Kbps) connectivity available to less than 2% of the population [8], cellular data connectivity provides an avenue to bridge the digital divide and provide Internet access to the rural regions of India.
There is, however, little understanding of performance of cellular data connectivity in India. While cellular data net-works in the developed world have been studied [4, 18, 19], with recent more recent works considering data usage and TCP performance on 3G/4G networks [17, 29], such studies have not been performed in India. In the absence of sys-tematic studies and with cellular service providers always advertising maximum achievable physical data rate, one is left to rely on anecdotal evidence and hearsay.
In this paper, we attempt to build an understanding of cellular data connectivity in India with the larger goal of improving end-user experience on them. We evaluate avail-ability, throughput, latency, and other network characteris-tics of four cellular service providers across seven locations over a period of 3 months. We focus on understanding rural cellular data connectivity by choosing five rural, one semi-urban, and one urban location for our measurement studies. We make two key contributions in this paper. First, we develop a robust, scalable, and extensible suite to conduct active client side measurements in rural regions. Second, through a variety of tests and with over 450 hours of mea-surement data collected over a period of 3 months, we pro-vide key insights about the cellular data networks in India, which are presented in Table 1.
Our observations have important implications. First, there is potential for significantly improving end user experience on 2G and 3G networks if methods of removingconnection stalls without negatively impacting TCP throughputs can be identified. Second, content providers can further improve the experience by placing content within the service provider networks. Finally, service providers can improve end user ex-perience by configuring networks to provide lower latencies, which seems possible as shown by one service provider Idea. The rest of the paper is organized as follows. We start with a brief introduction to cellular data technologies in Sec-tion 2 and then discuss related work in SecSec-tion 3. We out-line the measurement architecture and the tests conducted
in Section 4 and present the results in Section 5. Then in Section 6, we explore a peculiar phenomenon we observed in TCP flows, which we call connection stalls. Section 7 summarizes the results and concludes the paper.
2.
CELLULAR DATA TECHNOLOGIES
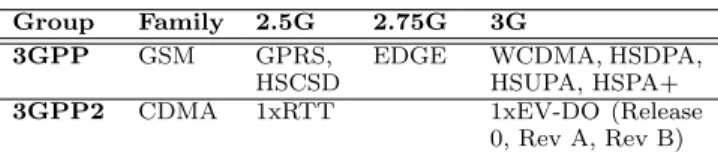
The evolution of cellular data technologies over the past 15 years has been complex. Multiple generations of technolo-gies have been introduced, with multiple standards span-ning each generation, and each standard defispan-ning a variety of modulations, data rates, and device classes. The situation is further complicated by differences in the technologies de-ployed around the world and differences between standards’ names and marketing terms used to popularize them. This section provides a brief history of cellular data technology evolution and identifies technologies deployed in India.
Table 2: Evolution of Cellular Data Technologies. Group Family 2.5G 2.75G 3G
3GPP GSM GPRS,
HSCSD
EDGE WCDMA, HSDPA, HSUPA, HSPA+
3GPP2 CDMA 1xRTT 1xEV-DO (Release 0, Rev A, Rev B) TheThird Generation Partnership Program (3GPP)and Third Generation Partnership Program 2 (3GPP2)were cre-ated by telecom standards development organizations to guide cellular data standards development based on GSM and CDMA technologies, respectively. Table 2 shows the stan-dards introduced under the 3GPP and 3GPP2 umbrella [5]. While GSM networks evolved to GPRS and EDGE, which further evolved to HSPA networks, the CDMA networks evolved to 1xRTT followed by 1xEV-DO. Typically, data technologies prior to 3G are commonly referred to as 2G technologies although there are significant differences in data rates between technologies within the same generation.
In India, a majority of the operators use GSM technology and hence have evolved to EDGE, HSDPA, and HSUPA. Only three out of a total of 13 service providers across In-dia [23] operate on CDMA and have evolved to 1xRTT and 1xEV-DO. In this paper, we consider one CDMA-based ser-vice provider and three GSM-based serser-vice providers.
Figure 1: IP Tunneling in cellular data networks. GGSN/PDSN form the bridge (gateway) between the cellular client and the IP networks.
Figure 1 shows a schematic of IP layer communication between a cellular client and the Internet. A GPRS Gate-way Support Node (GGSN) connects the cellular clients to the Internet in a GSM based data network. GGSN is the first IP layer hop visible to the cellular client. IP packets between the cellular client and GGSN are tunnelled inside other cellular technologies over multiple hops. Packet Data Serving Node (PDSN) is the equivalent of GGSN in CDMA based data networks. Since GGSN and PDSN play the role of gateways for cellular clients, they are commonly referred
to as cellular gateways or simply gateways in the rest of the paper.
3.
RELATED WORK
During the late 1990s and early 2000s when GPRS, 1xRTT, and WCDMA networks were being deployed, the perfor-mance of these networks, particularly, the perforperfor-mance of TCP on them received much attention [4, 18, 19, 27]. While the field measurements reported near theoretical through-put values [25, 30], the packet-level evaluations provided several insightful observations [13]. For example, Chakra-vorty et al. [6, 7] showed that small initial congestion win-dow combined with large RTT (>1000ms) caused ineffec-tive use of available bandwidth as it took a long time to fill the network pipe during slow start and hence impacted small file transfers. They also showed that large buffer sizes at gateways, a phenomenon nowadays referred to as “buffer bloat” [16], cause large delays in interactive applications and TCP SYN timeouts during new TCP flow creation. They recommended use of a transparent proxy between a GPRS client and a server, where the proxy uses a large initial win-dow to send data to the client while advertising a smaller receive window to the server to reduce impact of queuing. Subsequently, several recommendations for improving TCP performance on cellular networks have been evaluated [15, 2]. A majority of these studies are a decade old and the results may not be applicable today. Parameters like ini-tial congestion window size (from 1 to 3), receive window size (from 10KB to 80KB), and TCP Segment Size (from 500B to 1500B) have been increased to accommodate large Bandwidth-Delay Products common in today’s networks. Additionally, TCP SACK and fast retransmit is used by default thus reducing the impact of wireless packet loss. Fi-nally, the studies above have been conducted in developed world setting which is different from ours. In the rural re-gions of the developing world, cellular data connectivity is believed to be sparingly used, which may result in these net-works being differently provisioned.
More recently, several studies have evaluated the perfor-mance of 3G networks in the developed world [26, 24, 22, 29]. While these measurements are predominantly on access technologies different from those deployed in India, we sum-marize results relevant to our work. Elmokashfi et al. [11] evaluated latencies on two HSPA and one EV-DO networks in Norway and reported that the delay characteristics de-pend mainly on network configuration rather than location or measurement device. Similar to this we find that latency in EDGE networks of one service provider is significantly lower that the other two providers, which we assume is a result of network configuration. In contrast, measurements by Tan et al. [29] in Hong Kong show significant customiza-tion in a cell-by-cell manner according to demographics of individual sites. This indicates that cellular network deploy-ments may vary across countries and service providers. Jur-vansuu et al. [17] evaluate performance of TCP on WCDMA and HSDPA networks and find that HSDPA provides an provement in TCP throughput over WCDMA, but the im-provement is modest, particularly for short duration flows. The authors attribute this to large RTTs compared to wired networks and small initial congestion window size. Our mea-surements, although conducted on slightly different access technologies, show a significant difference in throughput be-tween 2G and 3G technologies.
Table 1: Key Results of Cellular Data Measurements
Property Key Result Section
Availability None of the rural measurement locations has 3G network access. During the measurement period, availability of Internet connection in rural regions was lower compared to urban regions.
5.1
Throughput A large percentage of TCP flows experience long periods of inactivity stalling the flow and causing timeouts. We call the phenomenon aconnection stall, which seems related to either burstiness of
flows or number of in-flight packets.
5.2
Latency Ping RTTs measured across most service providers are significantly higher than those observed in the developed regions. EDGE/HSDPA air interfaces are not the cause of high latencies; rather, it is likely that network configuration causes them.
5.3
Content Placement
Placing content within the service provider network can reduce round trip latencies. We find that some websites have placed content within three of the four service provider networks we evaluate. We also find that latency to the in-network servers are generally lower by 50%.
5.4
Urban Provi-sioning
One service provider, Airtel, provisions preferentially for urban regions. This is noticed in higher throughputs and lower latencies in Delhi, our urban measurement point, using the same access technologies as the rural regions.
5.4
Performance of home broadband networks has also been of interest to the academic community [14, 9, 28, 21, 1, 20, 10]. Of particular relevance to us were the tools and tech-niques developed as a part of these measurements, which we evaluated in our environments before choosing our tools. Specifically, we use Netalyzr [20] for several one time tests as described later in Section 4. Our measurement archi-tecture design also draws upon prior work by Kreibich et al. [20], borrowing the key concept of having a separate con-trol server to serve the tests to be conducted by the client.
4.
METHODOLOGY
Our goal is to study basic network performance metrics such as throughput, latency, DNS lookup times of cellular service providers in rural India. At a high-level, we are pre-sented withtwo challenges. The first challenge is selection of locations in rural India for conducting measurement cam-paigns. The second challenge is to design a measurement architecture, consisting of appropriate hardware and soft-ware, that can be deployed in rural locations, require mini-mal manual intervention, and efficiently cope with the chal-lenges of electricity outages, rodents in the building chew-ing cables 1
, and minimal technical support. This section describes how we addressed these challenges and concludes with a description of our measurement campaign.
4.1
Measurement Sites and Service Providers
During the conceptualisation of our work, we determined that the logistics of us manning remote measurement loca-tions is daunting because accessing rural communities is of-ten very difficult and also because working relationship with locals of these communities is necessary for a successful ex-periment campaign. From a technical perspective the logis-tics of location identification, equipment setup, and main-tenance are mundane activities, but are quite challenging and, as in our case, often dictate the number of measure-ment points and quality of research.The best opportunity for us is in leveraging our existing relationship with PRADAN, a NGO that has presence in over 4,000 villages across eight of the poorest states in In-dia. PRADAN provided logistic support for our experiment campaign. They helped in selecting locations and service 1
A rodent did chew up a power cable at one of our mea-surement locations and our monitoring infrastructure helped identify the issue before measurement data was lost.
providers for measurements, finding appropriate transport to reach the locations, and finding food and accommoda-tion. In consultation with PRADAN staff, we chose five rural locations namely Ukwa, Lamta, Paraswada, Amarpur, and Samnapur, and one semi-urban location Dindori. These six sites are all based in the state of Madhya Pradesh in central India. (Two of our rural sites had no hotels or guest houses, and PRADAN staff provided us food and lodging in their offices.) In addition to these rural and semi-urban locations, we also conduct measurements in Delhi, which is selected to represent Urban India. For ease of exposition, we will use the labels R1 to R5 for rural locations, S1 for the semi-urban location, andU1 for the urban location.
We chose BSNL, Airtel, Idea, and Reliance as four dif-ferent service providers for measurements. BSNL, Airtel, and Idea provide data connectivity over GSM based tech-nologies EDGE and HSDPA, which we refer to as G1,G2, andG3 respectively for the rest of the paper. Reliance pro-vides connectivity over CDMA based technologies 1xRTT and 1xEV-DO, and so we refer to it at C1. At any given location, three best service providers were evaluated, the choice of which was based on knowledge of local PRADAN staff about providers’ connection quality and pilot measure-ments conducted at the location. OverallG1 andG2 were evaluated in 6,G3 in 5, andC1 in 3 locations.
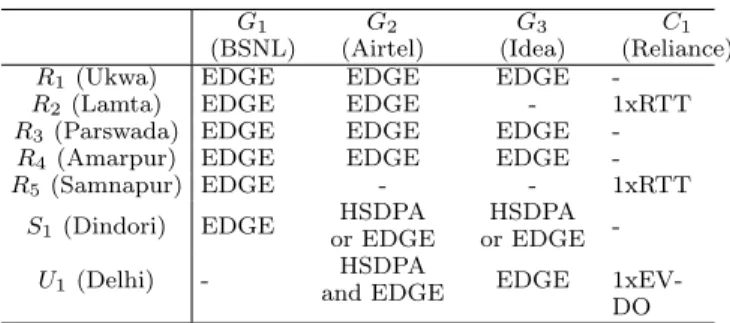
Table 3 summarizes the access technologies available at our measurement locations. At some locations the access technology alternated between EDGE and HSDPA, result-ing in some measurements usresult-ing EDGE and others usresult-ing HSDPA.
Table 3: Measurement locations/service providers.
G1 (BSNL) G2 (Airtel) G3 (Idea) C1 (Reliance)
R1(Ukwa) EDGE EDGE EDGE
-R2(Lamta) EDGE EDGE - 1xRTT
R3(Parswada) EDGE EDGE EDGE
-R4 (Amarpur) EDGE EDGE EDGE
-R5 (Samnapur) EDGE - - 1xRTT
S1 (Dindori) EDGE or EDGEHSDPA or EDGEHSDPA
-U1 (Delhi) - and EDGEHSDPA EDGE 1xEV-DO
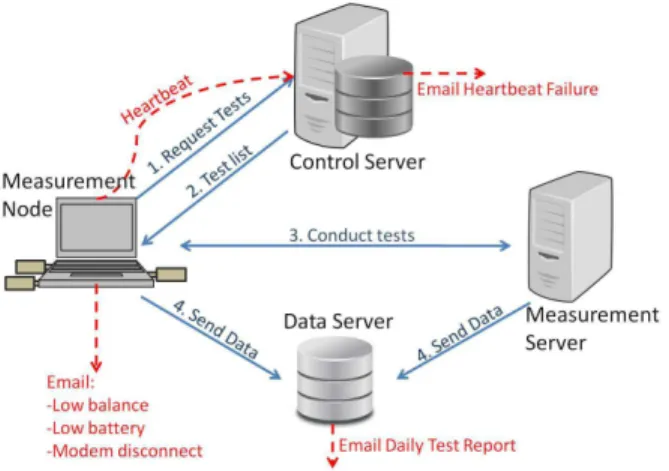
We designed our measurement architecture for rural de-ployments, thus focusing on robustness, flexibility to change the suite post deployment, and remote monitoring. Figure 2 shows the key components of the architecture.
Our measurement clients are low cost netbooks with 1GHz processors, 1GB RAM, and three USB modem ports. The netbooks provided about 10 hours of battery backup, which allowed us to conduct measurements through several hours of power outages - a frequent phenomenon in rural India. Additionally, we were able to connect three USB modems to each computer reducing the cost of deployment per modem. The modems used were Huawei E173 for EDGE/HSPA net-works and Huawei EC159 for 1xRTT/1xEV-DO netnet-works. Both modems were capable of handling throughputs adver-tised by the service providers. The measurement client is configured with a unique node ID and information about the service providers and corresponding access technologies to be used. For each (client id, service provider, access tech-nology) tuple, the client requests acontrol server for a list of tests to be conducted.
The control server maintains the list of tests to be con-ducted for any given (client id, service provider, access tech-nology) tuple. In response to a client request, the control server sends a list of tests. In addition, it also provides rel-evant parameters for each of the tests in the response. For example, when conducting a latency test using ping, the control server provides the IP address of the remote node and the number of ping packets to be sent. Similarly, when conducting a TCP throughput test using iperf, the control server provides the IP address of ameasurement server and the duration of the test.
The measurement server is well provisioned (in terms of bandwidth) and it is primarily used as the remote node for conducting throughput tests. The measurement server be-ing in our control allows collectbe-ing packet level traces from both sides of a flow during the throughput tests. In addi-tion, the measurement server is also used as remote node for latency and packet loss tests. The separation of control and measurement server allows us to add multiple measurement servers as the number of measurement clients increase.
The results of all the measurements are uploaded by the clients to adata server. Packet level traces from the mea-surement server are also sent to the data server. Data thus collected is then further processed for analysis.
For our experiments we use a Linode (www.linode.com) virtual machine as both measurement and control server, and a server located at IIT Delhi as the data server.
Flexibility: A separate control server that decides what tests to run provides significant flexibility, which we outline from our own experience here. We use the control server to specify different file sizes to download depending on the access technology. In addition to the measurement tests we have also included additional commands like download, upload, andinstall on the client that can be executed when requested by the control server. We use these commands to add new tests to our client and also upload the test results to the data server. Finally, there have been situations where command-line access to the clients was required, for which we created a new command that creates an SSH tunnel and then sends an email notification to us. We are now able to connect to any of the clients by making the client execute this command via the control server.
Monitoring Suite Health: We implemented monitoring
Figure 2: Measurement architecture. Solid lines test ex-ecution steps. Dashed lines show suite health monitoring components.
mechanisms for several aspects of our infrastructure as de-tailed below. First, we developed a heartbeat system that periodically sends netbook battery life information, signal strength, and connection status of the three modems to the control server. In case of power outage or disconnection for a long period, we solicit help from the PRADAN field staff to rectify the problem. Additionally, if the control server does not receive the Heartbeat UDP packets for a threshold amount of time, it sends an alert mail. Second, we deployed a daily reporting system that sends a summary of successful tests at each client. Third, we developed an alert system to report if a USB modem is detached from the client net-book. We use this as a security feature to detect client device tampering2. Fourth, we developed a system to track our cellular data usage since we utilise “pay as you go” data plans3
. Specifically, we periodically check for available data balance using an AT command on the clients and sends an alert mail if the balance is below a threshold.
4.3
Measurement Tests
We focused on basic network performance metrics such as throughput, latency, packet loss rates, and service provider network characteristics of IP address allocation, in-network caching, and gateway provisioning. Unless stated otherwise, the results reported in the paper are from measurements conducted over a 3-month period (21 March 2013 to 20 June 2013). Table 4 summarizes the tests reported in this paper. For each (client, service provider) tuple, the periodic tests included throughput, latency, and DNS lookup time tests. We used iperf to run a single TCP flow in downlink direction to measure downlink throughput. A similar test measured uplink throughput. ICMP ping packets were sent to a set of 20 landmark nodes to measure round trip time between the client and the landmark nodes. The landmark nodes in-cluded government websites like www.india.gov.in, major news websites likewww.timesofindia.com, ecommerce web-sites likewww.ebay.in, search websitewww.google.com, and the measurement server. We also conducted traceroutes to the same landmark nodes to understand the path followed, 2
Luckily we have not received an alert of this kind so far! 3
We found tracking bills with different billing dates too cum-bersome and hence chose to use “Pay as you go” connections.
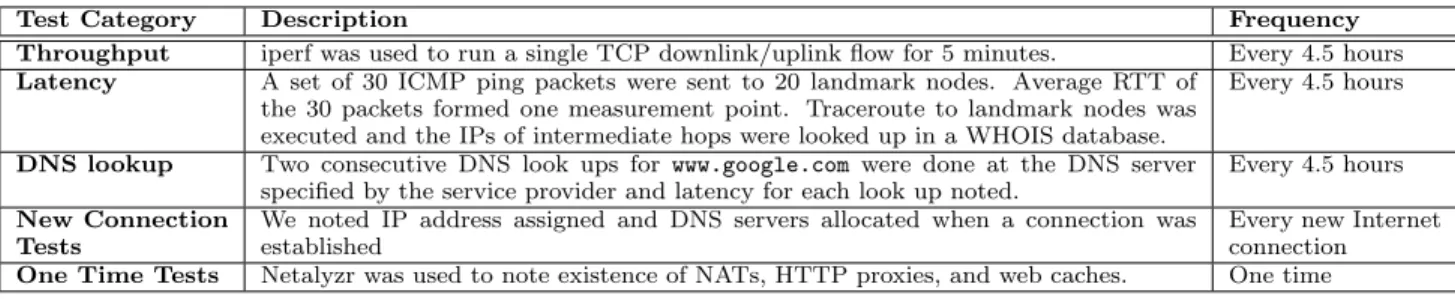
Table 4: Description of tests conducted at each client for each service provider.
Test Category Description Frequency Throughput iperf was used to run a single TCP downlink/uplink flow for 5 minutes. Every 4.5 hours
Latency A set of 30 ICMP ping packets were sent to 20 landmark nodes. Average RTT of the 30 packets formed one measurement point. Traceroute to landmark nodes was executed and the IPs of intermediate hops were looked up in a WHOIS database.
Every 4.5 hours
DNS lookup Two consecutive DNS look ups for www.google.com were done at the DNS server specified by the service provider and latency for each look up noted.
Every 4.5 hours
New Connection Tests
We noted IP address assigned and DNS servers allocated when a connection was established
Every new Internet connection
One Time Tests Netalyzr was used to note existence of NATs, HTTP proxies, and web caches. One time
and looked up the IP addresses of the intermediate hops on a WHOIS database to determine the ownership of the inter-mediate hops. We also noted the IP address of the cellular gateway, the node that acts as a bridge between the cellular network and the IP network, and by definition the first node returned by traceroute. Together all the periodic tests took 70 minutes to complete per service provider. With three service providers being measured at each client, tests for a service provider repeated 4.5 hours.
We logged the IP addresses assigned to the clients and the DNS servers provided when a new connection is estab-lished. We also conducted additional tests such as testing the existence of NATs, HTTP proxies, and web caches in the service provider networks using Netalyzr [20]. These tests were conducted only once as they capture properties of ser-vice provider networks that rarely change. Finally, metrics like signal strength reported by the modem and the access technology being used by the modem to talk to the base station were logged every 2 seconds.
5.
MEASUREMENT RESULTS
5.1
Availability
We were interested in understanding the type of connec-tivity available in the rural locations. We configured the USB modems to connect to the service providers using the highest generation access technology available, and periodi-cally logged the mode in which the modems were connected. The logs show that only EDGE/1xRTT connectivity is avail-able in our rural locations. However, the semi-urban loca-tion (S1) is found to transition between EDGE and HSDPA with the modem spending∼20% time in HSDPA. (No tran-sitions occurred when an iperf TCP flow was in-progress.) Our urban location (U1) had continuous HSDPA/1xEV-DO connectivity for all the evaluated service providers.
We also evaluated percentage of duration for which Inter-net connectivity was available. To do so we timestamped network connection and disconnection events reported by the USB modems and noted device down times and modem physical disconnection durations. Using this we calculate availability for the (service provider, location) tuple as:
availability= connected time
(measurement duration−down time) whereconnected time is the duration in seconds for which the Internet is connected for the tuple,measurement duration is the time between the first experiment and the last experi-ment conducted for the tuple, anddown timeis the duration for which either the measurement node was down or the USB modem was disconnected from the measurement node.
Figure 3 shows availability of service providers across rural
and urban locations. Since there was little variation in avail-ability between rural and semi-urban locations of a provider we present a single bar representing average availability for these locations. As shown in the figure, availability is con-sistently lower in rural locations by about 15% compared to availability in urban regions across all service providers. One exception isC1 where availability in both rural and urban locations is below 50%.
In our measurements, rural regions lag behind urban re-gions in type of connectivity and availability.
Figure 3: Availability of service providers across rural and urban locations. Error bars indicate standard devi-ation across availability at rural locdevi-ations.
5.2
Throughput
Figure 4: Measured 2G downlink throughputs across lo-cations and service providers. Error bars indicate std-dev across experiment runs. Horizontal dashed lines in-dicate TCP throughput in ideal conditions.
Are the achieved throughputs close to their theoret-ical maximums?
Figure 4 shows the average 2G throughputs measured across locations and service providers4
along with the stan-dard deviation in the measurements. The horizontal dashed line shows the theoretical maximum throughput, which is calculated using known MAC layer good-put values from the standards and assuming 1500 bytes IP packet size includ-ing 40 bytes overhead of TCP/IP headers. The achieved throughputs are (as may be expected) significantly lower than their theoretical maximums. 3G connections (not shown in the figure), however, provide reasonably good “broad-band” like performance (>256 Kbps).
Are throughputs better at night or on weekends?
Figure 5: Diurnal patterns in 2G downlink throughputs.
To evaluate existence of diurnal patterns we compare puts of flows conducted between 9am and 6pm with through-put of flows conducted between 10pm and 6am. We find di-urnal patterns inG2EDGE networks in both the uplink and downlink directions with∼25% higher throughput in both the directions at night. G1 EDGE networks have ∼ 40% higher throughput at night in downlink direction. Among 3G connections G2 HSDPA networks have ∼ 20% higher downlink throughputs at night. Figure 5 shows the down-link direction diurnal patterns for 2G networks.
Analysis for weekday-weekend patterns shows no signifi-cant difference between throughputs achieved on weekdays and weekends in our rural locations. The weekend through-puts for service provider C1’s 3G connection in the urban locationU1 is lower than on the weekdays. This may indi-cate thatC1’s 3G services are used more for leisure activities at homes on the weekends than in the offices.
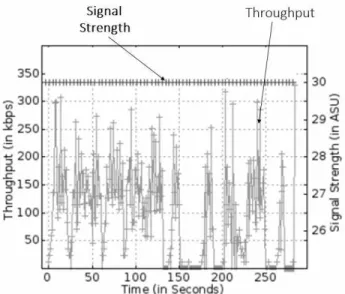
Are throughputs correlated with link quality?
To evaluate this hypothesis, we measure throughput for every two second interval in a single TCP flow and correlate it with the signal reported by the modem at the end of the interval. The Pearson correlation coefficient is close to 0 in all the flows indicating no correlation between throughputs and signal strength as measured by the USB modem.
We visually compared the signal strength reported by the USB modem and the throughput achieved during the period for further analysis. As an illustration, Figure 6 shows the observed signal strength and throughput as a function of 4
Uplink throughputs show similar characteristics and have been omitted for brevity.
Figure 6: Comparison of signal strength at 2s interval and throughput achieved during that period. Arbitrary Signal Unit (ASU) is linearly correlated to dBm with maximum and minimum values of 31 and 0 respectively.
time for a downlink flow over an EDGE network. Notice that throughput varies between 0 and 300Kbps without any changes in signal strength. The signal strength reported across all the measurements was high between 25 and 30, and changed very rarely, suggesting no apparent correlation between signal strength reported by the modems and the achieved throughput.
We also tracked the base station to which the modems were associated and observed no handoffs during our mea-surements. Thus, handoffs are not responsible for the low throughputs observed by us.
Later in Section 6, we present a detailed analysis of the cause of low throughputs.
5.3
Latency
We analyze the ping round trip latencies and traceroute paths from measurement nodes to landmark nodes.
Figure 7: CDF of round trip latencies to www.google.co.in for different service providers and locations.
Figure 7 shows CDFs of the round trip latencies towww. google.co.inacross different service providers, access
tech-nologies, and locations. The figure shows significantly high ping times: latencies between 600ms and 1200ms are com-mon for G1 and G2 EDGE connections. G3 EDGE net-works, however, have lower latencies between 250ms and 350ms, indicating that latencies in other EDGE networks are not a property of the EDGE air interface and are likely result of network configuration, which correlates well with others’ observations [11]. Figure 7 also shows round trip latencies consistently around 150ms forC1 1xEV-DO net-works, which are similar to the RTTs measured recently in developed countries [16, 11].
Does content placement within service provider net-work improve latency?
Our analysis of DNS lookup responses show that four of the landmark nodes,www.timesofindia.com,www.cricinfo. com, www.ebay.in, and www.ndtv.com use Akamai’s con-tent distribution network. We concluded this as the DNS look up responses contained domain names with “akamai” in them. In addition, lookup of the returned IP addresses in the WHOIS database shows that whenG1,G3, orC1is used to access the above four websites, the IP address returned is often owned by the same service provider. This shows that Akamai usesG1,G3, andC1 to host content of all the four landmark nodes. We call the servers whose IP is owned by the same service provider asin-network servers. Similarly, we the servers whose IP is not owned by the provider are calledoutside-network servers.
We next compare latencies of in-network servers and outside-network servers. During DNS lookups of the above men-tioned landmark nodes, we found in-network IP addresses in 2.15% of the traceroutes when G1 was used. Similarly, in-network IP addresses were returned by the DNS servers in 72.86% cases forG3 and in 87.75% cases forC1. A com-parison of RTTs to in-network IP addresses with those to outside-network IP addresses in G1 and G3 show ∼ 50% reduction in latencies for in-network IP addresses on both EDGE and HSDPA networks. C1, however, shows no such reduction in latency. One possible explanation for this ob-servation is that the wired part of theG1 andG3 networks contribute a non-trivial amount to the overall latency, but the wireless part dominates the overall latency observed in
C1.
5.4
Network Architecture
IP Address Allocation: All providers assigned public IP addresses to the clients across locations and access technolo-gies. In addition, we have found no NAT or firewall deploy-ments within the service provider networks. This means that all the clients of the service providers are reachable from the Internet, which we verified manually. While absence of NATs and firewalls avoids potential performance degrada-tion [3, 31], as a downside it exposes the clients to attacks. We also found no evidence of in-network virus detection, confirmed by downloading the anti-malware test file pro-vided by EICAR (www.eicar.org). Thus, cellular services provide little protection to their clients against attacks.
We occasionally observed that the IP addresses assigned byG3 are in the IP range 100.64.0.0/10, which is a shared address space usually used by carrier grade NATs. During these periods, the client device was not accessible from the Internet and Netalyzr confirmed presence of a carrier grade NAT. We speculate thatG3 uses a NAT when the pool of public IPs is exhausted.
In-network caching: Netalyzr tests show that none of the service providers employ HTTP proxies or web caches. We believe service providers can improve end user experience by employing web caches in their networks. Our observa-tions about performance improvements by in-network con-tent placement provide evidence for the same.
Gateway allocations:The service providers appear to use only a few gateways: we discovered 5, 3, 4, and 2 gateways forG1,G2, G3, and C1 respectively. Such low number of gateways is consistent with 4-6 gateways observed by Xu et al. in the U.S [32]. As proposed by Xu et al., content providers can use this information to optimize end-user ex-perience by carefully placing content close to the gateways.
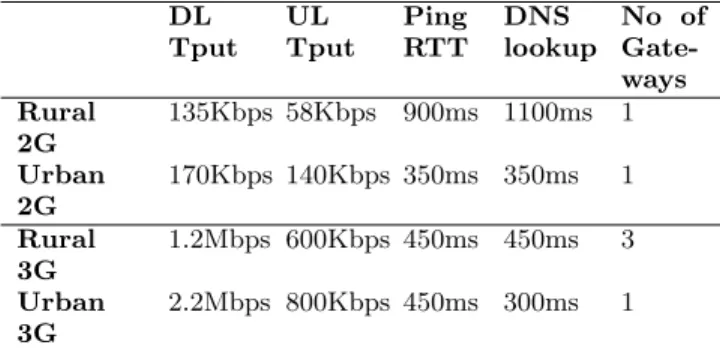
Special provisioning for urban regions: G2seems to al-locate additional resources to service clients in the urban lo-cation. As shown in Table 5, we have found evidence for this across several dimensions of our measurements. Two out of the 3 gateways observed are only seen in the urban location’s 3G connection. Additionally, the urban location’s 2G con-nection has higher throughput and lower latency compared toG2’s 2G connections in other locations. DNS lookup times are also found to be lower in the urban location’s 2G con-nection. Thus, G2 seems to focus more on providing good quality service in the urban locations.
Table 5: Preferential urban provisioning byG2
DL Tput UL Tput Ping RTT DNS lookup No of Gate-ways Rural 2G 135Kbps 58Kbps 900ms 1100ms 1 Urban 2G 170Kbps 140Kbps 350ms 350ms 1 Rural 3G 1.2Mbps 600Kbps 450ms 450ms 3 Urban 3G 2.2Mbps 800Kbps 450ms 300ms 1
6.
CONNECTION STALL
During our analysis of packet traces of iperf tests we no-ticed several instances where the data transfer stalled for a long period of time due to multiple retransmission timeouts of the same packet. Figure 8 illustrates one such stalled connection using a sender-side sequence graph.
There are two important sections of the graph in Fig-ure 8. The first section labelledP1 shows a single packet loss. Other packets after the lost packet are delivered result-ing in DUPACKs. A fast retransmit is triggered as a result of receiving the third DUPACK. However, due to queuing delay, it takes about 10 seconds for the retransmitted packet to be acknowledged. This phenomenon has been observed during early evaluation of TCP performance on GPRS [6]. The queuing delay, caused by large buffer sizes at gateways, is also referred to as buffer bloat [12, 16], and is known to cause delays in interactive flows and timeouts in new TCP flows. Reducing buffer sizes at gateways, using active queue management in networks and dynamically adjusting window size of the receiver have been suggested as possible solutions for this problem.
However, the section labelledP2 in Figure 8 shows a dif-ferent kind of packet loss. When the lost packet inP1 is
ac-Figure 8: A sender side sequence graph showing a con-nection stall. Red vertical lines indicate sent packets; length of the line indicates number of bytes sent. Green line represents bytes acknowledged. Pink vertical lines represent SACKs and the blue line represents advertised receive window.
knowledged, the receive window shown by the blue line and the congestion window increase significantly. This causes the sender to send a large amount of data. In case ofP2, the sender sends roughly 50,000 bytes in 2 large packets5
in-stantaneously followed by several smaller packets containing another 40,000 bytes. This is shown by red vertical lines.
First few packets in the burst sent are acknowledged as shown by the green line. However, several packets marked as lost packetsin the figure are lost, which we confirmed by ana-lyzing the receiver-side trace. Notice that packets marked as stalled packets in the figure do reach the receiver, but only after a delay of more than 30s. Receiver side traces con-firmed that the packets were indeed delayed in the forward direction. Since the stalled packets were somehow delayed for a long time, the sender did not receive any DUPACKs causing the sender to timeout and retransmit thefirst lost packet. The sender timed-out and retransmitted thefirst lost packet multiple times before the packet was acknowledged. We term the phenomenon of a flow stall due to timeouts shown in sectionP2 in Figure 8 asconnection stalls.
Connection stalls impact throughputs in two ways. First, since the sender times-out during such a period, the sender detects the event as a congestion and reduces the congestion window andssthresh to its initial values and executes slow start. This can reduce the throughput significantly depend-ing on the size of the congestion window prior to the stall. Second, the long period of inactivity in the flow also impacts the achieved throughput. Given the impact connection stalls can have on TCP, we next analyze the frequency of stalls and evaluate its impact on throughput in our measurements.
We say the connection is stalled if a TCP timeout causes retransmission and at least three packets are in flight during the retransmission. The test ofat least three packets in flight ensures that a timeout caused by loss of one of the last three transmitted packets is not detected as a stall. Timeouts for 5
TCP Segmentation Offloading (TSO) allows TCP to send large packets to the NIC, which are segmented by the NIC in to smaller MSS size packets before sending the data over the wire.
last three packets may not be an indication of connection stall as the sender can not receive three DUPACKS for these packets to perform fast retransmit.
How often do connection stalls occur?
Figure 9: Percentage of 2G downlink flows that experi-enced at least one connection stall.
Figure 9 shows the percentage of downlink flows across service providers and locations that contain at least one con-nection stalled event in 2G networks. We find stall in more than 40% of their flows across most locations. 3G connec-tions also experience stalls in about 30% of their downlink flows.
We also analyzed the amount of time a flow spent in the stalledstate. For this we definetime spent in stalled stateas the time at which thefirst lost packetis acknowledged minus the time at which it was first sent. Intuitively, this definition includes the delay that the flow would not have incurred in the absence of a stalling event. Using this definition we find that 2G downlink flows with stall events spend about 45 seconds or 15% of the total iperf test duration (300s) in stalled state. In 3G downlink networks, about 18s or 6% of the measurement time was spend in stalled state.
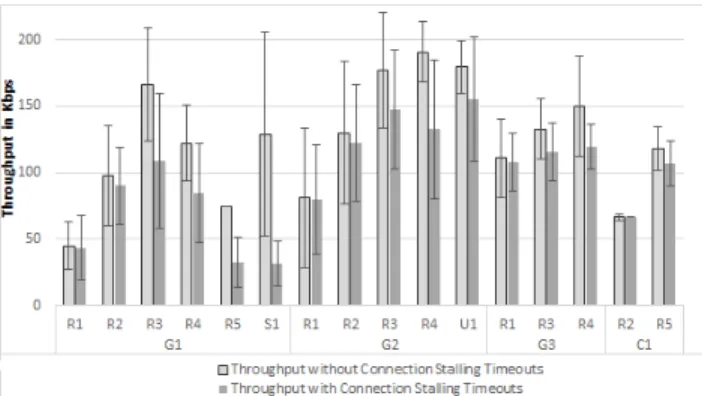
How do connection stalls impact throughput?
To evaluate the reduction in throughput because of stalls in 2G networks we divide the uplink and downlink flows in to two groups each: flows with and without stall events. We then calculate average throughputs across these four groups. We carry out the same exercise for 3G flows. The com-parison of throughputs of downlink flows with and without stalls for 2G connections is shown in Figure 10. Flows with-out stalls generally have at least 25% more throughput with maximum increase of 200% seen inG1atS1. The difference is even more significant in 3G downlink networks (G2 65%,
G3 100%), which is expected since the congestion window size and hence penalty for performing slow start is larger in 3G networks. Differences in uplink throughputs are similar to their downlink counter parts and we omit the details for brevity.
What causes stall events?
To identify if any aspect of our measurement infrastruc-ture contributed to stalls we designed a series of experi-ments, each having exactly one aspect different from our measurement setup. We describe each of these experiments and their results below.
We first check if our measurement server has any role in causing connections stalls. Our measurement server is a
vir-Figure 10: Difference in throughputs for flows with and without connection stalls in downlink 2G connections.
tual machine hosted by Linode in Japan. We run the iperf tests with a virtual machine in our university as the server and find connection stalls, which confirm that Linode in-frastructure played no role in causing the timeouts. We also conduct the same tests on a dedicated server to rule out impact of virtual machines in causing stalls.
We also rule out the contribution of our client hardware in causing stalls by conducting similar tests using Android based smartphones and still observing the timeouts. While our measurement tool iperf is unlikely to be the cause, we still confirm the same by downloading and uploading files using Firefox and observing the timeouts in those transfers. With aspects of our measurement infrastructure ruled out as cause of stalls, we revisit packet-level traces for clues. The graph correlating signal strength with achieved throughput in Figure 6 shows that stalls are unlikely to be the result of sudden drop in link quality. The graph shows that there were periods of zero throughput near 150s, 200s, and 250s marks on the x-axis with signal strength being constant at 30ASU. We verified that all of these were caused by connection stalls, thus confirming that stalls are not caused by reduced signal strength.
Connection stalls also cannot be completely explained by buffer bloat. Buffer bloats cause delays for a packet because large buffers allow many packets to be queued ahead of it. In case of connection stalls, data packets are stalled in the network for several seconds with no other packets ahead of them as all the packets ahead of them are dropped. Thus, no packets are queued ahead of the stalled packets within the same flow. Additionally, we controlled our experiments for cross flow traffic by ensuring that no other data transfer occurred on the measurement node during the experiment. Finally, we also ruled out packets for other devices caus-ing buffer bloat by confirmcaus-ing that the gateways allocate per device buffer across all locations and service providers. We confirmed this, by pinging www.google.com using one measurement node, and conducted iperf downlink test using another measurement node associated to the same base sta-tion and gateway as the first one. We observed no change in ping latencies before, during, and after iperf tests. We then conducted ping and iperf on the same node and observed increase in ping latencies during the iperf test. These two results together indicate per client buffer allocation at the gateways. Thus, connection stalls cannot be explained by buffer bloat.
An important insight that the sequence graph in Figure 8
provides is that stalls occurred after a large burst of data was sent, indicating that bursty transmission of data or large number of bytes in flight triggers the problem.
How does changing receive window size impact stalls?
One simple way of controlling burstiness of a flow and the number of bytes in flight is by tuning the receive window size. A common rule of thumb states that the receive window size should be equal to the Bandwidth Delay Product (BDP) or the product of throughput and quiescent RTT. In case of our EDGE networks the downlink BDP turns out to be (256Kbpsx1000ms)/8 or about 30,000 bytes. The default receive window size in our Linux client and servers is 87,380 bytes which can be expanded to 6MB if needed by TCP. We evaluate the impact of receive window size by changing these default settings on the receiver side of the flow and conducting downlink iperf tests.
We set the receive window size to 30,000 and conducted the iperf tests atR3onG1 andG2networks. We conducted 20 iperf tests for each service provider and measured the av-erage time spent in stalled state and achieved throughput. Table 6 shows the average time spent in stalled state for dif-ferent values of receive window sizes. As seen in the table, reducing the receive window size reduces the average time spent in stalled state significantly. This validates our intu-ition that connection stalls are somehow related to either burstiness of the flow or number of bytes in flight or both. However, changing the receive window size to BDP also re-duces the throughput significantly and so it may not be the best approach to avoid stalls and increase throughput.
Table 6: Comparison between downlink flows of default receive window size with window size of 30KB. G1 and
G2 connections evaluated inR3. Default Recv Wndw 30 KB Recv Wndw
G1% of flows with>1 stalls 47% 55.55%
G2% of flows with>1 stalls 56.4% 45%
G1 avg time spent in stalled state by flows with stalls
46.73s±46.61 18.87s±5.24
G2 avg time spent in stalled state by flows with stalls
37.78s±66.8 7.94s±2.51 G1 avg throughput 136Kbps±54 52.39Kbps ± 15.91 G2 avg throughput 159.2Kbps ± 43 57.43±2.76
We note here that our work presents only a preliminary attempt at reducing stalls. Detailed exploration of the prob-lem remains a part of our future work. We next summarize our results and conclude the paper.
7.
CONCLUDING REMARKS
We have conducted active measurements across 7 loca-tions over 4 cellular service providers using our measure-ments framework designed for rural deploymeasure-ments. About 450 hours of measurement data collected over 3 months provides important insights into the performance of cellular data net-works in India.
We find that only 2G connectivity is available in the rural locations we tested. Further, availability at rural locations is lower by about 15% across three of the four service providers we evaluate. Throughputs achieved by both 2G and 3G net-works are significantly lower than their advertised rates. We
find TCP throughput to be negatively impacted by connec-tion stalling events. We have found that occurrence of stalls are related to either burstiness of flows or large number of bytes in-flight.
We have identified several avenues for cellular service pro-viders and content propro-viders to improve end user experience for cellular data users. For instance, there is room for im-provement of round trip latencies in EDGE networks. Ser-vice providers currently do not use web caches right now and can potentially improve end user experience by deploy-ing them in the network. Further, content providers can gain from reduced latencies by placing content on servers within service provider networks.
One limitation of our work is the limited number of mea-surement points. This impacts our understanding of the cel-lular network infrastructure and limits the generalizability of our observations. While we are in the process of scal-ing the measurements, our desire to focus on rural locations and cellular access technologies makes it scaling deployments practically challenging.
Our immediate future work involves understanding the causes ofconnection stalls and exploring solutions to avoid them. This will be followed by analysis of short TCP flows and web traffic on cellular networks in rural and urban India.
8.
ACKNOWLEDGEMENTS
This work was supported by the Commonwealth of Aus-tralia and the Department of Science and Technology, In-dia, under the Australia-India Strategic Research Fund, and Ford Foundation, India. We acknowledge the support pro-vided by PRADAN in conducting the measurements reported in this study. We also acknowledge the help of Rahul Nis-hant, Sameer Pandit, and Arvind Mahla in deployment of the measurement suite.
9.
REFERENCES
[1] A. Akella, S. Seshan, and A. Shaikh. An empirical evaluation of wide-area internet bottlenecks. InProc. ACM Internet
Measurement Conference, pages 101–114, 2003.
[2] J. J. Alcaraz, F. Cerdan, and J. Garcia-Haro. Optimizing TCP and RLC interaction in the UMTS radio access network.
Network Magazine of Global Internetworking, 20(2):56–64,
March 2006.
[3] Mark Allman. On the performance of middleboxes. InProc.
ACM Internet Measurement Conference, IMC ’03, pages
307–312, 2003.
[4] P. Benko, G. Malicsko, and A. Veres. A large-scale, passive analysis of end-to-end TCP performance over GPRS. In
INFOCOM 2004, pages 1882–1892, 2004.
[5] A. Bhalla and M. Bhalla. Generations of mobile wireless technology: A survey.International Journal of Computer
Applications, 5(4):26–32, August 2010.
[6] R. Chakravorty, J. Cartwright, and I. Pratt. Practical experience with TCP over GPRS. InIEEE Global
Telecommunications Conference, volume 2, pages 1678–1682,
2002.
[7] R. Chakravorty, A. Clark, and I. Pratt. GPRSWeb: optimizing the web for GPRS links. InProc. International conference on
Mobile Systems, Applications and Services, pages 317–330,
2003.
[8] Government of India Department of Telecom. Telecom Annual Report - India, 2012 - 2013, 2013.
[9] L. DiCioccio, R. Teixeira, and C. Rosenberg. Impact of home networks on end-to-end performance: controlled experiments.
InProc. ACM SIGCOMM workshop on Home networks,
pages 7–12, 2010.
[10] M. Dischinger, A. Haeberlen, K. Gummadi, and S. Saroiu. Characterizing residential broadband networks. InProc.
Internet Measurement Conference, New York, New York,
USA, 2007.
[11] A. Elmokashfi, A. Kvalbein, J. Xiang, and K. Evensen. Characterizing delays in norwegian 3g networks. InProceedings of the 13th international conference on Passive and Active
Measurement, pages 136–146, 2012.
[12] J. Gettys. Bufferbloat: Dark Buffers in the Internet.Internet
Computing, IEEE, 15(3):96–96, 2011.
[13] Andrei Gurtov. Effect of Delays on TCP Performance. In
Emerging Personal Wireless Communications, volume 67,
pages 87–105. 2002.
[14] D. Han, A. Agarwala, D. Andersen, M. Kaminsky,
K. Papagiannaki, and S. Seshan. Mark-and-sweep: Getting the ”inside” scoop on neighborhood networks. InProc. Internet
Measurement Conference, pages 99–104, 2008.
[15] H. Inamura, G. Montenegro, R. Ludwig, A. Gurtov, and F. Khafizov. TCP over Second (2.5G) and Third (3G) Generation Wireless Networks. RFC 3481 (Best Current Practice), February 2003.
[16] H. Jiang, Y. Wang, K. Lee, and I. Rhee. Tackling bufferbloat in 3G/4G networks. InProc. ACM Internet Measurement
Conference, pages 329–342, 2012.
[17] M. Jurvansuu, J. Prokkola, M. Hanski, and P. Perala. Hsdpa performance in live networks. InIEEE International
Communications Conference, pages 467–471, 2007.
[18] B. Kim, I. Lee, and K. Chu. Application performance impact on scheduler in CDMA-1XRTT wireless system. InProc. IEEE
Vehicular Technology Conference, volume 5, pages 2770–2774,
2005.
[19] J. Korhonen, O. Aalto, A. Gurtov, and H Lamanen. Measured performance of gsm, hscsd and gprs. InIEEE International
Communications Conference, volume 5, pages 1330–1334,
2001.
[20] C. Kreibich, N. Weaver, B. Nechaev, and V. Paxson. Netalyzr: illuminating the edge network. InProc. ACM Internet
Measurement Conference, pages 246–259, 2010.
[21] Karthik Lakshminarayanan, Venkata N. Padmanabhan, and Jitendra Padhye. Bandwidth estimation in broadband access networks. InProceedings of the 4th ACM SIGCOMM
conference on Internet measurement, IMC ’04, pages 314–321,
New York, NY, USA, 2004. ACM.
[22] C. Mehlf¨uhrer, S. Caban, and M. Rupp. Measurement-Based Performance Evaluation of MIMO HSDPA.IEEE Transactions
on Vehicular Technology, 59(9):4354–4367, 2010.
[23] Telecom Regulatory Authority of India. The Indian Telecom Services Performance Indicators, December 2012.
[24] J. Prokkola, P.H.J. Perala, M. Hanski, and E. Piri. 3G/HSPA Performance in Live Networks from the End User Perspective.
InIEEE International Communications Conference, pages
1–6, 2009.
[25] P. Reichl and M. Umlauft. Project WISQY: a
measurement-based end-to-end application-level performance comparison of 2.5G and 3G networks. InWireless
Telecommunications Symposium, pages 9–14, 2005.
[26] P. Romirer-Maierhofer, F. Ricciato, A. D’Alconzo, R. Franzan, and W. Karner. Network-Wide Measurements of TCP RTT in 3G. InProc. International Workshop on Traffic Monitoring
and Analysis, pages 17–25, 2009.
[27] P. Stuckmann, N. Ehlers, and B. Wouters. GPRS traffic performance measurements. InProc. IEEE Vehicular
Technology Conference, volume 2, pages 1289–1293.
[28] S. Sundaresan, W. de Donato, N. Feamster, R. Teixeira, S. Crawford, and A. Pescap`e. Broadband Internet performance: a view from the gateway. InProceedings of the ACM
SIGCOMM 2011 conference, pages 134–145, 2011.
[29] W. Tan, F. Lam, and W. Lau. An Empirical Study on 3G Network Capacity and Performance. InIEEE INFOCOM, volume 7, pages 737–750, 2007.
[30] F. Vacirca, F. Ricciato, and R. Pilz. Large-scale RTT measurements from an operational UMTS/GPRS network. In
Proc. International Conference on Wireless Internet, pages
190–197, 2005.
[31] Z. Wang, Z. Qian, Q. Xu, Z. Mao, and M. Zhang. An untold story of middleboxes in cellular networks. InProc. ACM
SIGCOMM, pages 374–385, 2011.
[32] Q. Xu, J. Huang, Z. Wang, F. Qian, A. Gerber, and Z. Mao. Cellular data network infrastructure characterization and implication on mobile content placement. InProc. ACM