Falls classification using tri-axial accelerometers
during the five-times-sit-to-stand test.
Doheny, E. P., Walsh, C., Foran, T., Greene, B. R., Fan, C. W., Cunningham, C., & Kenny, R. A., Falls classification using tri-‐axial accelerometers during the five-‐times-‐sit-‐to-‐ stand test., Gait & Posture, 38, 4, 2013, 1021 -‐ 1025
Abstract
The five-‐times-‐sit-‐to-‐stand test (FTSS) is an established assessment of lower limb strength, balance dysfunction and falls risk. Clinically, the time taken to complete the task is recorded with longer times indicating increased falls risk. Quantifying the movement using tri-‐axial accelerometers may provide a more objective and potentially more accurate falls risk estimate. 39 older adults, 19 with a history of falls, performed four repetitions of the FTSS in their homes. A tri-‐axial accelerometer was attached to the lateral thigh and used to identify each sit–stand–sit phase and sit–stand and stand–sit transitions. A second tri-‐axial accelerometer, attached to the sternum, captured torso acceleration. The mean and variation of the root-‐mean-‐squared amplitude, jerk and spectral edge frequency of the acceleration during each section of the assessment were examined. The test–retest reliability of each feature was examined using intra-‐ class correlation analysis, ICC(2,k). A model was developed to classify
participants according to falls status. Only features with ICC > 0.7 were
considered during feature selection. Sequential forward feature selection within leave-‐one-‐out cross-‐validation resulted in a model including four reliable
accelerometer-‐derived features, providing 74.4% classification accuracy, 80.0% specificity and 68.7% sensitivity. An alternative model using FTSS time alone resulted in significantly reduced classification performance. Results suggest that the described methodology could provide a robust and accurate falls risk
assessment.
Keywords
• Accelerometer; • Logistic regression; • Falls risk assessment; • Postural transitions; • Classifier
1. Introduction
postural balance disorders [2], [3], [4] and [5] and cognitive function [6].
Additionally, it has been established that the time taken to complete the FTSS is an independent predictor of falls risk [7] and [8]. During the FTSS, participants must stand up from a chair, and sit down again, five times as quickly as possible. Typically, a clinician records the time taken to complete the task, with longer times indicating poorer performance.
Recent studies have examined the use of FTSS to identify balance disorders and those at higher risk of falling. Discriminant analysis using the FTSS time has been reported to identify 60% of participants over 60 years with balance dysfunction from those without, with an optimal cut-‐off of 14.2 s [3]. Additionally, FTSS times greater than 15 s were reported to indicate a 74% greater risk of recurrent falls [7]. The FTSS was also reported to provide more added value to a falls
assessment than the “Timed Up and Go” (TUG) test, and the “One-‐Leg-‐Balance” test, particularly when examining those at moderate risk of falls [9]. Consistently, FTSS time was reported to significantly discriminate subjects who experienced multiple falls during the 12 months following assessment from non-‐recurrent fallers, with excellent test–retest reliability [10]. However, there is a lack of consensus on the cut-‐off time for high falls risk. Additionally, this single measure of performance does not quantify postural sway or steadiness of movement and is susceptible to human error. Due to the complex nature of falls, a more
objective and comprehensive method to assess falls risk using the FTSS is required.
Accelerometry has been shown to be a valid tool to examine a single sit-‐to-‐stand movement in studies comparing it to a video-‐based system [11], [12] and [13] and a force platform [14]. Recently, a falls risk estimation model based on accelerometer data obtained during an unsupervised protocol which included a TUG test, an ‘alternative step test’, and an FTSS was presented [15]. Therein, a linear least squares approach was used to develop models based on
accelerometer-‐derived features of each assessment. 16 FTSS features were presented, of which the dissimilarity between sit-‐to-‐stand cycles was selected for inclusion in the reported falls risk model [15]. However, a method to quantify falls risk based on acceleration data captured during the FTSS alone has yet to be reported. Such a method would require little clinical time and space, and be particularly suitable for early detection of those at moderate risk of falls.
Accelerometry may provide an appropriate and useful method to assess falls risk using the FTSS, potentially with significant improvement in falls classification accuracy compared to FTSS time alone. In this study, logistic regression was used to develop a model to robustly classify falls status based on reliable
accelerometer-‐derived FTSS features.
This study was performed as part of a larger research project which examined diurnal variations in the outcome of various clinical assessments and their association with falls history [16] and [17].
2.1. Participants
39 community-‐dwelling older adults provided informed consent and participated in this study. Approval was obtained from the local Ethics
Committee. All participants had a detailed clinical assessment and falls history consistent with the AGS guidelines [18].
A fall was defined as an event which resulted in a person coming to rest on the lower level regardless of whether an injury was sustained, and not as a result of a major intrinsic event or overwhelming hazard [19]. 19 participants (7 male; age 74.89 ± 7.00 years, range 66–88 years; BMI: 26.62 ± 4.25, range 20.11– 37.85) were categorised ‘fallers’. Participants were considered ‘fallers’ if they experienced multiple falls, or one fall requiring medical attention, during the twelve months prior to assessment. Two participants were additionally
categorised as fallers due to an unexplained fall which caused a bone fracture or coincided with a blackout during the 5 years prior to assessment. 20 participants (9 male; age 68.35 ± 6.22 years, range 61–87 years; BMI: 27.74 ± 2.79, range 22.01–32.34) were considered ‘non-‐fallers’, as they did not fit these criteria. Univariate analysis of variance (ANOVA) was used to examine the difference between the age and BMI of fallers and non-‐fallers.
The FTSS was conducted in the home under supervision at four fixed times during a 10 h period – between 9.00 and 9.30 am, 1.00 and 1.30 pm, 3.30 and 4.00 pm and 6.00 and 6.30 pm [16]. Participants were asked to refrain from vigorous exercise the day before and the day of the experiment. Participants were advised to eat a light breakfast between 8.30 and 9.00 am, light lunch at 12.30 pm and light snack at 2.30 pm, and to refrain from consuming caffeinated drinks.
2.2. Data acquisition
Two tri-‐axial accelerometers (Shimmer Research, Dublin, Ireland) were used to quantify movement during the FTSS. One accelerometer was positioned over the participant's clothing on the lateral aspect of the right thigh, with one axis
assessments. A 46 cm high chair was used, and participants were asked to keep their arms folded across their chest, Fig. 1. Participants were then asked to fully stand up and sit back down five times as quickly as possible.
)
Fig. 1.
Illustration of experimental set-‐up of the FTSS, tri-‐axial accelerometers (TA) worn on sternum and right thigh. Sensor axes are indicated.
Tri-‐axial accelerometer data were synchronously acquired at 102.4 Hz in real-‐ time using BioMOBIUS (http://www.biomobius.org). Data were exported to text format. Post-‐processing and analysis were conducted using Matlab.
Accelerometer data were calibrated using a published procedure [20] and low-‐ pass filtered at 5 Hz using a 4th order Butterworth filter.
2.3. Feature extraction
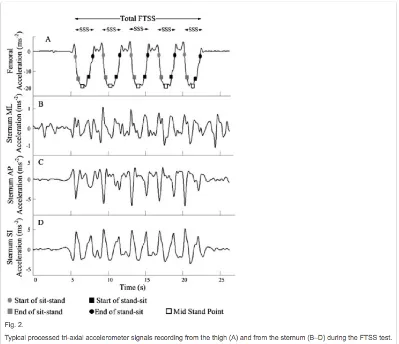
stand points, Fig. 2. Only mid-‐stand points with accelerations, AMS, less than 0.8Amin were deemed successful SSS attempts, ensuring that all successful SSS phases were detected. Recordings capturing exactly five mid-‐stand points were included in this analysis, 23 trials (14.4%) were thus excluded.
Fig. 2.
Typical processed tri-‐axial accelerometer signals recording from the thigh (A) and from the sternum (B–D) during the FTSS test. Mid-‐stand points, and the start and end of each sit–stand and stand–sit transition are indicated using the
femoral acceleration (A).
[image:5.595.99.498.258.602.2]
increased above 0.2AMS, this indicated the end of a stand–sit transition, Fig. 2. The total time to complete the FTSS was calculated, Fig. 2, along with the mean and coefficient of variation (CV) of the time for individual SSS phases, sit–stand and stand–sit transitions.
The accelerometer signal recorded at the sternum was used to examine ML, AP and SI movement of the torso during the assessment. The root-‐mean-‐squared (RMS) amplitude of the accelerometer signal (m/s2) was used as a measure of postural sway during each segment of the assessment. The steadiness of the movement in each direction was examined using the jerk of each portion of the test, calculated as the derivative of the acceleration with respect to time (m/s3). The mean and CV of the jerk in each direction was examined. Finally, the
frequency content of the power spectrum of the movement in each direction was examined using the spectral edge frequency (SEF) of the accelerometer data. SEF was defined as the frequency below which 95% of the power of the signal is contained.
A wide range of accelerometer-‐derived features were extracted. For the total FTSS, the time taken, RMS acceleration (ML, AP, SI), jerk (ML, AP, SI), and SEF (ML, AP, SI) were examined (10 features). For each test, the mean and coefficient of variance of each of these features were also examined for SSS phases, sit– stand transitions and stand–sit transitions (60 features), Fig. 2. This resulted in 70 accelerometer-‐derived features.
2.4. Model development
To ensure that reliable and repeatable features were included in the classifier model, the test–retest reliability of each feature was investigated using intra-‐ class correlation coefficients, ICC(2,k), over the four recording sessions. Only features with ICC > 0.7 were considered during feature selection [21]. The mean value of each reliable feature for each participant was used during feature selection.
A logistic regression model was developed to classify participants based on falls status, Model 1. Sequential forward feature selection within leave-‐one-‐out cross-‐ validation [22] was used to select the subset of the reliable accelerometer-‐ derived features which combine to best classify falls status. Using this method, features were sequentially added to the model until there was no improvement in cross-‐validated classifier performance.
classified to the total number of fallers. Specificity was defined as the ratio of the number of non-‐fallers correctly classified to the total number of non-‐fallers. Accuracy was defined as the ratio of the number of participants correctly classified to the total number of participants. ROC analysis was also conducted, with the area under the curve (AUC) used as an additional metric of classifier performance. Reported performance metrics relate to the mean values across all test samples for leave-‐one-‐out cross-‐validation for the final model.
An exploratory analysis was also conducted using univariate ANOVA to examine the ability of each selected feature of Model 1 to discriminate fallers from non-‐ fallers. No explicit correction for multiple testing was conducted; raw p-‐values are presented to allow the reader to interpret them directly [23].
For comparison, a second model was developed using total time alone (Model 2). The optimum cut-‐off time was identified using ROC analysis, and compared with the previously reported cut-‐off of 15 s [3]. To compare the performance of Model 1 and Model 2, unpaired t-‐tests were performed using the AUC at each test fold of cross-‐validation. Data were considered significantly different for p < 0.05.
3. Results
Fallers were significantly older than non-‐fallers, but there was no significant difference between groups in terms of BMI.
The test–retest reliability of all 70 accelerometer-‐derived features, as assessed using intra-‐class correlation, ICC(2,k), is presented in Table 1. 24 features were deemed insufficiently reliable (ICC ≤ 0.7) [21], and were not considered during the cross-‐validated feature selection routine for Model 1. Of the remaining 46 accelerometer-‐derived features, four features were selected within leave-‐one-‐ out cross-‐validation for inclusion in Model 1, Table 2. The mean value of each selected feature is presented for fallers and non-‐fallers, along with univariate ANOVA results representing the utility of individual features in discriminating between groups, are presented in Table 2. The coefficients of Model 1 are also presented. Further detail on model development is available on request.
Table 1.
Table 2.
feature to individually discriminate fallers from non-‐fallers are also presented. The coefficients of the logistic regression equation are also presented.
The mean classification accuracy of Model 1 was 74.4% compared to 59.0% for Model 2, Table 3. Model 1 provided an AUC of 0.71, significantly greater than Model 2 (AUC = 0.59). ROC analysis revealed that the classification results presented for Model 2 represent a cut-‐off time of 16.86 s. A cut-‐off time of 15 s [3] resulted in a reduced classification accuracy of 53.9% (specificity = 35.0%, sensitivity = 73.7%) for the present cohort.
Table 3.
Classification performance for all models. ROC AUC values are presented with lower, upper 95% confidence intervals in brackets. Results for all models
represent the mean value across all test folds of leave-‐one-‐out cross-‐validation. * indicate that AUC results significantly differ from Model 1.
4. Discussion
Driven by the complex challenge of falls in older adults, this study aimed to improve the falls classification accuracy of the five-‐times-‐sit-‐to-‐stand test. Previous studies have investigated the use of inertial sensors to classify falls status using tests such as TUG, however, the utility of accelerometers to enhance the FTSS has not been fully explored. While the reported falls classification accuracy is lower than previously reported for instrumented versions of the TUG [24] and [25] or the PPA [26], the FTSS is suitable for small spaces, requires little specialist equipment, and may be a more suitable test for early detection of those at moderate risk of falls. The cross-‐validated performance of the resulting
classifier model was significantly greater than the model developed using FTSS time alone. Accelerometers provide an inexpensive, easy to implement method of quantifying additional measures of timing and postural movement during the FTSS, providing a quantitative and reliable measure of falls risk, with improved accuracy compared with FTSS time alone.
The relatively small cohort size must be considered as a limitation of this study. To overcome this, feature selection was performed within leave-‐one-‐out cross-‐ validation to provide a robust and unbiased classifier model. Additionally, reliability analysis was performed to ensure that each candidate feature had sufficient test–retest reliability. The limitations of body-‐worn accelerometers must also be considered, such as the sensitivity to sensor placement, the influence of gravity and potential difficulties with data collection. These issues may be overcome with care in sensor placement and by using reliable software.
This study required repeated placement of the sensors throughout the day, with 46 of the examined accelerometer-‐derived features demonstrating sufficient reliability (ICC > 0.7) for consideration during the implemented feature selection routine. FTSS time yielded an ICC of 0.89, consistent with a previous study which reported ICC > 0.8 based on two FTSS tests conducted 2 weeks apart [10].
The implemented wrapper-‐based feature selection approach [22] has been used widely in the classification literature and recently in research using sensor-‐based movement analysis to classify falls risk [15], [25] and [27]. Cross-‐validation ensured that the resulting model could generalise beyond the examined cohort. This method focuses on extracting the combination of features, which best combine to classify participants based on falls status, while ensuring not to overfit the resulting model to the dataset. Two selected features describe the FTSS timing, total time and mean stand–sit time, one selected feature relates to variation in ML acceleration during stand–sit transitions, and the final selected feature relates to the frequency of AP movement during SSS phases.
complete the FTSS in identifying those at risk of falls [3], [7] and [9], with a time greater than 15 s suggested by Buatois et al. to indicate increased falls risk [7]. Fallers took longer to complete the FTSS than non-‐fallers, however this measure did not significantly discriminate fallers from non-‐fallers. Additionally, the
significant improvement in classification performance of Model 1 compared with Model 2 demonstrates the limitation of using total time in isolation to quantify risk of falling.
The optimal cut-‐off time for Model 2 was 16.86 s for this cohort. The previously suggested cut-‐off of 15 s [7] resulted in reduced classification performance for the present cohort. Model 2 was more specific (75% vs. 65%) but less sensitive (42% vs. 55%) compared to the results of Buatois et al. [7]. This may be due to differences in study design, Buatois et al. reported a longitudinal study and used FTSS time to predict recurrent fallers, whereas the current cross-‐sectional study classified participants based on retrospective falls status, including both single or recurrent falls [7]. Additionally, the smaller cohort examined in this study may be too small to replicate previous studies of 2735 participants [7]. However, these differing cut-‐offs are consistent with the lack of consensus in falls risk thresholds reported in the literature for the FTSS [9], emphasising the need for a new, more objective falls risk metric.
These results also highlight the stand–sit transition as a falls risk indicator, suggesting that the smoothness of the movement is as indicative of falls risk as its timing. While mean stand–sit time did not differ between fallers and non-‐ fallers (p = 0.71), its negative coefficient ( Table 2) suggests that slower stand–sit transitions may indicate reduced falls risk, potentially due to more controlled postural transitions in non-‐fallers, with fallers potentially more likely to sit down quickly with less control of their movement. However, overemphasis of
individual model coefficients should be avoided, the complete model should be considered instead. Previously, differences in several accelerometer-‐derived features of stand–sit and sit–stand transitions during a TUG test were reported between Parkinson's patients and healthy controls [28]. The ability to stand from a chair has also been identified as a falls risk factor in older adults [29], however the results of this study indicate that the stand–sit transition may also be an important falls risk factor.
results have been reported for postural steadiness during standing balance [30], with older participants exhibiting higher frequencies than younger participants.
The classifier model developed using statistically reliable accelerometer-‐derived features (Model 1) and the associated method may enhance the accuracy of the FTSS in assessing falls risk.
Acknowledgements
This research was completed as part of a wider programme of research within the TRIL Centre (Technology Research for Independent Living). The TRIL Centre is a multi-‐disciplinary research centre, bringing together researchers from UCD, TCD, NUIG and Intel, funded by Intel, GE and IDA Ireland.
http://www.trilcentre.org. The authors would also like to thank Marie Brøndum Bay and Agnese Caglio for providing illustrations.
Conflict of interest statement
Funding for this study and the body-‐worn sensors utilised were provided by Intel Corporation and the TRIL Centre.
References
M. Csuka, D.J. McCarty
Simple method for measurement of lower extremity muscle strength
American Journal of Medicine, 78 (1985), pp. 77–81
S.R. Lord, S.M. Murray, K. Chapman, B. Munro, A. Tiedemann
Sit-‐to-‐stand performance depends on sensation, speed, balance, and psychological status in addition to strength in older people
Journals of Gerontology. Series A: Biological Sciences and Medical Sciences, 57 (2002), pp. M539–M543
S.L. Whitney, D.M. Wrisley, G.F. Marchetti, M.A. Gee, M.S. Redfern, J.M. Furman
Clinical measurement of sit-‐to-‐stand performance in people with balance disorders: validity of data for the Five-‐Times-‐Sit-‐to-‐Stand Test
Physical Therapy, 85 (2005), pp. 1034–1045
M.M. Lusardi, G.L. Pellecchia, M. Schulman
Functional performance in community living older adults
Journal of Geriatric Physical Therapy, 26 (14) (2003), p. 22
J.M. Guralnik, E.M. Simonsick, L. Ferrucci, R.J. Glynn, L.F. Berkman, D.G. Blazer, et al.
A short physical performance battery assessing lower-‐extremity function – association with self-‐reported disability and prediction of mortality and nursing-‐ home admission
Journals of Gerontology, 49 (1994), pp. M85–M94
C. Annweiler, A.M. Schott, G. Abellan van Kan, Y. Rolland, H. Blain, B. Fantino, et al.
The Five-‐Times-‐Sit-‐to-‐Stand test, a marker of global cognitive functioning among community-‐dwelling older women
The Journal of Nutrition, Health & Aging, 15 (2011), pp. 271–276
S. Buatois, D. Miljkovic, P. Manckoundia, R. Gueguen, P. Miget, G. Vançon, et al.
Five times sit to stand test is a predictor of recurrent falls in healthy community-‐ living subjects aged 65 and older
B. Najafi, K. Aminian, F. Loew, Y. Blanc, P.A. Robert
Measurement of stand–sit and sit–stand transitions using a miniature gyroscope and its application in fall risk evaluation in the elderly
IEEE Transactions on Biomedical Engineering, 49 (2002), pp. 843–851
S. Buatois, C. Perret-‐Guillaume, R. Gueguen, P. Miget, G. Vançon, P. Perrin, et al.
A simple clinical scale to stratify risk of recurrent falls in community-‐dwelling adults aged 65 years and older
Physical Therapy, 90 (2010), pp. 550–560
A. Tiedemann, H. Shimada, C. Sherrington, S. Murray, S. Lord
The comparative ability of eight functional mobility tests for predicting falls in community-‐dwelling older people
Age and Ageing, 37 (2008), pp. 430–435
W.G. Janssen, J.B. Bussmann, H.L. Horemans, H.J. Stam
Validity of accelerometry in assessing the duration of the sit-‐to-‐stand movement
Medical and Biological Engineering and Computing, 46 (2008), pp. 879–887
W.G. Janssen, J.B. Bussmann, H.L. Horemans, H.J. Stam
Analysis and decomposition of accelerometric signals of trunk and thigh obtained during the sit-‐to-‐stand movement
Medical and Biological Engineering and Computing, 43 (2005), pp. 265–272
M.C. Boonstra, R.M. van der Slikke, N.L. Keijsers, R.C. van Lummel, M.C. de Waal Malefijt, N. Verdonschot
The accuracy of measuring the kinematics of rising from a chair with accelerometers and gyroscopes
Journal of Biomechanics, 39 (2006), pp. 354–358
W.G. Janssen, D.G. Kulcu, H.L. Horemans, H.J. Stam, J.B. Bussmann
Sensitivity of accelerometry to assess balance control during sit-‐to-‐stand movement
IEEE Transactions on Neural Systems and Rehabilitation Engineering, 16 (2008), pp. 479–484
M.R. Narayanan, S.J. Redmond, M.E. Scalzi, S.R. Lord, B.G. Celler, N.H. Lovell Ast
IEEE Transactions on Biomedical Engineering, 57 (2010), pp. 534–541
E.P. Doheny, C.W. Fan, T. Foran, B.R. Greene, C. Cunningham, R.A. Kenny
An instrumented sit-‐to-‐stand test used to examine differences between older fallers and non-‐fallers
Conference Proceedings: IEEE Engineering in Medicine and Biology Society, 2011 (2011), pp. 3063–3066
E.P. Doheny, B.R. Greene, T. Foran, C. Cunningham, C.W. Fan, R.A. Kenny
Diurnal variations in the outcomes of instrumented gait and quiet standing balance assessments and their association with falls history
Physiological Measurement, 33 (2012), pp. 361–373
Summary of the Updated American Geriatrics Society/British Geriatrics Society clinical practice guideline for prevention of falls in older persons
Journal of the American Geriatrics Society, 59 (2011), pp. 148–157
M.E. Tinetti, M. Speechley, S.F. Ginter
Risk factors for falls among elderly persons living in the community
The New England Journal of Medicine, 319 (1988), pp. 1701–1707
F. Ferraris, U. Grimaldi, M. Parvis
Procedure for effortless in-‐field calibration of three-‐axis rate gyros and accelerometers
Sensors and Materials, 7 (1995), pp. 311–330
P.E. Shrout, J.L. Fleiss
Intraclass correlations: uses in assessing rater reliability
Psychological Bulletin, 86 (1979), pp. 420–428
R. Kohavi, G.H. John
Wrappers for feature subset selection
Artificial Intelligence, 97 (1997), pp. 273–324
J.A. Sterne, G. Davey Smith
Sifting the evidence – what's wrong with significance tests?
British Medical Journal, 322 (2001), pp. 226–231
Evaluation of falls risk in community-‐dwelling older adults using body-‐worn sensors
Gerontology, 58 (2012), pp. 472–480
B.R. Greene, A. O’Donovan, R. Romero-‐Ortuno, L. Cogan, C. Ni Scanaill, R.A. Kenny
Quantitative falls risk assessment using the timed up and go test
IEEE Transactions on Biomedical Engineering, 57 (2010), pp. 2918–2926
M.R. Narayanan, S.J. Redmond, M.E. Scalzi, S.R. Lord, B.G. Celler, N.H. Lovell
Longitudinal falls-‐risk estimation using triaxial accelerometry
IEEE Transactions on Biomedical Engineering, 57 (2010), pp. 534–541
M. Marschollek, A. Rehwald, K.H. Wolf, M. Gietzelt, G. Nemitz, H. Meyer Zu Schwabedissen, et al.
Sensor-‐based fall risk assessment – an expert ‘to go’
Methods of Information in Medicine, 50 (2011), pp. 420–426
A. Weiss, T. Herman, M. Plotnik, M. Brozgol, I. Maidan, N. Giladi, et al.
Can an accelerometer enhance the utility of the Timed Up & Go Test when evaluating patients with Parkinson's disease?
Medical Engineering and Physics, 32 (2010), pp. 119–125
M.C. Nevitt, S.R. Cummings, S. Kidd, D. Black
Risk factors for recurrent nonsyncopal falls. A prospective study
JAMA: The Journal of the American Medical Association, 261 (1989), pp. 2663– 2668
T.E. Prieto, J.B. Myklebust, R.G. Hoffmann, E.G. Lovett, B.M. Myklebust
Measures of postural steadiness: differences between healthy young and elderly adults
IEEE Transactions on Biomedical Engineering, 43 (1996), pp. 956–966