TarO: a target optimisation system for structural
biology
Ian M. Overton
1, C. A. Johannes van Niekerk
1, Lester G. Carter
2, Alice Dawson
1,
David M. A. Martin
1, Scott Cameron
1, Stephen A. McMahon
2, Malcolm F. White
2,
William N. Hunter
1, James H. Naismith
2and Geoffrey J. Barton
1,*
1
School of Life Sciences Research, University of Dundee, Dow Street, Dundee, DD1 5EH and2Centre for Biomolecular Sciences, School of Biomedical Science, North Haugh, The University, St Andrews, KY16 9ST, UK
Received January 31, 2008; Revised March 13, 2008; Accepted March 16, 2008
ABSTRACT
TarO (http://www.compbio.dundee.ac.uk/taro) offers a single point of reference for key bioinformatics analyses relevant to selecting proteins or domains for study by structural biology techniques. The protein sequence is analysed by 17 algorithms
and compared to 8 databases. TarO gathers
putative homologues, including orthologues, and then obtains predictions of properties for these sequences including crystallisation propensity, pro-tein disorder and post-translational modifications. Analyses are run on a high-performance computing cluster, the results integrated, stored in a database and accessed through a web-based user interface. Output is in tabulated format and in the form of an annotated multiple sequence alignment (MSA) that may be edited interactively in the program Jalview. TarO also simplifies the gathering of additional annotations via the Distributed Annotation System, both from the MSA in Jalview and through links to Dasty2. Routes to other information gateways are included, for example to relevant pages from UniProt, COG and the Conserved Domains Database. Open access to TarO is available from a guest account with private accounts for academic use available on request. Future development of TarO will include further analysis steps and integration with the Protein Information Management System (PIMS), a sister project in the BBSRC ‘Structural Proteomics of Rational Targets’ initiative
INTRODUCTION
Target selection for structural biology encompasses a variety of analyses, and may include optimisation of the protein target for successful progress in the structure
determination pipeline. The evaluation of putative homol-ogues and/or alternative constructs is a key aspect of the optimisation process (1,2). One useful metric that may be applied to this end is estimated crystallisation propensity (3,4). This approach aims to increase the odds of success in the face of attrition rates that typically exceed 90% in structural genomics consortia (5–7). However, target optimisation is also commonplace as a salvage strategy following difficulties with the originally selected protein.
Numerous bioinformatics analyses can be applied during target optimisation, including searching various databases (8–11) and sequence-based prediction of protein properties, such as protein disorder (1). However, the generation, integration and management of results from these analyses are not trivial (1,12). There are many publicly available servers that run individual bioinfor-matics analysis steps. Websites are also available to provide a single point of access to individual analysis tools, for example Expasy (13), Entrez (14) and OPAL (12). However, target optimisation using these sites is laborious and there is little facility to integrate the results of numerous analyses across many sequences. A greater level of integration over a user-supplied multiple sequence alignment (MSA) is provided by MACSIMS (15), which also propagates annotations by homology inference. However, MACSIMS is not focused on target optimisation and does not generate any ranking of sequences. Also, MACSIMS returns a limited set of annotation types and only annotation that is amenable to display on a MSA is given in a user-friendly format. Servers that focus on target selection are available, such as SGTarget (16), and the more recent XtalPred (17). These provide some integration of data for the user, but are limited in terms of the number of annotation types and the server features. Neither SGTarget nor XtalPred provide an annotated MSA.
We have developed a system (TarO) that offers a single point of reference for key target optimisation analyses. TarO features include gathering and annotation of
*To whom correspondence should be addressed. Tel: +44 1382 385860; Fax: +44 1382 385764; Email: [email protected]
ß2008 The Author(s)
This is an Open Access article distributed under the terms of the Creative Commons Attribution Non-Commercial License (http://creativecommons.org/licenses/ by-nc/2.0/uk/) which permits unrestricted non-commercial use, distribution, and reproduction in any medium, provided the original work is properly cited.
at St Andrews University Library on June 4, 2010
http://nar.oxfordjournals.org
putative orthologues and homologues, searching the protein input against the Protein DataBank (18) with PSIBLAST (19), generation of annotated MSA, and presentation of integrated results to the user. TarO was originally developed for the Scottish Structural Proteomics Facility (SSPF) (www.sspf.ac.uk), and plays a key role in the SSPF bioinformatics platform. To date, TarO has processed more than 720 queries and is used by several different research groups outside the SSPF.
METHODS
Overview of TarO
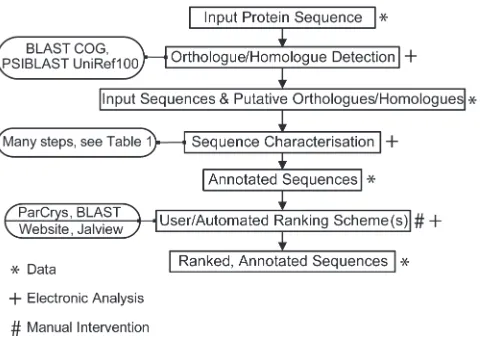
TarO takes a protein sequence as input, which is used to search for putative orthologues and homologues. The input and associated sequences are analysed in a number of annotation steps, and the results stored in a database. The TarO website (www.compbio.dundee.ac.uk/taro) provides access to results, and integrates the Jalview (20,21) program to visualise complex annotation over a MSA. All analyses are run on a local computer cluster. Figure 1 gives a summary of the processes involved in TarO.
Detection and annotation of functionally related sequences
Detection of functionally and structurally similar proteins helps in the selection of sequences that are more amenable to structural studies. Orthologues frequently share substantial functional similarity, and this assumption may be cautiously extended to all homologues (22,23). Part of the assessment of functional relationships involves examination of the patterns of annotation and conserved residues, or ‘functional signatures’, on the sequences.
This process is assisted by an annotated MSA constructed from the input sequence and the putative orthologues/ homologues. The annotated MSA is displayed in Jalview (20,21). Scores from BLAST (19) sequence alignments also provide a rough metric for estimating functional similarity in TarO.
TarO detects putative orthologues by searching the input sequence against COG/KOG (11) with BLASTP (19). Matches for both the orthologue and homologue searches are defined from thresholds selected to infer protein structural similarity (24). In addition, all matches must have BLAST expectation values of 10 3 or better. The top-scoring COG/KOG match forms the basis to infer a COG/KOG orthologue cluster; all sequences in the relevant orthologue cluster are thus assigned as putative orthologues of the input protein. Subsequently, the input sequence as well as any putative orthologues are searched against the UniRef100 (8) database with PSIBLAST (three iterations, default values) (19).
[image:2.612.61.301.70.240.2]The input sequence and any putative orthologues/ homologues found are searched against the Protein DataBank (PDB) (18) with PSIBLAST and BLASTP, respectively. The input and associated sequences are also searched against TargetDB (25) with BLASTP, thereby highlighting any similar targets that have been registered by Structural Genomics consortia. The searches of TargetDB and the PDB both use the thresholds for structural similarity (24) and expectation value as described above. RPSBLAST (19) is also used to search all query-associated sequences against the Conserved Domains Database (CDD) (26,27), which includes profiles from Pfam (9,10), SMART (28,29) and COG/KOG (11). RPSBLAST matches to domain profiles are defined by an expectation value threshold of 10 3. Elementary chemical properties [e.g. average GES hydrophobicity (30)] are calculated with custom perl code, Bioperl (31) and PEPSTATS (32). Sequences are assigned to phylogenetic classifications in order to allow for SignalP (33) prediction of signal peptide (default parameters). This classification is based on the data provided by COG/KOG and UniRef100. Where phylogenetic classification is not available, SignalP is run using all of the possible classi-fications. Only the first 70 amino acids of each sequence are taken as input to SignalP in order to reduce false positives. Additionally, predictions for the input and all associated sequences are obtained for NetOglyc (34), NetPhos (35), RONN (36), Disembl (37), Globplot (38), Jpred (39,40) and NetNglyc (http://www.cbs.dtu.dk/ services/NetNGlyc/), with the default settings for each algorithm. It is important to note that NetNglyc and NetOglyc glycosylation predictions should be treated with caution when a signal peptide is not also predicted (34) http://www.cbs.dtu.dk/services/NetNGlyc/. TarO gives a warning when displaying the list of predicted glycosylation sites for a sequence without a predicted signal peptide. The MSA is generated from the input and associated sequences by running MUSCLE (41). Reliably generating a MSA from automatically obtained search results can be difficult, so sequences are only included in the MSA if their BLAST alignment to the input sequence has an expectation value 10 20, and if their sequence length
Figure 1. Overview of TarO Processes. Given a protein sequence, TarO searches the COG database (11) to identify putative orthologues. Any matched COG sequences and the input sequence are then searched against UniRef100 (8) to identify putative homologues. The input, COG and UniRef100 sequences are then subject to a number of annotation steps (detailed in Table 1). The annotated sequences are electronically ranked according to crystallisation propensity score (4) and BLAST (19) expectation value. The TarO website, which incorporates the Jalview (20,21) program, facilitates human interpreta-tion of the data. The final ranking is therefore semi-automated, combining electronic and human interpretation of the data.
at St Andrews University Library on June 4, 2010
http://nar.oxfordjournals.org
is no more than 125% of the input sequence length. Also, sequences are chosen for inclusion into the MSA according to the order of priority: input>putative orthologues>putative homologues. This order is fol-lowed until the user-specified maximum number of sequences is reached (default 100), or until all of the query-associated sequences have been examined. We plan further development of the strategy for generating the MSA which will be incorporated into later releases of TarO.
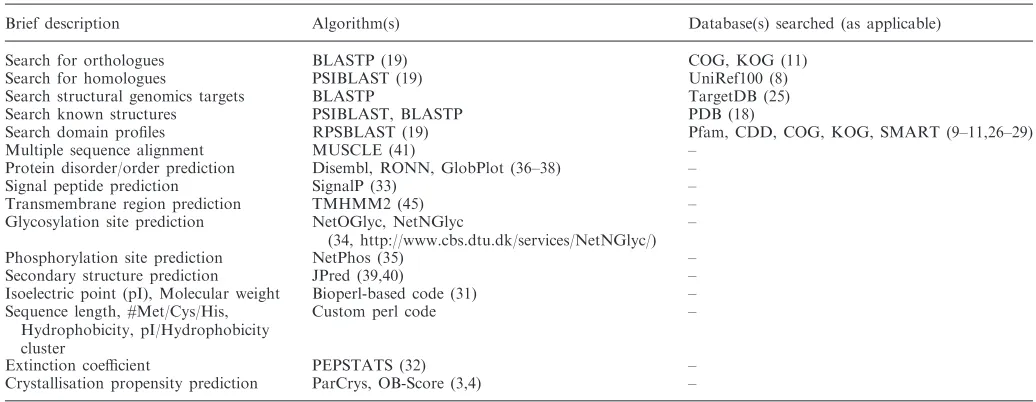
TarO also annotates the input and associated sequences with information that is useful through the course of ‘wet-lab’ stages in the structure determination pipeline. The predicted extinction coefficient at 280 nm is calculated by PEPSTATS (32), to assist with protein purification. Counts of the amino acids histidine, cysteine and methionine are given, which may be relevant for protein purification and deriving phases by anomalous scattering approaches. Other information in this category includes molecular weight, sequence length, hydrophobicity and isoelectric point. Table 1 summarises the various algo-rithms and databases currently employed in TarO.
The TarO database and external database update management
The results of the various analyses run by TarO, including searches of external databases, are parsed with custom perl code and stored in a relational database. The TarO web server queries this database when presenting results to the user. External databases (Table 1) are stored as flat files and searched locally on a high-performance compute cluster as part of the process of running a TarO query. These external databases are updated on a weekly basis with custom scripts based around the ‘wget’ Unix command. As a consequence, the information gathered by TarO is no more than one week old at the time of running a given query. Results associated with a TarO query reflect the information available at the time that the search was performed. The TargetDB database
‘target status’ information is a special case in this regard, because it is regularly updated into the TarO database. Therefore, the TargetDB ‘target status’ dis-played in TarO is updated every week for any matched TargetDB sequence, regardless of the date and time at which the TarO query was run. However, all matches between TarO and TargetDB sequences are identified from a search of the TargetDB database available at the time that the TarO query is run. Regular searches of completed TarO queries are not run against any database, partly because a TarO query is not necessarily an active target. However, the option of periodically searching certain databases (e.g. TargetDB, PDB) may be incorpo-rated in a future release.
USAGE
Submitting a TarO query
[image:3.612.40.558.84.285.2]Open access to TarO is available for any user, via a ‘Guest’ area that can be easily accessed from a link on the TarO home page. The ‘New Query’ link in the ‘Guest’ area navigates to a form that will accept TarO queries in ‘FASTA’ format. Queries can be uploaded to the server as a file or pasted into a textbox. There is an input option to specify the maximum number of sequences to include in the MSA (default value is 100). There is also a ‘functional description’ textbox which allows users to more easily identify their submitted queries. Some algorithms do not accept non-standard amino acid characters, and so these are removed from the query sequence input when appropriate. Queries submitted by the ‘Guest’ user are visible to anyone and deleted from the server after a minimum of 8 days. However, free private accounts are available for academic use; see the TarO website (www.compbio.dundee.ac.uk/taro) for further details. We ask that users wait for the results of a submitted query before making a further submission to the server. We estimate that an ‘average’ query will require approxi-mately 100 cpu hours, though these are spread over
Table 1. Summary of algorithms and databases included in TarO
Brief description Algorithm(s) Database(s) searched (as applicable)
Search for orthologues BLASTP (19) COG, KOG (11)
Search for homologues PSIBLAST (19) UniRef100 (8)
Search structural genomics targets BLASTP TargetDB (25)
Search known structures PSIBLAST, BLASTP PDB (18)
Search domain profiles RPSBLAST (19) Pfam, CDD, COG, KOG, SMART (9–11,26–29)
Multiple sequence alignment MUSCLE (41) –
Protein disorder/order prediction Disembl, RONN, GlobPlot (36–38) –
Signal peptide prediction SignalP (33) –
Transmembrane region prediction TMHMM2 (45) –
Glycosylation site prediction NetOGlyc, NetNGlyc
(34, http://www.cbs.dtu.dk/services/NetNGlyc/) –
Phosphorylation site prediction NetPhos (35) –
Secondary structure prediction JPred (39,40) –
Isoelectric point (pI), Molecular weight Bioperl-based code (31) – Sequence length, #Met/Cys/His,
Hydrophobicity, pI/Hydrophobicity cluster
Custom perl code –
Extinction coefficient PEPSTATS (32) –
Crystallisation propensity prediction ParCrys, OB-Score (3,4) –
at St Andrews University Library on June 4, 2010
http://nar.oxfordjournals.org
a compute cluster. Given a typical load on the cluster, throughput is in excess of 70 queries per week and a typical query is completed within 4–12 hr.
Tracking query progress and access to results
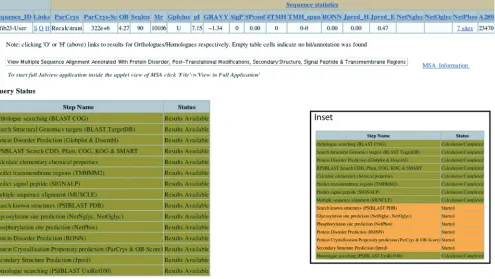
Figure 2 shows an example of the query sequence information page, which serves as a hub for each TarO query. Tabulated annotation details for the input sequence are available from this page. Several links are also provided, to allow display of the annotated MSA, access to pages describing putative orthologues/homologues, access to more details for matches to external databases [e.g. TargetDB (25)], and access to gateways such as UniProt (8), Dasty2 (42), COG (11) and CDD (26,27). The query status table on this page summarises the various steps in the annotation process and provides progress information for each annotation step. Each row in the query status table changes colour according to a ‘traffic lights’ system, to reflect progress of the correspond-ing annotation step. The pages for putative orthologues and homologues provide tabulated annotation details and related links, ranked according to ParCrys (4) crystallisation propensity scores. The ranking scheme
also incorporates the estimated similarity of the ortholo-gue/homologue to the input protein sequence, currently based on BLAST expectation values. All TarO pages provide user guidance as context-sensitive help upon mouse over, and further information is provided via links to a help page. The help page also provides an introduction to the TarO system and is accessed from http://www.compbio.dundee.ac.uk/taro/TarO_help.html.
DISCUSSION
[image:4.612.69.564.76.355.2]Structural biology projects are highly variable and so there is not a universally applicable target optimisation strategy. However, certain criteria are generally useful. Target opti-misation frequently draws upon overlapping information for the evaluation of both alternative constructs and putative homologues. Although NMR is an important technique for structure determination, as of January 2008 85% of all structures in the PDB (18) had been solved by X-ray crystallography. As a consequence, obtaining cry-stals is a key stage in most structural biology pipelines. Modifying the construct sequence may influence crystal-lisation propensity, and alternative homologues may be
Figure 2.Query sequence information page. This page serves as a hub for each TarO query. The table at the top has 47 columns and so extends to about three times the width of the figure. This table includes basic sequence statistics, as well as details of the top-scoring match from COG/KOG (11), the PDB (18), TargetDB (25) and UniRef100 (8). Several links are available within in this table, notably to display ranked annotations for putative orthologues and homologues of the input sequence, respectively displayed as the characters ‘O’ and ‘H’. There are also links to relevant pages of the COG/KOG, Dasty2 (42), CDD (26,27) and UniProt (8) websites, as well as links to results of RPSBLAST (19) searches of domain profiles. Clicking on the grey rectangle below this table displays the annotated MSA in the Jalview (20,21) applet (Figure 3). The ‘Query Status’ table allows tracking of the query progress through the various annotation stages, according to a ‘traffic lights’ system. Stages that have started are shown in Amber, Red is used to indicate a failed step, and completed analyses are shown in Green. Inset shows an example ‘Query Status’ table for a query that is in progress. There is extensive context-sensitive help throughout TarO, and the table headings also provide links to the relevant section of the help document. An example query sequence information page is given at http://www.compbio.dundee.ac.uk/taro/cgi-taro/ targpipe_display_query_seqs.pl?query=657&funcdesc=Test_Guest1.
at St Andrews University Library on June 4, 2010
http://nar.oxfordjournals.org
examined since protein families commonly have members with a wide range of estimated crystallisation propensity (3). The OB-Score (3), ParCrys (4) and Hydrophobicity/pI clustering (43) are all harnessed by TarO to estimate crystallisation propensity, and so guide the evaluation of homologues. Proteins with transmembrane regions or significant disordered sequence are frequently problematic (1,17). Also, posttranslational modifications (PTMs) are commonly associated with protein disorder (44). TarO assists with identification of sequences that are likely to contain these potentially troublesome, but biologically interesting, features. Transmembrane regions are pre-dicted by TMHMM2 (45), whilst protein disorder predic-tions are obtained from Disembl, GlobPlot and RONN (36–38). Phosphorylation sites, as well as O-linked and N-linked glycosylation are, respectively, predicted by the programs NetPhos (35) NetOglyc (34) and NetNglyc (http://www.cbs.dtu.dk/services/NetNGlyc/).
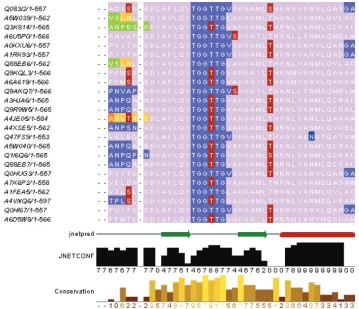
[image:5.612.120.479.71.380.2]TarO also assists with the identification of protein domain boundaries, facilitated by an annotated MSA that is viewed in Jalview (20,21). The MSA annotations include matched domains from Pfam (9,10) and the conserved domains database (CDD) (26,27), combined with pre-dicted protein disorder. Prepre-dicted transmembrane regions, signal peptide [SignalP (33)], PTMs and secondary struc-ture [JPred (39,40)] are also annotated on the MSA. Other useful information associated with the MSA is provided by the Jalview program. For example, Jalview automati-cally provides a display of residue conservation at each position of the alignment. In addition, Jalview provides the facility to query numerous Distributed Annotation System (46) servers, and to display any returned annota-tion on the MSA. The various annotaannota-tions associated with the MSA are useful to assist with the design of optimised constructs and identification of functionally important residues. Building upon this, a likely future development
Figure 3. Visualisation of complex annotation. An annotated MSA is shown, viewed in Jalview (20,21). Sequence identifiers are listed along the left-hand side of the alignment. The different colours on the aligned sequences correspond to different annotation types; for example, lilac corresponds to the overlap of matched Pfam (9,10) and CDD (26,27) domains. Predicted GlobPlot (38) disorder is shown in slate blue; light and dark orange show DISEMBL (37) ‘Hotloops’ and the overlap of DISEMBL ‘Hotloops’/‘REM465’ disorder, respectively. Green shows the overlap of Gloplot and Disembl ‘Hotloops’ disorder. The predicted post-translational modifications (PTMs), phosphorylation (NetPhos (35)) and N-linked glycosylation (NetNglyc http://www.cbs.dtu.dk/services/NetNGlyc/) are respectively shown in red and blue. Jpred (39,40) predicted secondary structure for the input sequence is shown on the line entitled ‘jnetpred’ that runs towards the bottom of the figure. Related annotations are grouped and may be selectively displayed in order to enable visualisation and interpretation of the information. The TarO annotation groupings are viewed inside the Jalview ‘Sequence Features’ box. For example, DISEMBL and GlobPlot disorder are grouped together, whilst the Pfam/CDD domains and RONN (36) disorder are in a separate group. There is also a group for protein disorder predicted by DISEMBL and RONN. From the ‘Sequence Features’ box, the user can change the display of the various groups in order to customise the presence or absence of annotations on the MSA. The order of annotations displayed is also specified within the ‘Sequence Features’ box. For example the annotation layer for PTMs is displayed over the other annotations in this figure. Therefore the slate blue GlobPlot disorder annotation on the sequence region ‘TGGTTG’ is displayed underneath the red predicted phosphorylation site annotation on the second threonine residue of the ‘TGGTTG’ sequence. The row at the bottom of the figure shows the alignment conservation and is automatically calculated by Jalview.
at St Andrews University Library on June 4, 2010
http://nar.oxfordjournals.org
in TarO is the automated design and ranking of optimised construct sequences. Of course, the design of optimised construct sequences may also benefit from information provided by experimental methods such as limited proteolysis (47).
Retaining the functional features that originally stimu-lated interest in the target is an important consideration during target optimisation. For example, removing part of an enzyme’s active site might make crystals easier to obtain; although the resultant protein structure would be relatively ineffective for studies of the molecular mecha-nism of catalysis! The range of functional information provided by TarO aims to assist with identification and comparison of functional regions in protein sequences. A possible future direction is the automated evaluation of sequence features to provide more sophisticated prediction and analysis of the functional conservation for a given protein pair. These predictions could be useful in the context of target optimisation, for example by enabling more advanced protein ranking systems. Different projects have different sets of functional proper-ties that are required to be retained in the optimised target sequence. However, all putative orthologues and homo-logues currently identified in TarO pass thresholds that aim to preserve a reasonable level of structural similarity (24).
As a screening mechanism to avoid duplication of effort, the protein input and associated sequences are searched against the PDB (18) and TargetDB (25). The discovery of a similar structure in the PDB or TargetDB may be sufficient grounds to eliminate a potential target. On the other hand, identification of a known and related structure could be important; this may provide a model for molecular replacement calculations, or inform on components of multi-domain or multi-subunit systems.
In summary, TarO enables selection of sequences that are likely to be more amenable to structural studies and share functional similarity with the input sequence. Additionally, TarO provides information relevant for many of the structure determination pipeline stages, including design of optimised constructs. The use of TarO accelerates progress in structural proteomics by efficiently providing bioinformatics data to inform deci-sion-making on the prioritisation and optimisation of potential targets. TarO simplifies the gathering, storage and retrieval of data and so frees up research time to make use of the information and to think creatively. Please cite TarO as well as the underlying algorithms and databases, as appropriate. Active development of TarO is continuing to include further analysis steps, improvements to the user interface, and integration with the Protein Information Management System (PIMS) a sister project in the BBSRC Structural Proteomics of Rational Targets (SPoRT) initiative. We also plan to make available a distribution of the TarO source code. We feel that community interactions with the TarO project can lead to further advancement and dissemination of best prac-tices for target optimisation. Access to TarO is from www.compbio.dundee.ac.uk/taro and we are grateful to receive feedback from users.
ACKNOWLEDGEMENTS
Thanks to Drs T. Walsh and C. Cole for computational advice. This work was funded by the UK Biotechnology and Biological Sciences Research Council (BBSRC) Structural Proteomics of Rational Targets (SPoRT) initiative, (Grant BBS/B/14434). Funding to pay the Open Access publication charges for this article was provided by BBSRC.
Conflict of interest statement. None declared.
REFERENCES
1. Rodrigues,A. and Hubbard,R.E. (2003) Making decisions for structural genomics.Brief Bioinform,4, 150–167.
2. Brenner,S.E. (2000) Target selection for structural genomics. Nat. Struct. Biol.,7, 967–969.
3. Overton,I.M. and Barton,G.J. (2006) A normalised scale for structural genomics target ranking: The OB-Score.FEBS Letters,
580, 4005–4009.
4. Overton,I.M., Padovani,G., Girolami,M. and Barton,G.J. (2008) ParCrys: a Parzen window density estimation approach to protein crystallisation propensity prediction.Bioinformatics,24, 901–907. 5. Service,R. (2002) Tapping DNA for structures produces a trickle.
Science,298, 948–950.
6. Terwillinger,T.C. (2000) Structural genomics in North America. Nat. Struct. Biol.,7, 935–939.
7. Service,R. (2005) Structural Genomics, Round 2.Science,
307, 1554–1558.
8. Apweiler,R., Bairoch,A., Wu,C.H., Barker,W.C., Boeckmann,B., Ferro,S., Gasteiger,E., Huang,H., Lopez,R.et al. (2004) UniProt: the universal protein knowledgebase. Nucleic Acids Research,
32, D115–D119.
9. Sonnhammer,E.L., Eddy,S.R., Birney,E., Bateman,A. and Durbin,R. (1998) Pfam: multiple sequence alignments and HMM-profiles of protein domains. Nucl. Acids Res.,26, 320–322. 10. Finn,R.D., Mistry,J., Schuster-Bockler,B., Griffiths-Jones,S.,
Hollich,V., Lassmann,T., Moxon,S., Marshall,M., Khanna,A.et al. (2006) Pfam: clans, web tools and services. Nucl. Acids Res.,
34, D247–D251.
11. Tatusov,R.L., Galperin,M.Y., Natale,D.A. and Koonin,E.V. (2000) The COG database: a tool for genome-scale analysis of protein functions and evolution. Nucl. Acids Res., 28, 33–36.
12. Albeck,S., Alzari,P., Andreini,C., Banci,L., Berry,I.M., Bertini,I., Cambillau,C., Canard,B., Carter,L.et al. (2006) SPINE bioinformatics and data-management aspects of
high-throughput structural biology.Acta Crystallographica Section D,62, 1184–1195.
13. Gasteiger,E., Gattiker,A., Hoogland,C., Ivanyi,I., Appel,R.D. and Bairoch,A. (2003) ExPASy: the proteomics server for in-depth protein knowledge and analysis.Nucl. Acids Res.,31, 3784–3788. 14. Wheeler,D.L., Church,D.M., Lash,A.E., Leipe,D.D., Madden,T.L.,
Pontius,J.U., Schuler,G.D., Schriml,L.M., Tatusova,T.A.et al. (2002) Database resources of the National Center for Biotechnology Information: 2002 update.Nucl. Acids Res.,30, 13–16.
15. Thompson,J., Muller,A., Waterhouse,A., Procter,J., Barton,G., Plewniak,F. and Poch,O. (2006) MACSIMS: multiple alignment of complete sequences information management system.BMC Bioinformatics,7, 318.
16. Rodrigues,A.P.C., Grant,B.J. and Hubbard,R.E. (2006) sgTarget: a target selection resource for structural genomics.Nucl. Acids Res.,
34, W225–W230.
17. Slabinski,L., Jaroszewski,L., Rychlewski,L., Wilson,I.A., Lesley,S.A. and Godzik,A. (2007) XtalPred: a web server for prediction of protein crystallizability.Bioinformatics,23, 3403–3405. 18. Berman,H., Henrick,K., Nakamura,H. and Markley,J.L. (2007)
The worldwide Protein Data Bank (wwPDB): ensuring a single, uniform archive of PDB data.Nucl. Acids Res.,35, D301–D303. 19. Altschul,S.F., Madden,T.L., Schaffer,A.A., Zhang,J., Zhang,Z.,
Miller,W. and Lipman,D.J. (1997) Gapped BLAST and
at St Andrews University Library on June 4, 2010
http://nar.oxfordjournals.org
PSI-BLAST: a new generation of protein database search programs. Nucl. Acids Res.,25, 3389–3402.
20. Clamp,M., Cuff,J., Searle,S.M. and Barton,G.J. (2004) The Jalview Java alignment editor.Bioinformatics,20, 426–427.
21. Waterhouse,A., Procter,J., Martin,D. and Barton,G. (2005) Jalview: visualization and analysis of molecular sequences, alignments, and structures.BMC Bioinformatics,6, P28.
22. Wood,T.C. and Pearson,W.R. (1999) Evolution of protein sequences and structures.J. Mol.Biol.,291, 977–995.
23. Nagano,N., Orengo,C.A. and Thornton,J.M. (2002) One fold with many functions: the evolutionary relationships between TIM Barrel families based on their sequences, structures and functions.J.Mol. Biol.,321, 741–765.
24. Rost,B. (1999) Twilight zone of protein sequence alignments. Protein Eng.,12, 85–94.
25. Chen,L., Oughtred,R., Berman,H.M. and Westbrook,J. (2004) TargetDB: a target registration database for structural genomics projects.Bioinformatics,20, 2860–2862.
26. Marchler-Bauer,A., Anderson,J., Cherukuri,P., DeWeese-Scott,C., Geer,L., Gwadz,M., He,S., Hurwitz,D., Jackson,J.et al. (2005) CDD: a conserved domain database for protein classification.Nucl. Acids Res.,33, D192–D196.
27. Marchler-Bauer,A., Panchenko,A., Shoemaker,B., Thiessen,P., Geer,L. and Bryant,S. (2002) CDD: a database of conserved domain alignments with links to domain three-dimensional structure.Nucl. Acids Res.,30, 281–283.
28. Letunic,I., Goodstadt,L., Dickens,N.J., Doerks,T., Schultz,J., Mott,R., Ciccarelli,F., Copley,R.R., Ponting,C.P.et al. (2002) Recent improvements to the SMART domain-based sequence annotation resource.Nucl. Acids Res.,30, 242–244.
29. Schultz,J., Milpetz,F., Bork,P. and Ponting,C.P. (1998) SMART, a simple modular architecture research tool: identification of signaling domains.Proc. Natl Acad. Sci.,95, 5857–5864. 30. Engelman,D.M., Steitz,T.A. and Goldman,A. (1986) Identifying
nonpolar transbilayer helices in amino acid sequences of membrane proteins.Annu. Rev. Biophys. Biophys. Chem.,
15, 321–353.
31. Stajich,J.E., Block,D., Boulez,K., Brenner,S.E., Chervitz,S.A., Dagdigian,C., Fuellen,G., Gilbert,J.G.R., Korf,I., Lapp,H.et al. (2004) The bioperl toolkit: perl modules for the life sciences. Genome Res.,12, 1611–1618. doi: 10.1101/gr.361602. 32. Rice,P., Longden,I. and Bleasby,A. (2000) EMBOSS: the
european molecular biology open Software suite.Trends. Genet.,
16, 276–277.
33. Emanuelsson,O., Brunak,S., von Heijne,G. and Nielsen,H. (2007) Locating proteins in the cell using TargetP, SignalP and related tools.Nat. Protocols,2, 953–971.
34. Julenius,K., Molgaard,A., Gupta,R. and Brunak,S. (2005) Prediction, conservation analysis, and structural characterization of mammalian mucin-type O-glycosylation sites.Glycobiology,
15, 153–164.
35. Blom,N., Gammeltoft,S. and Brunak,S. (1999) Sequence and structure-based prediction of eukaryotic protein phosphorylation sites.J. Mol. Biol.,294, 1351–1362.
36. Yang,Z.R., Thomson,R., McNeil,P. and Esnouf,R.M. (2005) RONN: the bio-basis function neural network technique applied to the detection of natively disordered regions in proteins. Bioinformatics,21, 3369–3376.
37. Linding,R., Jensen,L.J., Diella,F., Bork,P., Gibson,T.J. and Russell,R.B. (2003) Protein disorder prediction: implications for structural proteomics.Structure,11, 1453–1459.
38. Linding,R., Russell,R.B., Neduva,V. and Gibson,T.J. (2003) GlobPlot: exploring protein sequences for globularity and disorder. Nucleic Acids Res.,31, 3701–3708.
39. Cuff,J.A. and Barton,G.B. (2000) Application of multiple sequence alignment profiles to improve protein secondary structure prediction.Proteins: Structure, Function, and Genetics,40, 502–511. 40. Cuff,J.A. and Barton,G.J. (1999) Evaluation and improvement of
multiple sequence methods for protein secondary structure predic-tion.Proteins: Structure, Function, and Genetics,34, 508–519. 41. Edgar,R.C. (2004) MUSCLE: multiple sequence alignment with
high accuracy and high throughput. Nucl. Acids Res.,
32, 1792–1797.
42. Jones,P., Vinod,N., Down,T., Hackmann,A., Kahari,A.,
Kretschmann,E., Quinn,A., Wieser,D., Hermjakob,H. et al. (2005) Dasty and UniProt DAS: a perfect pair for protein feature visualization.Bioinformatics,21, 3198–3199.
43. Canaves,J.M., Page,R., Wilson,I.A. and Stevens,R.A. (2004) Protein biophysical properties that correlate with crystallisation success in Thermotoga maritima: maximum clustering strategy for structural genomics.J. Mol. Biol.,344, 977–991.
44. Dunker,A.K., Brown,C.J., Lawson,J.D., Iakoucheva,L.M. and Obradovic,Z. (2002) Intrinsic disorder and protein function. Biochemistry,41, 6573–6582.
45. Krogh,A., Larsson,B., von Heijne,G. and Sonnhammer,E.L.L. (2001) Predicting transmembrane protein topology with a hidden markov model: application to complete genomes. J.Mol. Biol.,
305, 567–580.
46. Dowell,R., Jokerst,R., Day,A., Eddy,S. and Stein,L. (2001) The distributed annotation system. BMC Bioinformatics,2, 7. 47. Gao,X., Bain,K., Bonanno,J., Buchanan,M., Henderson,D.,
Lorimer,D., Marsh,C., Reynes,J., Sauder,J.et al. (2005)
High-throughput limited proteolysis/mass spectrometry for protein domain elucidation. Journal of Structural and Functional Genomics,
6, 129–134.
at St Andrews University Library on June 4, 2010
http://nar.oxfordjournals.org