637
Evolution of Apparent Diffusion Coefficient,
Diffusion-weighted, and T2-weighted Signal
Intensity of Acute Stroke
Maarten G. Lansberg, Vincent N. Thijs, Michael W. O’Brien, Juan O. Ali, Alex J. de Crespigny, David C. Tong, Michael E. Moseley, and Gregory W. Albers
BACKGROUND AND PURPOSE: Serial study of such MR parameters as diffusion-weighted imaging (DWI), apparent diffusion coefficient (ADC), ADC with fluid-attenuated inversion re-covery (ADCFLAIR), and T2-weighted imaging may provide information on the pathophysio-logical mechanisms of acute ischemic stroke. Our goals were to establish the natural evolution of MR signal intensity characteristics of acute ischemic lesions and to assess the potential of using specific MR parameters to estimate lesion age.
METHODS: Five serial echo-planar DWI studies with and without an inversion recovery pulse were performed in 27 patients with acute stroke. The following lesion characteristics were studied: 1) conventional ADC (ADCCONV); 2) ADCFLAIR; 3) DWI signal intensity (SIDWI); 4) T2-weighted signal intensity (SIT2), and 5) FLAIR signal intensity (SIFLAIR).
RESULTS: The lesion ADCCONV gradually increased from low values during the first week to pseudonormal during the second week to supranormal thereafter. The lesion ADCFLAIR showed the same pattern of evolution but with lower absolute values. A low ADC value indi-cated, with good sensitivity (88%) and specificity (90%), that a lesion was less than 10 days old. All signal intensities remained high throughout follow-up. SIDWI showed no significant change during the first week but decreased thereafter. SIT2initially increased, decreased slight-ly during week 2, and again increased after 14 days. SIFLAIRshowed the same initial increase as the SIT2but remained relatively stable thereafter.
CONCLUSION: Our findings further clarify the time course of stroke evolution on MR parameters and indicate that the ADC map may be useful for estimating lesion age. Application of an inversion recovery pulse results in lower, potentially more accurate, absolute ADC values.
A detailed understanding of the natural evolution of MR signal intensity parameters in stroke patients is potentially clinically relevant. First, it may pro-vide important information about the time course of ischemic brain damage (1–4), since changes in
Supported by Janssen Pharmaceuticals and National Insti-tutes of Health grant 5R01NS35959 and 5R01NS34866; Dr Lansberg was supported by grants from the Dutch Heart As-sociation, Dutch Brain AsAs-sociation, VSB fund scholarship, and Philips Medical Instruments.
Address reprint requests to Gregory W. Albers, MD, Stan-ford Stroke Center, 701 Welch Rd, Building B, Suite 325, Palo Alto, CA 94304.
qAmerican Society of Neuroradiology
MR parameters reflect histopathologic changes in the brain tissue. Several studies have suggested that regions at risk for cerebral infarction may be dif-ferentiated from irreversibly damaged tissue when data from different MR techniques are assessed in conjunction (4–8). Information regarding the age of potentially salvageable tissue may be useful to establish rational time windows for stroke treat-ment and to identify patients who are most likely to benefit from acute stroke therapies. Second, knowledge of the natural evolution of MR char-acteristics may help estimate the age of a lesion when the time of symptom onset is unclear or when multiple lesions are present that could have differ-ent times of onset. Finally, to correctly interpret the results of studies that use MR imaging to monitor the effects of stroke therapies (9–15) it is important to establish the natural evolution of MR parameters in patients not treated with thrombolytic agents or investigational neuroprotective drugs.
(ADC) are of particular interest, because these pa-rameters show changes in ischemic brain tissue within hours after symptom onset, when no abnor-malities are typically seen on conventional MR im-ages (16–23). Acute ischemic lesions are charac-terized by a high signal on DWI and a low ADC (16). The ADC, a measure of the freedom of water diffusion, is believed to be low because of a shift of water, within hypoxic brain parenchyma, from the extracellular to the intracellular compartment, where water diffusion is relatively restricted (16).
The natural evolution of the ADC has been stud-ied in animal models (1–3, 16, 24–26) and in stroke patients (4, 17–19, 21, 27–29). However, most hu-man studies have been retrospective and, generally, few scans were obtained per patient, although Schwamm et al (29) conducted a prospective study with repeated imaging during the first week after stroke onset in 14 patients. Results have differed among investigators. Although it is well accepted that ADC values decline rapidly after the onset of ischemia and subsequently increase, the observed time course of the ADC increase to supranormal values has varied from 24 hours (4) to 17 days (29). In addition, the effect that CSF partial volume con-tamination may have on ADC measurements (30) has not been investigated. The evolution of SIDWI
has been studied in a rat model of cerebral ischemia (26), but, to our knowledge, has not previously been analyzed in humans. The evolution of T2-weighted signal intensity (SIT2) of lesions has been
described in a few animal models (1, 24, 26) and in one small human study (21).
The primary aim of this prospective cohort study was to determine the evolution of the following characteristics of acute ischemic lesions in stroke patients who were not treated with thrombolytic agents or investigational neuroprotective agents: 1) ADC determined from a conventional ADC map (ADCCONV); 2) ADC determined from a fluid-at-tenuated inversion recovery (FLAIR) ADC map (ADCFLAIR); 3) signal intensity on DWI MR im-ages (SIDWI); 3) signal intensity on T2-weighted
MR images (SIT2), and 4) signal intensity on T2-weighted FLAIR MR images (SIFLAIR). We used
these data to investigate whether MR parameters can accurately estimate the age of an ischemic lesion.
Methods
Consecutive patients who presented to the Stanford Stroke Center with a presumed diagnosis of acute stroke within 48 hours after symptom onset were eligible to be considered for this study. Time of stroke onset was determined to be the time at which the patient was last known to be symptom free. A requirement for inclusion in the study was that the actual time of symptom onset had to be known to be accurate within 8 hours. To be eligible for this study, a patient had to have a lesion consistent with an acute stroke in a region appropriate to the presenting symptoms on the baseline DWI study. Pa-tients were excluded if the MR image revealed a nonischemic lesion that could have been responsible for the qualifying symptoms. Patients who were pregnant or less than 18 years
old were excluded, as were patients with active seizures, hy-poglycemia (serum glucose , 50 mg/dL), severe coexisting systemic disease, or contraindications to MR imaging (claus-trophobia, pacemaker, etc). Patients receiving recombinant tis-sue plasminogen activator (rtPA) or an investigational neuro-protective agent were also ineligible. Use of anticoagulants or antiplatelet agents was allowed. Guidelines established by the Trial of Org 10172 in Acute Stroke Treatment (TOAST) were used to classify stroke origin (31). Consent for participation in this investigation was obtained from the patient or a legally authorized representative in all cases. The DWI MR protocol was approved by the Stanford University Medical Center hu-man subjects committee.
Five successive MR studies were scheduled for each patient: an initial study within 48 hours of symptom onset and sub-sequent studies 12 to 48 hours, 3 to 4 days, 5 to 7 days, and 30 days afterward. Examinations could be delayed or canceled on the basis of a patient’s request or scheduling conflicts.
MR imaging studies were performed on a 1.5-T unit with gradient strengths of 22 mT/m. A single-shot spin-echo echo-planar DWI sequence (EPI-DWI) was used. The DWI exami-nation acquired 16 slices (5-mm thick with a 2.5-mm gap be-tween slices) with parameters of 6000/110 (TR/TE), a field of view of 24 cm, a bandwidth of 100 kHz, and a matrix of 128
3128. For each slice, two diffusion weightings (b50 and b
5 849 mm2/s) were applied along the x, y, and z axes. This was repeated with the application of an inversion recovery (IR) pulse before excitation for a second set of images. The DWI images with a high b value were unwarped with reference to the b50 image to correct for distortions due to eddy currents from the diffusion gradients (32) before ADC calculations. For both sets of images (with and without the IR pulse), three ADC maps were calculated and subsequently averaged to yield two sets of trace images: the conventional trace ADC map and the FLAIR trace ADC map. Furthermore, the three DWI images were averaged to yield an average, isotropic, DWI image. The b50 images, acquired with and without the IR pulse, were used as FLAIR and T2-weighted images, respectively.
Data analysis was performed using MR Vision software (MR Vision, Menlo Park, CA) on a Sun Sparc workstation (Sun, Palo Alto, CA). The average ADCs (mm2/s) and signal intensities (arbitrary units) of the ischemic lesions were deter-mined at all time points. Control values were obtained from corresponding normal regions in the contralateral hemisphere. Each measurement was performed by at least two independent, trained observers and their results were averaged. Relative ADCs (rADCCONV and rADCFLAIR) and relative SIs (rSIT2, rSIFLAIR, and rSIDWI), quotients of the lesion, and control val-ues were calculated before graphing and statistical analyses.
Data were stratified into six time periods: day 1, day 2, days 3 to 4, days 5 to 7, days 8 to 14, and day 14 or more after symptom onset. SigmaStat software (San Rafael, CA) was used for statistical analysis. The mean, standard deviation, and 95% confidence intervals of the mean were calculated for the rADCs and rSIs of each time period. The mean ADCs and SIs of ischemic lesions were compared with control values using a two-tailed paired t-test. The mean rADCCONV, rADCFLAIR, rSIT2, rSIFLAIR, and rSIDWIwere compared among time groups using one-way analysis of variance (ANOVA). If the ANOVA was significant, pairwise comparisons were performed to iden-tify specific time groups with different ADCs or SIs. All tests were performed witha5.05.
We performed a linear regression analysis of the time of imaging versus ADC stratified by stroke etiologic subtype to evaluate whether the ADC evolution of these subtypes dif-fered. We compared the slopes of the regression equations for each etiologic subtype (TOAST criteria) with the test for ho-mogeneity of regression coefficients. If the slopes were similar, a differential evolution was unlikely. The same technique was used to study the evolution of ADCs over time with regard to the location of the lesion (subcortical versus cortical) and the baseline National Institutes of Health Stroke Scale (NIHSS) score (comparison of tertiles of NIHSS scores).
The time period that was most accurately characterized by a lesion rADC less than 1.0 (hypointense lesion on the ADC map) was determined with ROC analysis, as were the optimal rSIDWIcriteria to characterize this time period. In addition, the time period that could be characterized most accurately by rSIT2or rSIFLAIRcriteria was determined. Sensitivity and spec-ificity were calculated for these algorithms.
Results
Thirty patients were enrolled in the study and 27 were included in this analysis. One patient was ex-cluded because the family withdrew consent after the first imaging examination. The second excluded patient was found to have experienced waxing and waning symptoms for approximately 7 days, mak-ing the actual time of symptom onset uncertain. The third patient had an extensive hemorrhagic conversion of the infarct that interfered with a de-termination of signal intensity and ADC values. A total of 123 MR images were obtained, and all but one showed at least one ischemic lesion. The single image with negative findings was obtained 24 days after symptom onset in a patient with a small sub-cortical infarct on previous images. Twenty-three (85%) of the 27 patients had at least four serial MR studies. The remaining three patients completed three of the five planned MR examinations. Two of these three patients died after their third MR amination, and the other patient missed two ex-aminations because of scheduling conflicts. One patient had two acute symptomatic ischemic le-sions, one in each hemisphere, which were ana-lyzed separately. Although lesions were present in both hemispheres, appropriate control regions of unaffected brain parenchyma could still be obtained.
The mean patient age was 72 6 12 years and the median NIHSS score was 7 (range, 1–24). Ac-cording to the TOAST classification, the stroke subtype was large artery atherosclerosis in six pa-tients (23%) and cardioembolic in seven papa-tients
(26%). One patient (3%) had a stroke of another determined etiology (primary CNS vasculitis). The stroke was considered cryptogenic in 11 patients (41%). Two patients had small vessel disease (7%). The median lesion volume on the baseline DWI was 9.6 cm3 (range, 1–135). The mean time from
symptom onset to the first MR examination was 30
6 17 hours. Two patients completed the first MR study after 48 hours, one patient at 57 hours, and one patient at 92 hours. The mean time from symp-tom onset to the second, third, fourth, and final MR studies was 2.9 6 1.3, 6.4 6 4.7, 8.5 6 4.6, and 34.0 69.7 days, respectively.
ADCCONVand ADCFLAIR
During the first 7 days after symptom onset, the mean ADCCONV and ADCFLAIR of ischemic brain lesions were significantly lower than those of con-tralateral control regions (P ,.001). From days 8 to 14, the mean ADCCONVand ADCFLAIRdid not
differ significantly from that in the control regions (P 5 .874); beyond 14 days, both the mean ADCCONVand ADCFLAIRwere significantly higher than that in control regions (P , .001). At these chronic time points, discrimination of lesions from adjacent CSF was, in some instances, easier on the FLAIR ADC map than on the conventional ADC map (Fig 1). Figure 2A shows the evolution of rADCCONVand rADCFLAIR. A progressive increase in rADC values was observed. The mean rADCs for all time groups beyond 4 days were statistically significantly higher than the mean rADC during day 1.
The mean ADCCONV control value, calculated
using all 123 MR studies, was higher than the ADCFLAIR control value (876 684 3 1026 mm2/s
versus 821 6853 1026 mm2/s, P,.001). Table
1 shows a comparison of the ADCCONV and the
ADCFLAIR for cortical and subcortical lesions and for large lesion volumes and small lesion volumes. On average, the ADCFLAIR was lower than the ADCCONVwithin the ischemic lesions. This effect
was most marked in cortical lesions as compared with subcortical lesions. The difference between ADCFLAIRand ADCCONV was also greatest in the lesions with the largest volumes. As large lesions have a higher probability of being in contact with CSF spaces, these findings suggest that the ADCFLAIRavoids contamination of CSF within the ADC maps.
The shift from rADC values less than 1.0 to val-ues over 1.0 occurred between days 5 and 14 after symptom onset. The earliest time that an r-ADCCONV greater than 1.0 was observed was at
109 hours. Subsequently, the frequency of lesions with an rADCCONV over 1.0 gradually increased
from 25% (7/28) for lesions imaged between days 5 through 7, to 55% (6/11) between days 8 through 14, to 93% (25/27) after day 14. For the r-ADCFLAIRthese values were 25%, 73%, and 93%,
FIG1. MR images (6000/210/1) at five subsequent time points in a 67-year-old woman with left hand weakness, left facial droop, and slurred speech. This example shows the typical evolution of the SIT2(top row), SIFLAIR(second row), SIDWI(third row), ADCCONV(fourth row), and ADCFLAIR(bottom row) of an acute ischemic lesion (right hemisphere). On the ADC maps, the lesion is hypointense up to day 7 and hyperintense at 27 days, making it possible to differentiate the acute from the chronic lesion. On the DWI images, the lesion is hyperintense at all time points so that, by visual inspection, the signal intensity of the lesion on the acute scan cannot be differentiated from that on the chronic scan. On the T2-weighted and FLAIR images, lesion signal intensity increases up to day 4 and remains high thereafter. Note that at 27 days the lesion is more identifiable on the ADCFLAIRmap than on the ADCCONVmap.
after 14 days, one was imaged at 20 days and had an rADCCONV of 0.89 (rADCFLAIR 0.95) and the
other was imaged at 33 days and had an rADCCONV of 0.84 (rADCFLAIR 0.83). Lesions with an
r-ADCCONVor rADCFLAIRof less than 1.0 most
ac-curately (least false positive or false negative) char-acterized the time period from 0 to 10 days after symptom onset. Considering lesions with an r-ADCCONVof less than 1.0 to be 10 days old or less
FIG2. Average relative lesion ADC values and signal intensities with 95% confidence intervals during five time intervals after onset of stroke symptoms.
A, rADCCONV, rADCFLAIR, and rSIDWI.
[image:5.612.59.541.56.227.2]B, rSIT2and rSIFLAIR(see Table 2 for the number of lesions included at each time interval).
TABLE 1: Comparison of ADCFLAIRwith ADCCONVwith respect to lesion location (cortical and subcortical) and lesion size (highest tertile
of baseline DWI volume and lowest and middle tertile of baseline DWI volume)
2
ADCFLAIR(mmm /s) ADCCONV(mmm /s)2 P Value
Cortical and subcortical lesions (mean, SD) Cortical lesions (mean, SD)
Subcortical lesions (mean, SD)
Largest baseline DWI lesion volumes, highest tertile (mean, SD)
Smallest baseline DWI lesion volumes, lowest and middle tertile (mean, SD)
7656264 7936279 6896204 504629 5906120
7856282 8176295 7006227 537633 601699
.003 .006 .210 .006 .529
Note.—The highest tertile of lesion volumes is the baseline DWI volume of 16 to 135 cm3; the lowest and middle tertile of lesion volumes are the baseline lesion DWI volumes of 1 to 11.5 cm3.
to be more than 10 days old yielded 88% sensitivity and 90% specificity. Using an rADCFLAIRcutoff of 1.0 yielded very similar results (sensitivity 86%, specificity 93%).
ADC Evolution in Stroke Subtypes
Regression analysis determined that the evolu-tion of ADC over time was similar for patients with cardioembolic stroke, for patients with large vessel disease, and for patients with cryptogenic stroke, small vessel disease, or other determined pathogen-eses of stroke (test for homogeneity of regression coefficients, P5 .388).
No differential evolution could be found for sub-cortical versus sub-cortical lesions or for increasing se-verity of the baseline NIHSS score (test for ho-mogeneity of regression coefficients, P5.482 for location and P 5 .697 for NIHSS score).
SIDWI
The mean SIDWI was significantly higher than
control values throughout all time periods. The lowest rSIDWI was 1.18 and was seen in a lesion
imaged 30 days after symptom onset. Figure 2A illustrates the evolution of the rSIDWI. The mean
rSIDWI of lesions, examined during day 1, day 2, days 3 to 4, and days 5 through 7, ranged from
1.90 to 2.21 (Table 2), and no significant differ-ences were found among groups. In the 8- to 14-day period, the mean rSIDWI decreased to 1.64 6
0.28, and was significantly lower than during the earlier time periods (P,.001). After day 14, mean rSIDWI further decreased to 1.50 6 0.16, but this was not significantly lower than during the 8- to 14-day period (P5.07). On the latest study in this series, 72 days after symptom onset, the rSIDWIwas
1.42.
Lesions less than 10 days old could be differ-entiated from those more than 10 days old by using rSIDWI. Maximal accuracy was achieved when
le-sions with an rSIDWI of more than 1.68 were con-sidered to be 10 days old or less, while lesions with an rSIDWIof less than 1.68 were considered to be 10 days old or older. This algorithm was 85% sen-sitive and 90% specific.
SIT2and SIFLAIR
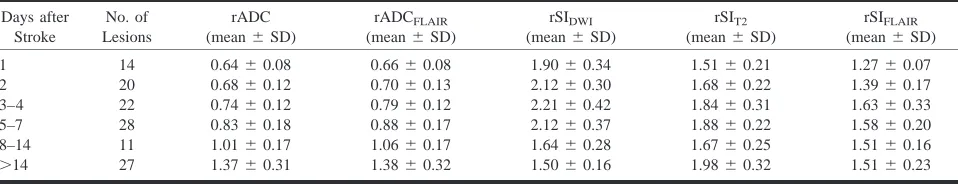
[image:5.612.62.541.647.718.2]grad-TABLE 2: Summary of average relative apparent diffusion coefficient and signal intensity values (6SD) of ischemic lesions during different time intervals Days after Stroke No. of Lesions rADC (mean6SD)
rADCFLAIR (mean6SD)
rSIDWI (mean6SD)
rSIT2 (mean6SD)
rSIFLAIR (mean6SD)
1 2 3–4 5–7 8–14 .14 14 20 22 28 11 27
0.6460.08 0.6860.12 0.7460.12 0.8360.18 1.0160.17 1.3760.31
0.6660.08 0.7060.13 0.7960.12 0.8860.17 1.0660.17 1.3860.32
1.9060.34 2.1260.30 2.2160.42 2.1260.37 1.6460.28 1.5060.16
1.5160.21 1.6860.22 1.8460.31 1.8860.22 1.6760.25 1.9860.32
1.2760.07 1.3960.17 1.6360.33 1.5860.20 1.5160.16 1.5160.23
Note.—rADCCONVindicates relative conventional apparent diffusion coefficient; rADCFLAIR, relative fluid-attenuated inversion recovery apparent diffusion coefficient; rSIDWI, relative diffusion-weighted signal intensity; rSIT2, relative T2-weighted signal intensity; rSIFLAIR, relative fluid-atten-uated inversion recovery signal intensity.
ually increased over the first week from 1.51 6 0.21 to 1.88 6 0.22, while the rSIFLAIR increased
from 1.27 60.07 to 1.58 6 0.20. The rSIs of the 3- to 4-day period and the 5- to 7-day period were significantly higher than those during day 1. Com-pared with the 5- to 7-day period, slightly lower signal intensities were seen during the 8-to 14-day period (rSIT2 5 1.67 and rSIFLAIR 5 1.51), but
these differences were not statistically significant. After day 14, the rSIT2 increased significantly to
1.986 0.32, whereas the rSIFLAIRremained stable at 1.51 6 0.23. In the control regions, the mean SIT2was higher than the mean SIFLAIR(3096135 versus 2386 102, P, .001).
The early rise in SIT2made it possible to differ-entiate acute lesions from older lesions based on rSIT2 or rSIFLAIR. Maximal accuracy was achieved when lesions with an rSIT2 of less than 1.52 were
considered to be 36 hours old or less, while lesions with an rSIT2of 1.52 or greater were considered to
be more than 36 hours old. This algorithm was 67% sensitive and 90% specific. Considering le-sions with an rSIFLAIR of less than 1.37 to be 36 hours old or less, while considering lesions with an rSIFLAIRof 1.37 or greater to be less than 36 hours old yielded 91% sensitivity and 83% specificity.
Discussion
Our results show that in stroke patients who are not treated with thrombolytic agents or investiga-tional neuroprotective agents the mean rADC of is-chemic lesions gradually increases over time, but remains significantly decreased relative to that of a contralateral control region for the first 7 days after symptom onset. This pattern is consistent with sev-eral previous studies (17–19, 21, 27). An earlier rise in ADC has been reported by two groups (4, 28) but most likely reflects differences in methods of data acquisition (33) and data analysis (34). The later rise in ADC observed in one recent study with a relatively small sample size may have been a co-incidental finding (29).
Our study also shows that the SIT2 of ischemic
lesions increases progressively over the first 4 days after symptom onset and remains relatively stable thereafter. The increase in mean SIT2over the first
4 days, with a relatively stable ADC, may be ex-plained by a simultaneous increase in cytotoxic and vasogenic edema. Clinically, this corresponds well with the typical evolution of brain swelling that is often observed in large infarcts over the initial 2- to 5-day period after symptom onset (35, 36). Peaking of SIT2and return of the ADC to (pseudo)
normal values have been shown to correlate his-tologically with the appearance of large numbers of shrunken eosinophilic neurons, indicating irrevers-ible neuronal damage in a rat stroke model (1). In rats, these changes in MR parameters occur ap-proximately 24 hours after stroke onset, whereas our data indicate that these MR findings in humans typically do not occur until 4 days after symptom onset. This suggests a considerably longer evolu-tion of the ischemic lesion and potentially a longer time window during which effective therapies might be beneficial in humans. Note, however, that different regions within an ischemic lesion may progress at a different pace, possibly because of varying degrees of hypoperfusion or intrinsic dif-ferences in tissue vulnerability to hypoxia. An MR tissue signature model has been proposed to ac-count for these regional differences and may be a more sensitive indicator of potentially salvageable tissue (4, 8).
In this series, signal intensity on DWI images showed little change during the first week after symptom onset and decreased thereafter, but all le-sions remained hyperintense throughout the time of follow-up. This pattern was most likely the result of SIDWI being influenced by two factors: water
diffusibility and intrinsic T2 properties (T2 shine-through) of the tissue being examined (37). Be-cause the DWI signal remains hyperintense for a long period (up to 72 days in this study), it is not ideal for estimating lesion age. Using DWI to dif-ferentiate lesions less than 10 days old from those more than 10 days old requires the ability to dif-ferentiate between very hyperintense (rSIDWI . 1.68) and moderately hyperintense (rSIDWI,1.68)
[image:6.612.48.527.86.178.2]less than 10 days old from those more than 10 days old based on ADC is relatively simple, because it requires differentiating hypointense from hyperin-tense. This, in our experience, is usually easily de-termined on the basis of visual inspection alone. Thus, although one recent study concluded that the DWI image alone (without the ADC map) is suf-ficient for clinical stroke imaging (38), our results indicate that the ADC map may add useful data regarding the age of ischemic lesions. Based on the SIT2, lesions that are less than 36 hours old can
usually be differentiated from those more than 36 hours old. However, this also requires differentiat-ing subtle degrees of hyperintensity, somethdifferentiat-ing that is probably not feasible by visual inspection. Fur-ther prospective studies will be required to deter-mine the sensitivity and specificity of estimating lesion age on the basis of visual interpretation with-out ROI analyses.
DWI has been used to monitor stroke treatment in several animal models of reperfusion after ce-rebral ischemia (13, 14, 39–42). A more rapid in-crease of the ADC and a less pronounced inin-crease of the SIT2has consistently been found in animals subjected to early reperfusion as compared with permanent occlusion models. Our group recently reported an early rise in ADC in patients treated with rtPA (15). Previous studies have shown that the decrease in ADC during acute ischemia is re-lated to significant reductions in cerebral blood flow (16). ADC and, potentially, other MR param-eters are quantitative measures that may be useful for evaluating the effect of stroke treatments. Data from this study may be helpful as historical control values for future treatment studies.
To our knowledge, the application of an IR pulse as part of the EPI-DWI examination has not pre-viously been described in human stroke studies. Application of an IR pulse to suppress the CSF signal resulted in lower ADC values. This strongly suggests that the ADC values obtained from a con-ventional ADC map are contaminated with CSF signal, an issue first addressed by Pierpaoli et al (30). Thus, the IR pulse may be required to obtain accurate ADC values. Moreover, chronic lesions are frequently better visualized on the FLAIR ADC map than on the conventional ADC map.
This study has some limitations. We have few data regarding the MR characteristics of hyperacute lesions (,12 hours). Patients who presented within 12 hours of symptom onset were often excluded from this natural history study, because they were treated with rtPA or enrolled in investigational stroke treatment trials. Also, because of the pre-determined scan time points, we obtained few scans between 15 and 25 days after symptom onset. Fur-ther studies are currently underway to analyze these time periods in more detail.
Conclusion
This study documents the natural evolution of ADCCONV, ADCFLAIR, SIDWI, SIFLAIR, and SIT2in
acute stroke patients. These data help further clarify the time course of stroke evolution, which may have important implications for establishing ratio-nal time windows for acute stroke treatment. In ad-dition, these data could be used as reference values for studies that use MR parameters for the evalu-ation of stroke therapies. Moreover, these data pro-vide epro-vidence of the importance of the ADC map for approximating lesion age and indicate that FLAIR ADC maps yield lower, potentially more accurate ADC values than do conventional ADC maps.
Acknowledgment
We are grateful to the patients who gave their time to par-ticipate in this study, to Stephanie Kemp for the logistical or-ganization of the study, and to Maj Hedehus for valuable dis-cussions during the preparation of the manuscript.
References
1. Knight RA, Dereski MO, Helpern JA, Ordidge RJ, Chopp M.
Magnetic resonance imaging assessment of evolving focal ce-rebral ischemia: comparison with histopathology in rats.
Stroke 1994;25:1252–1261
2. Pierpaoli C, Righini A, Linfante I, Tao-Cheng JH, Alger JR, Di Chiro G. Histopathologic correlates of abnormal water diffusion
in cerebral ischemia: diffusion-weighted MR imaging and light and electron microscopic study. Radiology 1993;189:439–448
3. Hasegawa Y, Fisher M, Latour LL, Dardzinski BJ, Sotak CH.
MRI diffusion mapping of reversible and irreversible ischemic injury in focal brain ischemia. Neurology 1994;44:1484–1490
4. Welch KM, Windham J, Knight RA, et al. A model to predict the
histopathology of human stroke using diffusion and T2-weighted magnetic resonance imaging. Stroke 1995;26:1983–1989
5. Barber PA, Darby DG, Desmond PM, et al. Prediction of stroke
outcome with echoplanar perfusion- and diffusion-weighted MRI. Neurology 1998;51:418–426
6. Rordorf G, Koroshetz WJ, Copen WA, et al. Regional ischemia
and ischemic injury in patients with acute middle cerebral ar-tery stroke as defined by early diffusion-weighted and perfu-sion-weighted MRI. Stroke 1998;29:939–943
7. Tong DC, Yenari MA, Albers GW, O’Brien M, Marks MP, Mose-ley ME. Correlation of perfusion- and diffusion-weighted MRI
with NIHSS score in acute (,6.5 hour) ischemic stroke.
Neu-rology 1998;50:864–870
8. D’Olhaberriague L, Welch KM, Nagesh V, et al. Preliminary
clinical-radiological assessment of a MR tissue signature mod-el in human stroke. J Neurol Sci 1998;156:158–166
9. Yenari MA, Palmer JT, Sun GH, de Crespigny A, Mosely ME, Steinberg GK. Time-course and treatment response with
SNX-111, an N-type calcium channel blocker, in a rodent model of focal cerebral ischemia using diffusion-weighted MRI. Brain
Res 1996;739:36–45
10. Lo EH, Pierce AR, Mandeville JB, Rosen BR. Neuroprotection
with NBQX in rat focal cerebral ischemia: effects on ADC probability distribution functions and diffusion-perfusion re-lationships. Stroke 1997;28:439–446
11. Yenari MA, de Crespigny A, Palmer JT, et al. Improved
perfu-sion with rt-PA and hirulog in a rabbit model of embolic stroke. J Cereb Blood Flow Metab 1997;17:401–411
12. Takano K, Carano RA, Tatlisumak T, et al. Efficacy of
intra-arterial and intravenous prourokinase in an embolic stroke model evaluated by diffusion-perfusion magnetic resonance imaging. Neurology 1998;50:870–875
13. Busch E, Kruger K, Allegrini PR, et al. Reperfusion after
throm-bolytic therapy of embolic stroke in the rat: magnetic reso-nance and biochemical imaging. J Cereb Blood Flow Metab
1998;18:407–418
14. Jiang Q, Zhang RL, Zhang ZG, Ewing JR, Divine GW, Chopp M.
15. Tong DC, Lansberg MG, Yenari MA, Moseley ME. Diffusion and
perfusion weighted imaging following administration of tissue plasminogen activator (rt-PA) in humans with acute ischemic stroke. In: Proceedings of the International Society for Magnetic
Resonance in Medicine, 6th Annual Meeting; Sydney, Australia; 1998. International Society for Magnetic Resonance in Medicine; New York: 1998:238
16. Moseley ME, Cohen Y, Mintorovitch J, et al. Early detection of
regional cerebral ischemia in cats: comparison of diffusion-and T2-weighted MRI diffusion-and spectroscopy. Magn Reson Med
1990;14:330–346
17. Warach S, Chien D, Li W, Ronthal M, Edelman RR. Fast
mag-netic resonance diffusion-weighted imaging of acute human stroke. Neurology 1992;42:1717–1723
18. Warach S, Gaa J, Siewert B, Wielopolski P, Edelman RR. Acute
human stroke studied by whole brain echo planar diffusion-weighted magnetic resonance imaging. Ann Neurol 1995;37:
231–241
19. Marks MP, de Crespigny A, Lentz D, Enzmann DR, Albers GW, Moseley ME. Acute and chronic stroke: navigated spin-echo
diffusion-weighted MR imaging. Radiology 1996;199:403–408
20. Sorensen AG, Buonanno FS, Gonzalez RG, et al. Hyperacute
stroke: evaluation with combined multisection diffusion-weighted and hemodynamically diffusion-weighted echo-planar MR im-aging. Radiology 1996;199:391–401
21. Lutsep HL, Albers GW, DeCrespigny A, Kamat GN, Marks MP, Moseley ME. Clinical utility of diffusion-weighted magnetic
resonance imaging in the assessment of ischemic stroke. Ann
Neurol 1997;41:574–580
22. Singer MB, Chong J, Lu D, Schonewille WJ, Tuhrim S, Atlas SW.
Diffusion-weighted MRI in acute subcortical infarction. Stroke
1998;29:133–136
23. Lovblad KO, Laubach HJ, Baird AE, et al. Clinical experience
with diffusion-weighted MR in patients with acute stroke.
AJNR Am J Neuroradiol 1998;19:1061–1066
24. Hoehn-Berlage M, Eis M, Back T, Kohno K, Yamashita K.
Changes of relaxation times (T1, T2) and apparent diffusion coefficient after permanent middle cerebral artery occlusion in the rat: temporal evolution, regional extent, and comparison with histology. Magn Reson Med 1995;34:824–834
25. Minematsu K, Li L, Fisher M, Sotak CH, Davis MA, Fiandaca MS. Diffusion-weighted magnetic resonance imaging: rapid
and quantitative detection of focal brain ischemia. Neurology
1992;42:235–240
26. Verheul HB, Berkelbach van der Sprenkel JW, Tulleken CA, Tam-minga KS, Nicolay K. Temporal evolution of focal cerebral
is-chemia in the rat assessed by T2-weighted and diffusion-weighted magnetic resonance imaging. Brain Topogr 1992;5:
171–176
27. Schlaug G, Siewert B, Benfield A, Edelman RR, Warach S. Time
course of the apparent diffusion coefficient (ADC) abnormality in human stroke. Neurology 1997;49:113–119
28. Chien D, Kwong KK, Gress DR, Buonanno FS, Buxton RB, Ro-sen BR. MR diffusion imaging of cerebral infarction in
hu-mans. AJNR Am J Neuroradiol 1992;13:1097–1102
29. Schwamm LH, Koroshetz WJ, Sorensen AG, et al. Time course
of lesion development in patients with acute stroke: serial dif-fusion- and hemodynamic-weighted magnetic resonance im-aging. Stroke 1998;29:2268–2276
30. Pierpaoli C, Alger JR, Righini A, et al. High temporal resolution
diffusion MRI of global cerebral ischemia and reperfusion. J
Cereb Blood Flow Metab 1996;16:892–905
31. Adams HP Jr, Bendixen BH, Kappelle LJ, et al. Classification of
subtype of acute ischemic stroke: definitions for use in a mul-ticenter clinical trial, TOAST (Trial of Org 10172 in Acute Stroke Treatment). Stroke 1993;24:35–41
32. de Crespigny A, Moseley M. Eddy current induced image
warping in diffusion weighted EPI. In: Proceedings of the
In-ternational Society for Magnetic Resonance in Medicine, 6th An-nual Meeting; Sydney, Australia; 1998. International Society for Magnetic Resonance in Medicine; New York: 1998:661 33. Warach S, Moseley M, Sorensen AG, Koroshetz W. Time course
of diffusion imaging abnormalities in human stroke. Stroke
1996;27:1254–1255
34. Nagesh V, Welch KM, Windham JP, et al. Time course of ADCw
changes in ischemic stroke: beyond the human eye! Stroke
1998;29:1778–1782
35. O’Brien MD. Ischemic cerebral edema: a review. Stroke 1979; 10:623–628
36. Hacke W, Schwab S, Horn M, Spranger M, De Georgia M, von Kummer R. ‘‘Malignant’’ middle cerebral artery territory
in-farction: clinical course and prognostic signs. Arch Neurol
1996;53:309–315
37. Le Bihan D, Breton E, Lallemand D, Grenier P, Cabanis E, Laval-Jeantet M. MR imaging of intravoxel incoherent motions:
ap-plication to diffusion and perfusion in neurologic disorders.
Radiology 1986;161:401–407
38. Chong J, Lu D, Aragao F, et al. Diffusion-weighted MR of acute
cerebral infarction: comparison of data processing methods.
AJNR Am J Neuroradiol 1998;19:1733–1739
39. Mintorovitch J, Moseley ME, Chileuitt L, Shimizu H, Cohen Y, Weinstein PR. Comparison of diffusion- and T2-weighted MRI
for the early detection of cerebral ischemia and reperfusion in rats. Magn Reson Med 1991;18:39–50
40. Minematsu K, Li L, Sotak CH, Davis MA, Fisher M. Reversible
focal ischemic injury demonstrated by diffusion-weighted magnetic resonance imaging in rats. Stroke 1992;23:1304–1310
41. Bizzi A, Righini A, Turner R, et al. MR of diffusion slowing in
global cerebral ischemia. AJNR Am J Neuroradiol 1993;14:
1347–1354
42. Rother J, Waggie K, van Bruggen N, de Crespigny AJ, Moseley ME. Experimental cerebral venous thrombosis: evaluation
us-ing magnetic resonance imagus-ing. J Cereb Blood Flow Metab