Substorm - Ring Current Coupling: A comparison of
1isolated and compound substorms
2J. K. Sandhu1, I. J. Rae1, M. P. Freeman 2, M. Gkioulidou 3, C. Forsyth1, G.
3
D. Reeves4, K. R. Murphy 5, M.-T. Walach 6
4
1Department of Space and Climate Physics, Mullard Space Science Laboratory, University College 5
London, Dorking, RH5 6NT, UK. 6
2British Antarctic Survey, Cambridge, CB3 0ET, UK. 7
3Applied Physics Laboratory, John Hopkins University, Maryland, USA. 8
4Los Alamos National Laboratory, Los Alamos, USA. 9
5University of Maryland, USA. 10
6Lancaster University, LA1 4YW, UK. 11
Key Points:
12
• Quantitative estimates of ring current energy for compound and isolated substorms
13
are shown.
14
• The energy content and post-onset enhancement is larger for compound compared
15
to isolated substorms.
16
• Solar wind coupling is a key driver for di↵erences in the ring current between
iso-17
lated and compound substorms.
18
Abstract
19
Substorms are a highly variable process, which can occur as an isolated event or as part
20
of a sequence of multiple substorms (compound substorms). In this study we identify
21
how the low energy population of the ring current and subsequent energization varies
22
for isolated substorms compared to the first substorm of a compound event. Using
ob-23
servations of H+and O+ ions (1 eV to 50 keV) from the Helium Oxygen Proton Elec-24
tron instrument onboard Van Allen Probe A, we determine the energy content of the ring
25
current inL-MLT space. We observe that the ring current energy content is significantly
26
enhanced during compound substorms as compared to isolated substorms by⇠ 20
27
30%. Furthermore, we observe a significantly larger magnitude of energization (by⇠40
28
50%) following the onset of compound substorms relative to isolated substorms.
Anal-29
ysis suggests that the di↵erences predominantly arise due to a sustained enhancement
30
in dayside driving associated with compound substorms compared to isolated substorms.
31
The strong solar wind driving prior to onset results in important di↵erences in the time
32
history of the magnetosphere, generating significantly di↵erent ring current conditions
33
and responses to substorms. The observations reveal information about the substorm
34
injected population and the transport of the plasma in the inner magnetosphere.
35
1 Introduction
36Substorms are an impulsive phenomenon associated with the storage and release
37
of energy in the Earth’s magnetosphere. Based on auroral observations, it was proposed
38
that substorms can be described as the occurrence of three separate phases: the growth
39
phase, the expansion phase, and the recovery phase (Akasofu, 1968; R. L. McPherron,
40
1970). Overall, a substorm typically lasts 2-4 hours (Tanskanen, 2009). During the growth
41
phase, low latitude dayside reconnection with the IMF (Interplanetary Magnetic Field)
42
dominates over the nightside reconnection rate, resulting in an accumulation of open field
43
lines in a highly stretched magnetotail (Kokubun & McPherron, 1981; R. McPherron,
44
1972; R. L. McPherron, 1970; Milan, Provan, & Hubert, 2007). Substorm onset marks
45
the beginning of the substorm expansion phase, and during the onset process rapid bursts
46
of nightside reconnection close significant amounts of flux in the magnetotail (e.g., Hones Jr.
47
& Schindler, 1979; Hubert et al., 2006). The dipolarization of the magnetic field and the
48
destabilisation of the near-Earth tail act to energize particles and drive intense electric
49
currents (e.g., Forsyth et al., 2014; R. L. McPherron, Russell, & Aubry, 1973). The
mag-50
netosphere then enters the substorm recovery phase, where the nightside reconnection
51
rate gradually subsides and the system returns to its original state. The occurrence of
52
a substorm has wide ranging and substantial implications for the global magnetosphere
53
and ionosphere. In this study we focus on the impact of substorms on the inner
mag-54
netosphere, specifically on the ring current population.
55
The terrestrial ring current is generated predominantly by ions with energies
rang-56
ing from tens to hundreds of keV and resides mainly between 4 to 7 Earth Radii (RE) 57
(Daglis, Thorne, Baumjohann, & Orsini, 1999; Le, Russell, & Takahashi, 2004; Sandhu
58
et al., 2018). Substorm dipolarization following substorm onset is associated with the
59
injection of plasma to the inner magnetosphere, typically a↵ecting ring current ions with
60
100s eV to 10s keV energies (Yue et al., 2018). However, previous work has shown that
61
the injection of plasma into the inner magnetosphere is highly variable. It has been
iden-62
tified that only approximately 30% of substorms are associated with an observed
clas-63
sical injection signature in the inner magnetosphere (Boakes et al., 2011; Takada et al.,
64
2006). Despite the variability of the injections, a study conducted by Sandhu et al. (2018)
65
demonstrated that, on average, the ring current experiences statistically significant
en-66
hancements following substorm onset. It was establised that the global energy content,
67
estimated from an energy range up to 100s keV covering the bulk population, increased
68
by 12% relative to the pre-onset value, with the enhancement predominantly occurring
69
within the substorm expansion phase. Sandhu et al. (2018) showed that the low energy
population of H+ and O+ ions with energies ranging up to 50 keV exhibited significant 71
enhancements following substorm onset, with the energy content of these ions
increas-72
ing by more than 50%. The energy range is consistent with the expected energy range
73
of substorm-associated plasma injections in the inner magnetosphere (Yue et al., 2018),
74
as well as the ion plasma sheet population convected earthwards.
75
In this paper, we extend the analysis of Sandhu et al. (2018) to explore whether
76
some substorm characteristics are more favourable to ring current energisation than
oth-77
ers. Specifically, we categorise substorms according to the level of additional substorm
78
activity prior to and following an event. We define isolated substorms as those where there
79
is no substorm activity prior to the event and after the event. Compound substorms are
80
defined as occurring as part of a sequence of substorms where the recovery phase leads
81
directly to the expansion phase of a succeeding substorm. Previous work has demonstrated
82
di↵erences in the solar wind driving and auroral evolution during compound substorms
83
in comparison to isolated substorms (e.g., Kim, Lee, & Lyons, 2008; Liou, Newell, Zhang,
84
& Paxton, 2013; Newell & Gjerloev, 2011), such that compound substorms are typically
85
associated with periods of high solar wind - magnetosphere coupling. However, the
quan-86
titative aspect of how a sequence of compound substorms as opposed to an isolated
sub-87
storm can a↵ect the inner magnetosphere, specifically the ring current population,
re-88
mains poorly understood. In this study, we examine whether both types of substorms
89
enhance the ring current population, focusing on the evolution and morphology of the
90
low energy ring current ion population.
91
2 Data and Method
92The Van Allen Probes mission consists of two identically instrumented spacecraft:
93
probe A and probe B (Mauk et al., 2013). The elliptical orbits have an inclination of 10 ,
94
a perigee of⇠600 km altitude, and an apogee of 6 RE geocentric radial distance. The 95
orbital period is 9 hours and the precession of the orbital apogee allows sampling of all
96
local times in less than 2 years. The coverage and low inclination of the Van Allen Probes
97
orbit are highly suited to studying the ring current region. The probes are equipped with
98
the Helium Oxygen Proton Electron (HOPE) mass spectrometers (Funsten et al., 2013;
99
Spence et al., 2013). In this study we use the Level 3 HOPE observations of
omnidirec-100
tional energy fluxes for H+ and O+ions, with an energy range from 1 eV to 50 keV. For 101
this statistical study we take all observations obtained during 2012 to 2018. We note that
102
the energy range was selected to focus on the injected and convected ion population that
103
is particularly sensitive to substorm onset (Sandhu et al., 2018; Yue et al., 2018), and
104
the energy range is not representative of the full ring current population. It is known that
105
higher energies also exhibit energisation, as injections are observed to range up to
sev-106
eral hundred keV (e.g., Sandhu et al., 2018; D. L. Turner et al., 2017).
107
The omnidirectional ion fluxes obtained from HOPE are used to estimate the
en-108
ergy content for both the H+ and O+ data sets. The same method as detailed by Sandhu 109
et al. (2018) (adapted from Gkioulidou, Ukhorskiy, Mitchell, and Lanzerotti (2016)) is
110
applied to the data and will now be briefly summarised. The omnidirectional ion energy
111
flux,j(Ech), at the instrument energy channels,Ech, is taken for a given data set. The
112
partial energy density,", is then calculated with a temporal resolution of 5 minutes
us-113
ing the following equation:
114
"=X
Ech
2⇡p2Echmj(Ech) Ech (1)
where Ech is the energy channel bin width, andmis the ion mass. For a given
115
5 minute time bin, we then consider the volume, V(L), which is the volume of the dipole
116
magnetic field intersecting the area defined by the range ofLshells traversed in the time
interval and 6 hours of magnetic local time (MLT). The full details of how this volume
118
is determined are provided in the Supplementary Information (Text S1). The partial
en-119
ergy density,"is multiplied by the volume, V(L), to provide an estimate of the energy
120
contained within the volume for each 5 minute time bin,E5-min. The final step taken is
121
to determine the total energy,E, contained within a spatialL-MLT bin. As a spacecraft
122
traverses through the range ofLvalues encompassed by a bin of width L, the energy
123
values are summed. This is expressed by
124 E= " X L E5-min # L P L L (2)
where we use aLbin width of L= 1.. It is noted that the scaling factor shown
125
in equation 2 accounts for spacecraft trajectories where the distance traversed by the
space-126
craft di↵ers from the Lextent of the bin (e.g. a partial pass through the bin). This method
127
is applied to both the H+ and O+ HOPE data sets, covering the time period from 2012 128
to 2018. We thus obtain estimates of the energy content ofL-MLT bins (L bin width
129
of 1. and MLT bin width of 6 hours) for each ion data set. The final dataset provides
130
good coverage over all MLT values and over anLrange from 3 to 7. This will allow
anal-131
ysis of the bulk ring current region, as well as an examination of local time variations.
132
In order to examine how the energy content values vary during the substorm
pro-133
cess, the values are binned according to substorm phase. The substorm phase for a given
134
time is identified by applying the Substorm Onsets and Phases from Indices of the
Elec-135
trojet (SOPHIE) technique (Forsyth et al., 2015) to the SuperMAG SML index
(Gjer-136
loev, 2012; Newell & Gjerloev, 2011), using an expansion percentile threshold of 75. We
137
note here that the SML index can be considered as an equivalent to the AL index. In
138
brief, the SOPHIE technique evaluates the rate of change of the SML index with 1 minute
139
temporal resolution. The technique identifies the expansion and recovery phases from
140
temporal gradients in the SML index and labels all other times as growth phases. The
141
SOPHIE technique is illustrated in Figure 1, where the SML timeseries is displayed for
142
two substorm periods. The colour coding of the timeseries indicates the identified
sub-143
storm phases, where green is the growth phase, blue is the expansion phase, and red is
144
the recovery phase. Using this approach, 9994 unique substorms are identified for the
145
time period considered.
146
A key characteristic of the ring current is the large enhancements in energy
con-147
tent during geomagnetic storms (Akasofu, Chapman, & Venkatesan, 1963; Gonzalez et
148
al., 1994). It has been demonstrated that quiet time and storm time substorms exhibit
149
important and fundamental di↵erences in the characteristics of injections and the e↵ects
150
on the ring current (e.g., Reeves & Henderson, 2001). In this study, we focus solely on
151
non-storm time measurements, to reduce variability in energy values and focus on
dif-152
ferences between the isolated and compound substorms. Storm periods are identified
us-153
ing the approach detailed by Murphy et al. (2018), based on an initial storm list
devel-154
oped by D. L. Turner et al. (2015). For full details, the reader is referred to both D. L. Turner
155
et al. (2015) and Murphy et al. (2018). The storm list is used to exclude any
measure-156
ments of the energy content that occur during a geomagnetic storm, and the following
157
analysis is representative of non-storm conditions only. The exclusion of storm times
re-158
duces the number of substorms in the analysis to 5756.
159
For this analysis, it is also required that we di↵erentiate between isolated substorms
160
and compound substorms. Using the SOPHIE technique, the sequence of phases can be
161
identified, as illustrated by the examples shown in Figure 1. Compound substorms are
162
identified from sequences where there are multiple onsets of an expansion phase with no
163
intermediate growth phases (see Figure 1b). Each of the onsets within a given sequence
164
are classified as an individual compound substorm. In contrast, isolated substorms are
165
periods flanked by growth phases where only one onset occurs (see Figure 1a). Overall,
Figure 1. The SML incex [nT] plotted as a function of time showing examples of (a) an iso-lated substorm and (b) a sequence of compound substorms. The colour coding indicates the substorm phases as identified using the SOPHIE technique. Green corresponds to the growth phase, blue corresponds to the expansion phase, and red corresponds to the recovery phase. The start times of the phases are also indicated by the vertical grey dashed lines.
there are 2116 isolated substorms and 1349 compound substorm sequences (consisting
167
of 3640 individual compound substorms in total) identified.
168
3 Energy Content of Low Energy Ring Current Ions
169Using the estimated values of energy content, we assess how the energy contributed
170
by ions with energies between 1 eV to 50 keV varies with respect to substorm onset for
171
isolated and compound substorms. We consider both H+and O+ ions. In the follow-172
ing results we have chosen to focus on changes over onset, between the growth phase and
173
expansion phase. Sandhu et al. (2018) demonstrated that the post-onset enhancement
174
of the ring current predominantly occurs during the expansion phase, and that no
sig-175
nificant further energization occurs during the substorm recovery phase.
176
Figure 2a-c and Figure 3a-c show occurrence distributions of energy values,E [J],
177
during the growth phase (shaded distribution) and the expansion phase (line
distribu-178
tion) for the spatial bin 5L <6 and 18 MLT<24. Cumalative probability
dis-179
tributions are also shown in Figure 2d,e and Figure 3d,e. Figure 2 corresponds to H+ 180
ions and Figure 3 corresponds to O+ ions. For each occurrence distribution, the mean 181
value is indicated by the solid diamond at the top of the relevant panel and the
num-182
ber of points in the distribution is labelled, using the same colour coding as the
bution. Futhermore, Figure 2 and Figure 3 show occurrence distributions of energy
con-184
tent for isolated substorms (a,d) and compound substorms (b,c,e). The compound
sub-185
storms are also further separated based on where they occur within the sequence. The
186
number of preceding substorm expansion phases since the latest growth phase,nS, is
iden-187
tified. Compound substorms that are the first of the sequence (nS= 0) correspond to
188
panel (b,e). Substorm expansion phases that have followed the recovery phase of a
pre-189
ceeding substorm (nS 1) correspond to panel (c), and as the expansion phase was
190
not preceeded by a growth phase, there is no shaded distribution present. Although we
191
focus on a singleL-MLT bin in the pre-midnight sector for Figure 2 and Figure 3, the
192
same trends in the occurrence distributions are observed for the other spatial bins. The
193
5 L < 6 and 18 MLT< 24 bin was selected here because this region was
ob-194
served to undergo the largest and most significant energization by Sandhu et al. (2018).
195
Figure 2. The (a-c) occurrence distributions and the (d,e) cumalative probability distribu-tions of energy content values,E[J], for the spatial bin 5 L < 6 and 18 MLT< 24 for H+ ions. For each energy bin, the number of samples in the bin,n, is divided by the total number of samples in the distribution,N, to obtain the occurrence values. The pale shaded distribution shows values during the growth phase and the line distribution shows values during the expan-sion phase. The total number of samples in each distribution is labelled and the mean value for each distribution is indicated by the diamonds, using the same colour coding as the distributions. Each panel corresponds to a di↵erent category of substorms. We show (a,d) isolated substorms, (b,e) compound substorms for the first substorm in the sequence, and (c) compound substorms for the second or more substorms in the sequence. The cumalative probability distributions also indicate the Kolmogorov-Smirnov test statistic, shown by the blue arrow.
A comparison of Figure 2a-c and Figure 3a-c indicates that the average energy
val-196
ues for the H+ ions typically range from 0.4
⇥1013 J during the growth phases of iso-197
lated substorms (Figure 2a) up to 1.3⇥1013 J during the second and subsequent ex-198
pansion phases of compound substorms (Figure 2c). The average energy values for the
199
O+ ions range from 0.2⇥1013J to 0.5⇥1013 J for the same cases (Figure 3a,c). Al-200
though the magnitudes of energy values are smaller for the O+ ions compared to the H+ 201
ions, consistent trends are observed for both ion species, and we will focus on Figure 2
Figure 3. The occurrence distributions and cumalative probability distributions of energy content values for O+ ions, following the same format and colour coding as Figure 2.
to describe these variations. Figure 2a,b shows that the mean energy for the expansion
203
phase is increased compared to the growth phase. Furthermore, the di↵erence in energy
204
appears to be greater for compound substorms (Figure 2b) than for isolated substorms
205
(Figure 2a). Figure 2a,b also shows that the mean energy values are larger for compound
206
substorms than isolated substorms, in both the growth and expansion phases. This
in-207
dicates important di↵erences in the energy content, as well as post-onset changes in the
208
energy content, between isolated and compound substorms. In terms of the compound
209
substorms, Figure 2c shows that, for compound substorms following at least one
previ-210
ous onset in the sequence, the distribution is observed to be much broader compared to
211
the distribution for the first substorm in a sequence (Figure 2b). The energy values are
212
more variable and the mean energy is larger. It is suggested that significant further
en-213
ergization of the ring current occurs during the sequence of compound substorms (asnS 214
increases). For the following analysis, we choose to focus only on isolated substorms and
215
the first compound substorm of a sequence (hereafter referred to simply as a compound
216
substorm). This will reduce the clear variability observed within a series of compound
217
substorms and avoid the e↵ects of preconditioning on the observed energy values.
218
Figures 2d,e and 3d,e show how the Kolmogorov-Smirnov test can be applied to
219
identify statisitically significant di↵erences in the energy distributions, in this case
com-220
paring the energy distributions during the growth phase to the expansion phase. From
221
the cumalative probability distributions shown in Figure 2d,e, the energy bin associated
222
with the maximum absolute di↵erence between the distributions is identified. The
mag-223
nitude of the di↵erence, shown by the blue arrows, provides the value of the
Kolmogorov-224
Smirnov test statistic. The correspondingpvalues from the Kolmogorov-Smirnov test
225
indicate the probability that the distributions are drawn from the same population.
Com-226
paring the growth phase to the expansion phase for H+ ions, thepvalue for isolated sub-227
storms is 9.7⇥10 3 and thepvalue for compound substorms withnS= 0 is 6.0
⇥10 3. 228
Using a typical probability threshold of 0.01, we can identify that the energy
distribu-229
tions for the growth and expansion phases have statistically significant di↵erences. For
230
the O+ ions (Figure 3d,e), thepvalues are 0.11 for isolated substorms and 0.01 for com-231
and expansion phase distributions are not identified to be statistically significantly
dif-233
ferent the isolated substorms and the di↵erence in marginal for the compound substorms.
234
Whereas Figures 2,3 focus on one spatial bin, we also extend the analysis to assess
235
the global distribution of energy values for both isolated and compound substorms.
Fig-236
ure 4 and Figure 5 show mean energy values for allL-MLT bins, for the H+ and O+ ions, 237
respectively. The mean energies are shown for the isolated substorms during the (a) growth
238
and (b) expansion phases. The corresponding values for the compound substorms
dur-239
ing the (d) growth and (e) expansion phases are also shown. The number of samples in
240
eachL-MLT bin (provided in Figure S1 of the Supplementary Information) show that
241
the number of values in a givenL-MLT bin ranges from more than 50 to several
hun-242
dred samples, which is sufficient for the statistical analysis conducted here. To compare
243
the change in mean energy from the growth to the expansion phase, the di↵erence in mean
244
energies for the expansion phase relative to the growth phase are shown for (c) isolated
245
substorms and (f) compound substorms. For a givenL-MLT bin, the distribution of
val-246
ues in the growth and expansion phase are compared under the Kolmogorov-Smirnov
247
test, as described above. If thepvalue is less than 0.01 then the distributions are shown
248
to be significantly di↵erent, and the di↵erence in the mean values is plotted. If thep 249
0.01, there is no significant di↵erence in the distributions and the bin is plotted as light
250
grey. Using the sam approach, we also compare the mean values between isolated and
251
compound substorms during the (g) growth and (h) expansion phases. The use of the
252
Kolmogorov-Smirnov testing allows us to identify theL-MLT bins that are associated
253
with statistically significant changes in the mean energy over onset (c,f) and statistically
254
significant di↵erences with substorm type (g,h).
255
The spatial distributions shown in Figures 4 and 5 are qualitatively similar. The
256
Ldependence observed is such that the energy values increase withL, which is a
con-257
sequence of the approach used. The volume corresponding to theL-MLT bin, over which
258
the energy density is integrated over, increases withLvalue. Figures 4 and 5 also show
259
that the energy values have a clear azimuthal asymmetry, such that the energy values
260
tend to be greatest in the premidnight MLT sector.
261
The magnitudes of the energy values di↵er for the H+ and O+ ions, as expected 262
based on previous work (Sandhu et al., 2018), where this feature was also identified from
263
Figures 2 and 3. The mean energy value for anL-MLT bin extends up to⇠1013J for 264
the H+ ions, whereas for the O+ ions the value ranges up to
⇠3⇥1012 J. 265
For a given ion species, di↵erences and changes in the mean energy with substorm
266
type as well as from the growth to expansion phase of a substorm are apparent and are
267
quantitatively demonstrated by the E L-MLT maps. Figure 4c,f shows that, for both
268
isolated and compound substorms, the only statistically significant changes in the
en-269
ergy content following substorm onset are enhancements that occur on the nightside
re-270
gion. The enhancements are of the order of 1012 J in magnitude, and are largest in the 271
premidnight MLT sector. The magnitude of the changes are comparable between the
iso-272
lated and compound substorms. The corresponding changes in energy content
follow-273
ing substorm onset for the O+ ions are shown in Figure 5c,f. Similarly to the H+ ions, 274
an enhancement in energy content is observed. The enhancement is localised to the
post-275
midnight MLT sector and is of the order 1011 J. 276
The di↵erences in ring current energy content during isolated and compound
sub-277
storms can also be identified. Figure 4g,h shows that the mean H+ energy content tends 278
to be greater during compound substorms than during isolated substorms, both before
279
and after substorm onset. The di↵erence in energy values (⇠1012 J) is comparable to 280
the magnitudes of post-onset changes (Figure 4c,f). During the growth phase, the
sta-281
tistically significant di↵erences in energy content between isolated and compound
sub-282
storms spans over all MLT sectors (Figure 4g). In contrast, during the expansion phase,
283
the di↵erences are reduced and occur only in the postmidnight and afternoon MLT
Figure 4. Values for eachL-MLT bin are plotted at the bins’ location in theL-MLT domain for the H+ ions. The mean energy values,E [J], are shown for (a) growth phases of isolated sub-storms, (b) expansion phases of isolated subsub-storms, (d) growth phases of compound subsub-storms, and (e) expansion phases of isolated substorms. The di↵erence in the mean values, E [J], for the expansion phase relative to the growth phase is shown for (c) isolated substorms and (f) compound substorms. The di↵erence in mean values for the compound substorms relative to the isolated substorms is shown for (g) the growth phase and (h) the expansion phase. It is noted that, for the di↵erence plots (c,f,g,h), the di↵erence in mean values is only plotted if the distri-butions are identified to be statistically di↵erent according to the Kolmogorov-Smirnov test with p <0.01.
tors (Figure 4h). The corresponding results for the O+ ions show similar trends (Fig-285
ure 5g,h). The energy content of O+ ions is consistently larger during compound sub-286
storms compared to isolated substorms, both in the growth phase and expansion phase
287
of the substorms. The magnitude of the energy di↵erence is⇠ 1012J and a compari-288
son to Figure 5c,f indicates that the di↵erences between isolated and compound substorms
289
is larger than the changes in energy content following substorm onset. In terms of the
290
spatial distribution of significant enhancements in Figure 5, the O+ ions show similar 291
trends to those observed for H+ions. 292
It is also useful to consider the global energy content from each ion species in this
293
energy range. We estimate this by summing the mean values from eachL-MLT bin in
294
a givenL-MLT map, in the same manner as Sandhu et al. (2018). Table 1 shows the
Figure 5. Following the same format as Figure 4, for the O+ions.
Table 1. Global energy content [⇥1013J] for H+ (O+) ions
Growth Expansion Expansion - Growth
Isolated 3.3 (1.5) 4.3 (1.8) 1.0 (0.3) Compound 4.2 (1.8) 5.7 (2.3) 1.5 (0.5)
Compound - Isolated 0.9 (0.3) 1.4 (0.5)
timated global energy content for the H+ and O+ ions for the growth phase and expan-296
sion phase of both isolated and compound substorms. The di↵erences in global energy
297
content for the expansion phase relative to the growth phase is also shown, as well as
298
di↵erences for compound substorms relative to isolated substorms. Table 1 provides an
299
indication of how much energy the H+ and O+ ions with energies 1 eV to 50 keV con-300
tribute to the total ring current energy. Table 1 shows that the global energy content
301
for both H+ and O+ ions is
⇠1013 J, and the values are larger for the H+ ions. As ex-302
pected from Figure 4 and Figure 5, the average energy content increases following
sub-303
storm onset, and the enhancement is greater for compound substorms compared to
iso-304
lated substorms. The global energy content is larger for compound substorms compared
305
to isolated substorms, during both the growth and expansion phases.
4 Substorm Characteristics
307In order to understand the clear and significant di↵erences in ring current energy
308
content and response to onset for isolated substorms compared to compound substorms,
309
we consider substorm properties and background conditions. In Figure 6, a superposed
310
epoch analysis of various parameters are shown, relative to substorm onset time, for the
311
substorms considered in this study. The mean values are shown for 5 minute time bins
312
for a time window spanning 60 minutes before onset to 60 minutes after onset. The pale
313
pink lines correspond to isolated substorms and the dark purple lines correspond to
com-314
pound substorms. Figure 6a shows the average values of the SML index [nT]. The SML
315
index is an indicator of the nightside auroral electrojet activity and a depression of the
316
SML index following substorm onset is an indicator of the substorm size (Newell &
Gjer-317
loev, 2011). Prior to onset the SML index is consistently decreased for compound
sub-318
storms compared to isolated substorms by approximately 15 nT. This is indicative of
en-319
hanced convection as well as prior substorm activity. Figure 6a demonstrates that the
320
change in SML index following onset is greater for compound substorms compared to
321
isolated substorms, by approximately 20 nT. Following the rapid reduction in SML
in-322
dex associated with the substorm expansion phase (lasting approximately 25 minutes
323
on average from Figure 6a), it can be seen that the isolated substorms demonstrate a
324
gradual increase in SML index, which is a typical feature of the substorm recovery phase.
325
In contrast, the compound substorms show that the SML index remains at a depressed
326
level. This feature is due to the averaging of successive expansion phases following the
327
first substorm in the series.
328
Figure 6b shows the average values of the dayside reconnection electric field,ER
[mV m 1]. For a given time bin of a given substorm, the dayside reconnection electric
field is estimated from
ER=VxByzsin2
✓✓
2
◆
(3)
whereVx is the GSM (Geocentric Solar Magnetic) x component of the solar wind speed,
329
Byzis the IMF component in the GSM y-z plane, and ✓is the IMF clock angle (Kan &
330
Lee, 1979). The dayside reconnection electric field provides an indication of the rate of
331
low latitude reconnection on the dayside magnetopause. An elevated dayside
reconnec-332
tion electric field corresponds to increased loading of the magnetotail with open flux and
333
increased convection in the magnetosphere (Dungey, 1961; Milan et al., 2003, 2007). The
334
enhanced driving is also associated with increased geomagnetic activity including
sub-335
storm occurrences (e.g., Fairfield & Cahill Jr., 1966). Figure 6 shows that the average
336
magnitude of the dayside reconnection electric field is greater for compound substorms
337
compared to isolated substorms by more than 30% at substorm onset. The magnitude
338
remains markedly greater for compound substorms both before and after substorm
on-339
set.
340
Furthermore, we also show the average value of the Sym-H* index [nT] in Figure
341
6. The Sym-H index represents the horizontal magnetic field perturbations as measured
342
by ground magnetometers, where reductions in the Sym-H index are commonly used as
343
indicators of global geomagnetic ring current intensifications (Dessler & Parker, 1959;
344
Sckopke, 1966). As the Sym-H index is known to include contributions from additional
345
current systems (e.g., Burton, McPherron, & Russell, 1975; N. E. Turner, Baker,
Pulkki-346
nen, & McPherron, 2000), there have been attempts to account for these additional
con-347
tributions through a corrected index, known as the Sym-H* index (e.g., Burton et al.,
348
1975; Gonzalez et al., 1994). Here we opt to use the Gonzalez et al. (1994) definition of
349
the Sym-H* index, in order to more accurately describe the ring current magnitude and
350
variations. Consistent with the low energy ion observations presented in section 3, it is
351
observed that the magnitude of the Sym-H* index is, on average, greater for compound
352
substorms compared to isolated substorms. We note that the Sym-H* index includes
con-353
tributions across all ion energy ranges and species, and the magnitude of the Sym-H*
Figure 6. Superposed epoch analysis of (a) SML index [nT], (b) dayside reconnection electric field,ER, [mV m 1], (c) Sym-H* index [nT]. The mean values in 5 minute bins are plotted rel-ative to the time of substorm onset for isolated substorms (pale pink) and compound substorms (dark purple). The lower quartiles and upper quartiles are shown by the thin dotted lines.
index is dominated by protons with energies of 100s keV. Overall, we observe di↵erences
355
in the SML index, theER parameter, and the Sym-H* index prior to onset. It can be
356
observed that these di↵erences persist for multiple days prior to onset (shown in Figure
357
S2 of the Supplementary Information), suggesting substantially di↵erent time histories
358
associated with isolated and compound substorms.
359
In addition, we have the distributions of the duration of the substorm growth and
360
expansion phases and of the onset latitude and MLT. We find that the growth phase
du-361
ration exhibits statisically significant di↵erences (pvalue of⇠10 6 under the Kolmogorov-362
Smirnov test), such that isolated substorms typically have a longer growth phase. The
363
mean duration of a growth phase is 249 minutes for isolated substorms and 187 minutes
364
for compound substorms. Furthermore, statisically significant di↵erences are also observed
for the expansion phase duration (pvalue of 0.002). Compound substorms tend to have
366
longer expansion phase durations compared to isolated substorms, with mean durations
367
of 25 minutes and 28 minutes, respectively.
368
It is also observed that the distribution of onset latitudes were di↵erent (pvalue
369
of⇠10 4), such that isolated substorms onsets tend to occur at higher invariant lat-370
itudes. In contrast, the MLT of onsets were not significantly di↵erent for isolated
sub-371
storms compared to compound substorms (pvalue of 0.12). The results of this
assess-372
ment are included in Figures S3 and S4 of the Supplementary Information.
373
5 Discussion
374The results presented in section 3 indicate statistically significant variations in the
375
low energy ion population of the ring current, for both H+ and O+ ions, during the sub-376
storm process. It has been clearly identified that the energy contributed by the ions
dif-377
fers for compound substorms compared to isolated substorms, both before and after
sub-378
storm onset. We establish that the compound substorms are associated with larger
en-379
ergy content values before and after substorm onset, and that the post-onset
energiza-380
tion is larger for compound substorms than isolated substorms. Furthermore, an
exam-381
ination of the average substorm properties and solar-wind magnetosphere coupling
in-382
dicate a prolonged higher level of dayside coupling during compound substorms.
Com-383
pound substorms are also larger than isolated substorms, on average. We will now
dis-384
cuss the implications of these findings and explore the drivers of the observed di↵erences.
385
5.1 Enhancements Following Substorm Onset
386
Figure 4c,f and Figure 5c,f demonstrate a statistically significant increase in the
387
mean energy values following substorm onset, although there are some variations between
388
the ion species. In terms of the H+ ions, Figure 4c,f shows that the enhancement follow-389
ing substorm onset is largely in the premidnight MLT sector, consistent with the results
390
of Sandhu et al. (2018). Previous studies have identified that substorm injections of
par-391
ticles occur across the nightside MLT sector (Reeves, Belian, & Fritz, 1991; Reeves, Fritz,
392
Cayton, & Belian, 1990; Reeves, Kettmann, Fritz, & Belian, 1992), although there is a
393
preference for the premidnight MLT sector compared to the postmidnight MLT sector
394
(e.g., Gabrielse, Angelopoulos, Runov, & Turner, 2014; Kokubun & McPherron, 1981;
395
Sarris, Krimigis, & Armstrong, 1976). The injected ion population then experience a
west-396
ward drift in the inner magnetosphere (Lopez, Sibeck, McEntire, & Krimigis, 1990; Mauk
397
& McIlwain, 1974; McIlwain, 1974; Reeves et al., 1990). The combination of the
injec-398
tion occurrence MLT distribution and the duskward transport of injected H+ions pro-399
duce the significant enhancement in the premidnight MLT sector.
400
Figure 5c,f shows that the post-onset enhancement in energy content from the O+
401
ions is localised to the post-midnight sector, in contrast to the result from the H+ ions. 402
It is unclear why the composition of the plasma would a↵ect the local time preference
403
of the injection, such that O+ ions are more likely to be injected in the postmidnight MLT 404
sector compared to the premidnight MLT sector. One potential reason may be deduced
405
from the drift paths of the O+ ions following injection. For ions with sufficient energy, 406
the gradient-curvature drift is dominant and the ions drift westward through the dusk
407
sector. However, if the energy of the O+ ions is low such that the convection electric field 408
dominates the drift path, the ions will be convected through the dawn sector (Ozeke &
409
Mann, 2001). However, there is no clear evidence that O+ions typically have a lower 410
characteristic energy in the inner magnetosphere than H+ ions. The cause of the O+ dawn 411
enhancement remains unknown, and it is highlighted that this feature is certainly
wor-412
thy of future investigation.
5.2 What are the Di↵erences Between Isolated and Compound Substorms?
414
The results highlighted several key di↵erences in the ring current energy content
415
between isolated and compound substorms, which can be summarised as:
416
1. The energy content is enhanced, both before and after substorm onset, for
com-417
pound substorms compared to isolated substorms (Figures 4g,h and 5g,h). The
418
global energy content contributed by low energy H+ and O+ ions is larger dur-419
ing compound substorms than isolated substorms, by⇠20 30% (Table 1).
420
2. For both the H+ and O+ ions, the energy content is more localized to the premid-421
night MLT sector for isolated substorms, whereas the energy is elevated across a
422
more azimuthally extensive area for compound substorms (Figures 4g,h and 5g,h).
423
3. Compound substorms are associated with larger enhancements following substorm
424
onset than isolated substorms (Figures 4c,f and 5c,f and Table 1). The compound
425
substorms are also associated with larger relative changes in energy content over
426
onset. For example, the energy content is enhanced by 30% for isolated substorms
427
and by 40% for compound substorms for H+ ions, with similar trends observed 428
for O+ ions.
429
4. The post-onset enhancements extend across both nightside MLT sectors for
com-430
pound substorms, but are localised solely to the premidnight MLT sector for
iso-431
lated substorms (Figures 4c,f and 5c,f).
432
We will now discuss how the magnetospheric conditions and time history can impart these
433
observed di↵erences between isolated and compound substorms.
434
Previous work has strongly established that enhanced dayside driving and
night-435
side auroral activity, as observed for the compound substorms from Figure 6a,b, results
436
in enhanced ionospheric outflows of both H+ and O+ ions (Axford, 1968; Lockwood, Waite, 437
Moore, Chappell, & Chandler, 1985; Lockwood, Waite, Moore, Chappell, & Johnson, 1985;
438
Yau & Andre, 1997). Through convection the outflows are transported to both the plasma
439
sheet and inner magnetosphere, increasing the hot plasma density and energy (Haaland
440
et al., 2009; Kistler, Mouikis, Klecker, & Dandouras, 2010; Kozyra & Liemohn, 2003; Wang,
441
Lyons, Weygand, Nagai, & McEntire, 2006; Winglee, 2000). In terms of the convective
442
transport of plasma to the ring current, the greater level of solar wind - magnetosphere
443
coupling during compound substorms corresponds to increased convection (Cowley, 1981),
444
suggesting more efficient transport of ions into and across the inner magnetosphere. As
445
well as increasing the density of the ring current, this allows the ions to populate a wider
446
range of MLT sectors during compound substorms than isolated substorms. Furthermore,
447
the convective drifts are more likely to dominate over the gradient-curvature drifts and
448
the ions will be e↵ectively transported to the post-midnight sector as well as to the
day-449
side. In contrast, during isolated substorms, where the convection is relatively (Ozeke
450
& Mann, 2001) stagnated, ions are less e↵ectively transported throughout the
magne-451
tosphere and the energy content is more azimuthally localised. It is highlighted that the
452
relatively active geomagnetic conditions associated with the compound substorms
com-453
pared to the isolated substorms are maintained for⇠days prior to onset, allowing
sig-454
nificant di↵erences in the ring current and plasma sheet populations to develop.
455
The enhanced density and energy of the plasma sheet during compound substorms
456
is corresponded in the injected population following substorm onset. Compound substorms
457
are also, on average, larger than isolated substorms (Figure 6a). Larger substorms are
458
associated with a greater level of dipolarization in the inner magnetosphere, which
in-459
creases the energization of particles as they are transported inwards (Aggson, Heppner,
460
& Maynard, 1983; Ashour-Abdalla et al., 2009; Nakamura et al., 2017; Quinn &
South-461
wood, 1982; Zaharia, Cheng, & Johnson, 2000). This results in a higher density of ions
462
injected to the inner magnetosphere, with higher energies, for compound substorms
com-463
pared to isolated substorms. Furthermore, Reeves and Henderson (2001) showed that
substorms associated with continued injections demonstrated a spatial broadening of the
465
injection region following onset, such that it was able to extend azimuthally across the
466
full nightside MLT sector. The broader injection region associated with compound
sub-467
storms would act to increase the energy content in the post-midnight MLT sector
com-468
pared to isolated substorms, in agreement with the observations.
469
Overall, both the convective and impulsive supply of ions to the ring current
fol-470
lowing substorm onset is more e↵ective for compound substorms, resulting in the observed
471
larger and more spatially extensive post-onset energization. Furthermore, we also note
472
that the occurrence of the first compound substorm in a sequence will drive further
en-473
hancements of ionospheric outflows, thus magnifying the ring current energisation for
474
the subsequent substorms that follow.
475
Previous studies have also shown that enhanced outflows are associated with an
476
enhanced concentration of O+ ions in the plasma sheet and the inner magnetosphere (e.g., 477
Maggiolo & Kistler, 2014; Sandhu, Yeoman, Fear, & Dandouras, 2016; Sandhu, Yeoman,
478
Rae, Fear, & Dandouras, 2017). Although we are not examining the densities in this study,
479
a consideration of the H+/O+ energy content ratio indicates no clear variations (the
ra-480
tio ranges between 0.41 0.45, both before and after onset and for isolated and
com-481
pound substorms). We suggest that, as the estimated energy content depends on the ion
482
energy as well as the fluxes, the variations in energy content are more complex than
den-483
sities.
484
As well as di↵erences in the solar wind coupling and substorm size, the inner
mag-485
netospheric conditions prior to onset may also be important in determining the
magni-486
tude of the energy content enhancement. It has been suggested that a large magnetic
487
field gradient from the plasma sheet to the inner magnetosphere can act to divert flows
488
before the plasma can be transported to the inner magnetosphere (Sergeev,
Angelopou-489
los, & Nakamura, 2012; Takada et al., 2006). The magnetic field perturbation associated
490
with the ring current is southward in the inner magnetosphere and northward in the outer
491
region. This acts to weaken and reduce the radial gradient in the background magnetic
492
field, and therefore increase the probability of an injection in the ring current region.
Fig-493
ure 6c shows the Sym-H* index, which is a measure of magnetic field perturbations for
494
field lines mapping to the inner magnetosphere, often assumed to arise from the
mag-495
netic field contribution from the ring current population (Dessler & Parker, 1959;
Sck-496
opke, 1966). As shown by Figure 6c, the compound substorms are associated with a
con-497
sistently depressed inner magnetospheric field in comparison to isolated substorms and
498
it is proposed that the weaker inner magnetosphere can aid in the accessibility of
sub-499
storm injections to the inner magnetosphere. Previous work has shown that not all
sub-500
storms are associated with an observed injection in the inner magnetosphere, with an
501
classical injection occurrence probability of⇠30% (Boakes et al., 2011). We suggest that
502
the weaker inner magnetospheric field associated with compound substorms compared
503
to isolated substorms act to increase the probability of an injection to the ring current
504
region. On average, this contributes to the observed di↵erence in the magnitude of
post-505
onset energization.
506
5.3 Parameterizing Ring Current Energy Content by Solar Wind
Driv-507
ing
508
The key di↵erences in energy content between isolated and compound substorms
509
have largely been attributed to the prolonged di↵ering solar wind - magnetosphere
cou-510
pling (Figure 6b), which drives ionospheric outflows, substorm activity, and transport
511
of plasma to the inner magnetosphere. We now examine whether the di↵erent average
512
solar wind driving is the key factor in shaping the ring current energy content for the
513
low energy ions. Specifically, we address whether an isolated substorm associated with
514
the same level of solar wind driving as a compound substorm will have the same energy
content value. It is noted here that the level of solar wind driving is prolonged for days
516
prior to onset (Figure S2, Supplementary Information). However, here we opt to
sim-517
ply use the value ofER at onset, which is expected to correspond to a sustained prior
518
driving at that level beforehand and correspond to substorms with a similar time
his-519
tory.
520
Figure 7 and Figure 8 show the mean energy content during the (a) growth and
521
(b) expansion phases. The energy values are binned for the estimated dayside
reconnec-522
tion electric field,ER[mV m 1], at substorm onset, therefore restricting the values to 523
substorms with the same level of solar wind driving. The pink diamonds represent the
524
mean value for isolated substorms, and the purple diamonds represent the mean value
525
for compound substorms. The bars indicate the extent of the upper and lower quartiles,
526
using the same colour coding. Figure 7 shows results for the H+ ions for an L-MLT bin 527
located in the premidnight MLT sector, and Figure 8 corresponds to O+ ions for anL -528
MLT bin in the postmidnight MLT sector. The location of the bins was selected to
cor-529
respond to theL-MLT location of the largest enhancements observed in Figures 4 and
530
5.
531
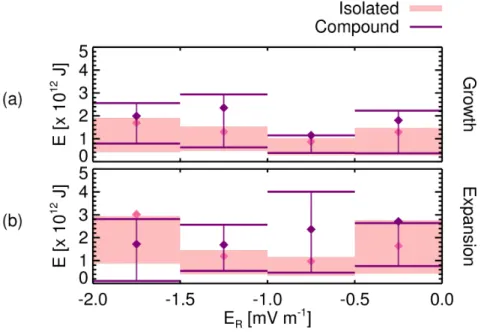
Figure 7. The mean H+ energy content,E [J], for anL-MLT bin covering 5 L < 6 and 18 MLT< 24 are indicated by the diamonds, and the bars/shaded region show the extent of the lower quartile to the upper quartile. Values during the (a) growth phase and (b) expansion phase are shown. Values corresponding to isolated substorms are shown in pink and values corre-sponding to compound substorms are shown in purple. The energy content values are binned for the estimated dayside reconnection electric field,ER[mV m 1], at substorm onset, as labelled on the x-axis.
Figure 7 and Figure 8 indicate that the mean energy content (in a given phase for
532
a givenER bin) is similar between isolated and compound substorms, relative to the spread
533
of values indicated by the quartiles. Conducting Kolmogorov-Smirnov statistical
test-534
ing demonstrates that there are no statistically significant di↵erences between the
en-535
ergy distributions associated with isolated and compound substorms, for any of the bins
536
shown. In addition, it can be seen that the spread of values (indicated by the width of
537
the bars in Figures 7 and 8) generally tend to be greater for compound substorms
Figure 8. Following the same format as Figure 7, for the O+ ions in a spatial bin covering 5L <6 and 00MLT<06.
pared to isolated substorms, and in particular, that the upper quartile extends to higher
539
values. This feature suggests that the tail of the energy distributions for compound
sub-540
storms is larger compared to isolated substorms, consistent with Figures 2 and 3.
541
The results suggest that the ring current energy content, both before and after
on-542
set, is largely controlled by the level of solar wind driving and that the magnitude of
so-543
lar wind - magnetosphere coupling is the main contributor of variations between isolated
544
and compound substorms. Furthermore, we observe a weak correlation between the
so-545
lar wind driving and the substorm size (a Pearson’s linear correlation coefficient of up
546
to 0.2 with a significance of 10 17), providing some support to observations that the so-547
lar wind driving controls substorm intensity (e.g., Li, Wang, & Peng, 2013). Therefore,
548
we suggest that the physics of isolated and compound substorms are essentially the same
549
but that the properties of the two types of substorm (e.g., substorm size shown by the
550
SML index) and the ring current evolution associated with them di↵er because of
dif-551
ferent solar wind magnetosphere coupling that occurs on timescales of days. The more
552
prolonged coupling during compound substorms imparts significant di↵erences in the ring
553
current energy content preceding substorm onset and in the post-onset energisation.
554
5.4 The Influence of the Ring Current on Compound Substorms
555
The analysis presented in section 3 demonstrates clear di↵erences in the pre-onset
556
conditions associated with isolated and compound substorms. Although it is currently
557
unclear why a series of compound substorms may occur as opposed to an isolated
sub-558
storm, the results presented here may provide some insight into the role of inner
mag-559
netospheric conditions in shaping the properties of compound substorms.
560
Figure 6b,c clearly demonstrates that compound substorms are associated with higher
561
driving and an enhanced ring current before substorm onset, as previously discussed. It
562
has been suggested that these conditions are favourable to more intense substorms
ini-563
tiated at field lines that map to low magnetic latitudes in the ionosphere (Milan, 2009;
564
Milan, Boakes, & Hubert, 2008; Milan, Grocott, et al., 2009; Milan, Hutchinson, Boakes,
& Hubert, 2009; Nakai & Kamide, 2003). This is due to a feedback mechanism where
566
the induced magnetic field from the ring current introduces a significant northward
com-567
ponent in the tail, acting to reduce tail stretching and stabilize the tail to onset.
There-568
fore, the magnetosphere requires more open flux to accumulate in the tail (driving the
569
auroral oval to lower latitudes) in order to reach conditions favourable for substorm
on-570
set. As these substorms are inititated at lower latitudes, the amount of open flux closed
571
is larger and the substorm is more intense (Akasofu, 1975; Kamide, Kokubun, Bargatze,
572
& Frank, 1999; Milan, Grocott, et al., 2009). Therefore, as the compound substorms
as-573
sessed here are associated with an enhanced ring current prior to onset (Figures 4g, 5g,
574
and 6c) compared to isolated substorms, the events are more intense and result in larger
575
post-onset ion energization.
576
Whereas Milan et al. (2008) observed the onset latitudes from auroral observations
577
(see also Milan (2009); Milan, Grocott, et al. (2009); Milan, Hutchinson, et al. (2009)),
578
the SOPHIE technique can be used here to identify the magnetic latitude and local time
579
of the active ground magnetometer station that observes the substorm-associated SML
580
signature. The results are included in Figure S4 of the Supplementary Information and
581
we find that, in contrast to the feedback mechanism, the compound substorm onsets do
582
not occur at a significantly lower invariant latitude than for isolated substorms. It is
high-583
lighted that further investigation is required to fully understand how the use of a di↵
er-584
ent onset identification technique may introduce di↵erences. Furthermore, the feedback
585
mechanism was developed to correspond to observations that included storm time ring
586
current conditions, where the ring current is significantly more enhanced than the
ob-587
servations presented in this study. Therefore, we suggest that larger enhancements in
588
the ring current than are observed here are required for significant deviations in the
on-589
set latitude to be present.
590
Continuing the comparison to the results of Milan (2009); Milan et al. (2008);
Mi-591
lan, Grocott, et al. (2009); Milan, Hutchinson, et al. (2009), we observe that a
contin-592
ued high level of solar wind driving is observed following onset for compound substorms,
593
whereas the driving subsides for isolated substorms (Figure 6b). The high level of
so-594
lar wind driving following the onset of the first compound substorm is thought to effi
-595
ciently load the magnetotail with open flux, allowing the tail to reach a state favourable
596
to onset relatively rapidly. Therefore, the magnetosphere can reach an “onset ready”
con-597
dition during the recovery phase, resulting in a compound event to occur. However, we
598
note that the physical processes responsible for substorm onset are well-debated (e.g.,
599
Angelopoulos et al., 2008; Baker, Pulkkinen, Angelopoulos, Baumjohann, & McPherron,
600
1996; Kalmoni et al., 2015; Lui, 2009; Lui, Chang, Mankofsky, Wong, & Winske, 1991),
601
and that a fuller understanding of how substorms are initiated is required to establish
602
why compound substorms occur instead of isolated substorms.
603
6 Conclusions
604An analysis of HOPE H+ and O+ ion observations (1 eV - 50 keV) in the growth 605
and expansion phases of substorms was conducted to quantitatively identify di↵erences
606
in energy content during isolated and compound substorms. We establish that the
en-607
ergy content associated with the ions is significantly increased following substorm
on-608
set for both isolated and compound substorms, where the local time of the enhancements
609
provide insight into the drift paths of injected H+ and O+ ions in the inner magneto-610
sphere.
611
A comparison of isolated and compound substorms demonstrate clear di↵erences
612
in the corresponding ring current energy content. Quantitative estimates of the energy
613
content and di↵erences are provided. In addition, we demonstrate the statistical
signif-614
icance of the di↵erences in energy content over onset and comparing isolated and
com-615
pound substorms. It is observed that compound substorms are associated with an
hanced ring current on average, both before and after onset, relative to isolated substorms.
617
Furthermore, compound substorms are associated with a larger energy input following
618
onset than isolated substorms. A consideration of the average solar wind - magnetosphere
619
coupling, substorm size, and inner magnetospheric conditions, provide context on how
620
di↵erences between isolated and compound substorms arise. Stronger ionospheric
out-621
flows, more e↵ective circulation of plasma, larger magnitude of dipolarisation, and
in-622
creased accessibility of injections to the inner magnetosphere are highlighted as the key
623
factors contributing to the di↵erence in compound substorms relative to isolated
sub-624
storms. In addition, we establish that the di↵erence in average solar wind coupling is a
625
significant source of variability for the ring current conditions.
626
Overall, we have demonstrated that there are significant di↵erences between
iso-627
lated and compound substorms, in terms of the ring current state and substorm
asso-628
ciated energization. It has been found that a single compound substorm is more e↵
ec-629
tive at energizing the ring current than an isolated substorm. We highlight that this study
630
considered only the first compound substorm for each series of compound substorms in
631
an event. Therefore, we can expect that the combined sequence would be highly e↵
ec-632
tive at energizing the ring current to generate a strongly enhanced ring current compared
633
to inactive geomagnetic conditions. It is reasonable to assume that the successive
sub-634
storms in the event would have similar energy inputs to the ring current region based
635
on the continued strong solar wind driving, although a full consideration of the impacts
636
of the whole compound event is left to a future study.
637
Acknowledgments
638
J.K.S. is supported by STFC grant ST/N000722/1 and NERC grant NE/P017185/1, I.J.R.
639
is supported by STFC grant ST/N000722/1 and NERC grant NE/P017185/1, C.F. is
640
supported by NERC IRF NE/N014480/1, K.R.M. is supported by NSF grant 1602403
641
and NASA grants 18-HGIO18 2-012, 18-HSWO2R18-0010, and M.-T.W. is supported
642
by NERC grant NE/P001556/1. Processing and analysis of the HOPE data was supported
643
by Energetic Particle, Composition, and Thermal Plasma (RBSP-ECT) investigation funded
644
under NASAs Prime contract no. NAS5-01072. All RBSP-ECT data are publicly
avail-645
able at the Web site http://www.RBSP-ect.lanl.gov/ The SML index data is publicly
646
available at http://supermag.jhuapl.edu. We gratefully acknowledge the SuperMAG
col-647
laborators (http://supermag.jhuapl.edu/info/?page=acknowledgement). The solar wind
648
data and Sym-H index data are publicly available at http://wdc.kugi.kyoto-u.ac.jp/index.html.
649
References
650Aggson, T. L., Heppner, J. P., & Maynard, N. C. (1983). Observations of large
651
magnetospheric electric fields during the onset phase of a substorm. Jour-652
nal of Geophysical Research: Space Physics,88(A5), 3981-3990. Retrieved
653
fromhttps://agupubs.onlinelibrary.wiley.com/doi/abs/10.1029/ 654
JA088iA05p03981 doi: 10.1029/JA088iA05p03981
655
Akasofu, S.-I. (1968). The growth of the storm-time radiation belt and the
656
magnetospheric substorm. Geophysical Journal of the Royal Astronomi-657
cal Society,15(1-2), 7–21. Retrieved fromhttp://dx.doi.org/10.1111/ 658
j.1365-246X.1968.tb05741.x doi: 10.1111/j.1365-246X.1968.tb05741.x
659
Akasofu, S.-I. (1975). The roles of the north-south component of the
interplan-660
etary magnetic field on large-scale auroral dynamics observed by the dmsp
661
satellite. Planetary and Space Science,23(10), 1349 - 1354. Retrieved from
662
http://www.sciencedirect.com/science/article/pii/0032063375900306 663
doi: https://doi.org/10.1016/0032-0633(75)90030-6
664
Akasofu, S.-I., Chapman, S., & Venkatesan, D. (1963). The main phase of great
665
magnetic storms. Journal of Geophysical Research,68(11), 3345-3350.
666
10.1029/JZ068i011p03345 doi: 10.1029/JZ068i011p03345
668
Angelopoulos, V., McFadden, J. P., Larson, D., Carlson, C. W., Mende, S. B., Frey,
669
H., . . . Kepko, L. (2008). Tail reconnection triggering substorm onset. Sci-670
ence,321(5891), 931–935. Retrieved fromhttp://science.sciencemag.org/ 671
content/321/5891/931 doi: 10.1126/science.1160495
672
Ashour-Abdalla, M., Bosqued, J.-M., El-Alaoui, M., Peroomian, V., Zhou, M.,
673
Richard, R., . . . Angelopoulos, V. (2009). A simulation study of particle
674
energization observed by themis spacecraft during a substorm. Journal of 675
Geophysical Research: Space Physics,114(A9). Retrieved fromhttps:// 676
agupubs.onlinelibrary.wiley.com/doi/abs/10.1029/2009JA014126 doi:
677
10.1029/2009JA014126
678
Axford, W. I. (1968, November). The polar wind and the terrestrial helium
679
budget. Journal of Geophysical Research,73, 6855-6859. doi: 10.1029/
680
JA073i021p06855
681
Baker, D. N., Pulkkinen, T. I., Angelopoulos, V., Baumjohann, W., &
McPher-682
ron, R. L. (1996, June). Neutral line model of substorms: Past results
683
and present view. Journal of Geophysical Research, 101, 12975-13010. doi:
684
10.1029/95JA03753
685
Boakes, P. D., Milan, S. E., Abel, G. A., Freeman, M. P., Chisham, G., & Hubert,
686
B. (2011). A superposed epoch investigation of the relation between
mag-687
netospheric solar wind driving and substorm dynamics with geosynchronous
688
particle injection signatures. Journal of Geophysical Research: Space Physics,
689
116(A1). Retrieved fromhttp://dx.doi.org/10.1029/2010JA016007 690
(A01214) doi: 10.1029/2010JA016007
691
Burton, R. K., McPherron, R. L., & Russell, C. T. (1975). An empirical
rela-692
tionship between interplanetary conditions and dst. Journal of Geophysical 693
Research,80(31), 4204–4214. Retrieved fromhttp://dx.doi.org/10.1029/ 694
JA080i031p04204 doi: 10.1029/JA080i031p04204
695
Cowley, S. (1981). Magnetospheric and ionospheric flow and the interplanetary mag-696
netic field.
697
Daglis, I. A., Thorne, R. M., Baumjohann, W., & Orsini, S. (1999). The terrestrial
698
ring current: Origin, formation, and decay. Reviews of Geophysics, 37(4), 407–
699
438. Retrieved fromhttp://dx.doi.org/10.1029/1999RG900009 doi: 10
700
.1029/1999RG900009
701
Dessler, A. J., & Parker, E. N. (1959). Hydromagnetic theory of
geomag-702
netic storms. Journal of Geophysical Research,64(12), 2239–2252.
Re-703
trieved fromhttp://dx.doi.org/10.1029/JZ064i012p02239 doi:
704
10.1029/JZ064i012p02239
705
Dungey, J. W. (1961, Jan). Interplanetary magnetic field and the auroral zones.
706
Phys. Rev. Lett.,6, 47–48. Retrieved fromhttps://link.aps.org/doi/ 707
10.1103/PhysRevLett.6.47 doi: 10.1103/PhysRevLett.6.47
708
Fairfield, D. H., & Cahill Jr., L. J. (1966). Transition region magnetic field and polar
709
magnetic disturbances. Journal of Geophysical Research (1896-1977),71(1),
710
155-169. Retrieved fromhttps://agupubs.onlinelibrary.wiley.com/doi/ 711
abs/10.1029/JZ071i001p00155 doi: 10.1029/JZ071i001p00155
712
Forsyth, C., Rae, I. J., Coxon, J. C., Freeman, M. P., Jackman, C. M., Gjerloev,
713
J., & Fazakerley, A. N. (2015). A new technique for determining
sub-714
storm onsets and phases from indices of the electrojet (sophie). Journal of 715
Geophysical Research: Space Physics,120(12), 10,592–10,606. Retrieved
716
fromhttp://dx.doi.org/10.1002/2015JA021343 (2015JA021343) doi:
717
10.1002/2015JA021343
718
Forsyth, C., Watt, C. E. J., Rae, I. J., Fazakerley, A. N., Kalmoni, N. M. E.,
Free-719
man, M. P., . . . Carr, C. M. (2014). Increases in plasma sheet temperature
720
with solar wind driving during substorm growth phases. Geophysical Research 721
![Figure 1. The SML incex [nT] plotted as a function of time showing examples of (a) an iso- iso-lated substorm and (b) a sequence of compound substorms](https://thumb-us.123doks.com/thumbv2/123dok_us/9306365.432244/5.918.267.604.138.571/plotted-function-showing-examples-substorm-sequence-compound-substorms.webp)
![Figure 2. The (a-c) occurrence distributions and the (d,e) cumalative probability distribu- distribu-tions of energy content values, E [J], for the spatial bin 5 L < 6 and 18 MLT < 24 for H +](https://thumb-us.123doks.com/thumbv2/123dok_us/9306365.432244/6.918.169.691.375.699/figure-occurrence-distributions-cumalative-probability-distribu-distribu-spatial.webp)


![Figure 6. Superposed epoch analysis of (a) SML index [nT], (b) dayside reconnection electric field, E R , [mV m 1 ], (c) Sym-H* index [nT]](https://thumb-us.123doks.com/thumbv2/123dok_us/9306365.432244/12.918.221.659.105.704/figure-superposed-analysis-dayside-reconnection-electric-field-index.webp)