A Thesis Submitted for the Degree of PhD at the University of Warwick
http://go.warwick.ac.uk/wrap/36222
This thesis is made available online and is protected by original copyright. Please scroll down to view the document itself.
in
Data Envelopment Analysis
Rachel Allen
E
L. 0
T1
WAR
,IC K
Submitted in fulfilment of the requirements for a degree of Doctor of Philosophy
April 1997
Supervisors
I would like to thank the following:
Dr. Emmanuel Thanassoulis
For his supervision, time and dedication to supporting my research.
Prof. Robert G. Dyson
For his kindness and encouragement during the difficult times of my Ph.D.
Dr. Jim Burgess
Whom I met at the Productivity Workshop, Athens, 1994, for his useful and encouraging comments on my work.
Dr. Antreas Athanassopoulos
For his comments and encouragement during the initial stages of my Ph.D.
Warwick DEA Ph.D. students: Au, Laura, Ana, Nikos and Noriko
For their DEA interactions throughout my time as a Ph.D. student.
EPSRC
For funding for this research.
Warwick Business School
For funding my attendance at a variety of conferences throughout my time as a Ph.D. student and while on extension.
My Parents
For their help and support during this time.
My Friends: Amber, Nancy, Amrit, Demetra, AU, Tom, Noelle, Javier, Nanda, Mark, Reena
Synopsis
Papers Submitted for Publication from Thesis Papers Presented at Conference
Abbreviations Ill
Sets of DMUs Ill
Definitions Iv
Classes of DMUs V
Section A - Overview of the Research Area of this Thesis
Chapter One
Introduction I
1.1 Introduction
1.2 Data Envelopment Analysis: The Approach 2
1.3 The Derivation of the DEA Model 4
1.4 Data Envelopment Analysis: A Graphical Illustration 8 1.5 By-Product of a DEA Assessment: Peers & Targets 11
1.6 Conclusion 12
Chapter Two
Why Read This Thesis?
14
2.1 Introduction 14
2.2 Motivation 16
2.2.1 Specification of the Value Judgments 17
2.2.2 Implementation 18
2.2.3 Interpreting the Results 19
2.3 Objectives 19
2.3.1 Increase Factor Contribution 20
2.3.2 Feasible Production Levels 20
2.4 Assumptions 21
2.4.1 DEA-Efficient DMUs 21
2.4.2 Returns to Scale of VRS Frontier 22
2.4.3 Controllable inputs and Outputs 22
2.4.4 Encouragement of Individual Inputs and Outputs 22
2.5 Methodology 22
2.6 Validity 23
2.7 By-Product 23
2.8 Conclusion 24
Chapter Three
The Evolution of Incorporating Value Judgments
in Data Envelopment Analysis 25
3.1 Introduction 25
3.2 Value Judgments in DEA: Motivation and Purpose 26
3.3 Incorporating Value Judgments in DEA 30
3.3.1 Extending the DEA-Frontier 31
3.3.2 Direct Restrictions on the Input Output Weights 33
3.3.2.1 Estimating the Parameters 36
3.3.3 Restricting the Virtual Inputs and Outputs 39
3.3.4 Linking Weights Restrictions and Extending the Observed Frontier 40
3.3.5 Adjusting the Observed Input Output Levels 42
3.4 Interpreting the Results From a DEA Assessment
With Value Judgements Incorporated 45
3.4.1 The Efficiency Score 45
3.4.2 The Radial Targets 46
3.4.3 The Peers 46
3.5 Conclusion 47
Section B - An Alternative Perspective for Incorporating Values in DEA
Chapter Four
Simulating Weights Restrictions by Means
of Radial DMUs: CRS Case 49
4.1 Introduction 49
4.2 Simulating Relative Output Weights Restrictions
by Means of Radial DMUs 51
4.3 Simulating Relative and Linked-Dependent
Weights Restrictions by Means of Radial DMUs 55
4.3.1 Specifying a Full Set of Radial DMUs 55
4.3.2 Specifying a Reduced Set of Radial DMUs 58
4.4 Simulating Absolute and Virtual Weights Restrictions
by Means of Radial DMUs 60
82 82 84 86 87 89 90 Step (iii) 94 Step (iv) 97 98 99 100 101 102 109 6.1 6.2 6.2.1 6.2.2 6.3 6.4 6.5 6.6 6.6.1 6.6.2 6.7 6.8 6.9 6.10 7.1 7.2 7.3 7.4 7.4.1 7.4.2 7.4.3 7.5 121 Negative Relative 123
124 125 Chapter Five
Why Express Value Judgments Via UDMUs? 65
5.1 Introduction 65
5.2 Interpreting the Results 66
5.2.1 Feasibility of the Extended Production Possibility Set 67
5.2.2 A Meaningful Relative Measure 70
5.2.3 Targets and Peers 71
5.3 The Combined Use of Weights Restrictions and RDMUs 74
5.3.1 Introducing Local Value Judgments 74
5.3.2 Introducing Varying Local Value Judgments 77
5.4 Conclusion 80
Section C - Improved Envelopment Via UDMUs Chapter Six
Incorporating Values and Improving Envelopment Via UDMU5: CRS Case
Introduction
Incorporating Values & Improving Envelopment by Means of UDMUs: an Outline
Encouraging the Non-s Weighting of an Individual Output Encouraging the Non-E Weighting of an Individual Input Assessing Envelopment: Step (i)
Identifying Anchor DMUs: Step (ii)
Which Inputs andlor Output Levels of an ADMU to Adjust? Constructing Suitable Estimates for DEA-Efficient UDMUs: Encouraging the Non-s Weighting of an Individual Output Encouraging the Non- g Weighting of an Individual Input Implementation: Step (v)
Incorporating Values & Improving Envelopment by Means of UDMUs: A Summary
An Application of the Use of UDMUs to Incorporate Values and Improve Envelopment in DEA
Conclusion
Chapter Seven
Data Envelopment Analysis Under Variable Returns to Scale With and Without Values Introduction
The Variable Returns to Scale DEA Model Simulating Weights Restrictions for DMUs Possible Problematic Outcomes
DMU Dependent Implicit Extensions of the PPS: Absolute Restrictions
Negative Relative Efficiency Ratings Leading to Efficiency Scores
Chapter Eight
Incorporating Values and Improving
Envelopment Via UDMUs: VRS Case 126
8.1 Introduction 126
8.2 Incorporating Values & Improving Envelopment
by Means of UDMUs: An Outline 128
8.2.1 input Minimisation: Encouraging the non-c weighting of an output 129 8.2.2 Output Maximisation: Encouraging the non-c weighting of an input 130
8.3 Assessing Envelopment: Step (i) 131
8.4 Identifying the ADMUs: Step (ii)
8.5 Which Input and/or Output Levels of an ADMIJ to Adjust?: Step (iii) 133 8.6 How to Construct Estimates for DEA-Efficient UDMUs?: Step (iv) 135
8.7 Implementation: Step (v) 138
8.8 Incorporating Values & Improving Envelopment Via UDMUs:
A Summary 139
8.9 An Application of the Use of UDMUs to Capture
Value Judgments and Improve Envelopment in DEA 140
8.10 Conclusion 146
Chapter Nine
Summary, Conclusions and Further Explorations 147
9.1 Summary 147
9.2 Conclusions 149
157 157 160 162 164 166 169 169 171 178 192 193 194 194 196 198 199 199 201 207 208 210
Appendices
Appendix 4 Appendix 4.1 Appendix 4.2 Appendix 4.3 Appendix 4.4 Appendix 4.5 Appendix 6 Appendix 6.1 Appendix 6.2 Appendix 6.3 Appendix 6.4 Appendix 6.5Appendix 7
Appendix 7.2 Appendix 7.3 Appendix 7.4 Appendix 8 Appendix 8.1 Appendix 8.2 Appendix 8.3 Appendix 8.4 References
Simulating Relative Output Weights Restrictions: A Specific Example
Proof of Theorem 4.1 Proof of Theorem 4.2 Proof of Theorem 4.3
Linear and Non- Linear Programming Equivalencies
Identifying Anchor DMUs Proof of Theorem 6.1
The Input Output Levels of the 668 Bank Branches
The Input Output Levels that Need Adjusting for Each Anchor Branch in Order to Construct at Least one Unobserved Branch The 48 Unobserved Branches Used to Improve Envelopment
Proof of Theorem 7.1: The Input Minimisation Case Proof of Theorem 7.2: The Input Minimisation Case Proof of Negative Efficiency Ratings
Tables
Chapter One
Table 1.1 Example Data Set 1 9
Chapter Four
Table 4.1 Example Data Set 2 52
Chapter Six
Table 6.1 Example Data Set 3 87
Table 6.2 The Inputs and Outputs Used to Assess the 668 Bank Branches 102
Table 6.3 Results of Step (iii) for Branch D150 106
Table 6.4 The Basis for the Construction of the Unobserved
Branches Based on Branch Dl 50 106
Table 6.5 Observed Maximum Input Levels and Mininrnm Output Levels
Table 6.6 Input Output Levels of the Unobserved Branches Based on D150 107
Chapter Seven
Table 7.1 How to Identify Returns to Scale of DEA-Efficient DMUs 112
Table 7.2 Example Data Set 4 114
Chapter Eight
Table 8.1 Basic Guidelines for the Construction of the UDMUs in Terms of
Appropriate Returns to Scale 138
Table 8.2 The Inputs and Outputs Used to Assess the 668 Bank Branches 141
Table 8.3 Results of Step (iii) for Branch D586 143
Table 8.4 The Basis for the Construction of the Unobserved
Branches Based on Branch D586 143
Table 8.5 Unobserved Branches Based on a Reduction in the
Number of Saving Accounts (SV) Held at D586 144
Chapter Nine
Figure 5.1 Figure 5.2 Figure 5.3 Figure 5.4 Figure 5.5
Figures
Chapter OneFigure 1.1 Data Envelopment Analysis: The Approach 3
Figure 1.2 The Production Possibility Set 9
Figure 1.3 Radial Target Setting for Inefficient DMUs 11
Figure 1.4 Overview of the General Process 13
Chapter Two
Figure 2.1 DEA and Value Judgments 24
Chapter Three
Figure 3.1 Current Approaches for Incorporating Value Judgments in DEA 30 Figure 3.2 Extending the Production Possibility Set 32 Figure 3.3 The Extended Production Possibility Set 41
Chapter Four
Figure 4.1 Extended Production Possibility Set 53
Chapter Five
Extended Production Possibility Set and the Theoretical Production Set
Interpretation of the Targets and Peers Extended Production Possibility Set Production Possibility Set
Introducing Varying Values
69 73 75 77 79 Chapter Six
Figure 6.1 Extended Production Possibility Set 86
Figure 6.2 Extended Production Possibility Set 88
Figure 6.3 Identifying 109 as an ADMU 92
Figure 6.4 The Super Efficiency of 112 93
Figure 6.5 Identifying Which Input Output Levels of 109 to Adjust 96 Figure 6.6 Number of Weighted Input and Output Variables
Per Branch in (M6.1) 104
Figure 6.7 Number of Weighted Input and Output Variables Per
Chapter Seven
Figure 7.1 Production Possibility Set 113
Figure 7.2 Variable Returns of the Production Possibility Frontier 115
Figure 7.3 Extended Production Possibility Set 119
Figure 7.4 Absolute Restrictions Under VRS 121
Figure 7.5 Extended Production Possibility Set 122
Chapter Eight
Figure 8.1 Extended Production Possibility Set 129
Figure 8.2 The Nature of the Returns to Scale of the DEA Frontier 137 Figure 8.3 The Number of c Weighted Inputs and/or Output Per
DEA-Inefficient Branch in (M7. 1) 142
Figure 8.4 The Number of c Weighted Factors Per DEA-Inefficient
Branch in (M7.1) with an Extended Data Set 145
Chapter Nine
Figure 9.1 The Research Process of this Thesis 156
Appendix 4
relative efficiencies of a set of Decision Making Units (DMUs). Each DMU uses the same set of inputs in differing amounts to produce the same set of outputs in differing quantities. Weights are freely allocated in order to allow these multiple incommensurate inputs and outputs to be reduced to a single measure of input and a single measure of output. A relative efficiency score of a DMU under Constant Returns to Scale is given by maximising the sum of its weighted outputs to the sum of its weighted inputs, such that this ratio can not exceed I for any DMU; with the weights derived from the model being taken to represent the value attributed to the inputs and outputs of the assessment.
It is well known in DEA that this free allocation of weights can lead to several problems in the analysis. Firstly inputs and outputs can be virtually ignored in the assessment; secondly any relative relationships between the inputs or outputs can be ignored, and thirdly any relationships between the inputs and outputs can be violated. To avoid/overcome these problems, the Decision Maker's (DM) value judgments are incorporated into the assessment. At present there is one main avenue for the inclusion of values, that of weights restrictions, whereby the size of the weights are explicitly restricted. Thus to include the relative value of the inputs or outputs, the relative value of the weights for these related inputs or outputs are restricted. The popularity of this approach is mainly due to its simplicity and ease of use.
The aim of this thesis is, therefore, firstly, to demonstrate that, although the weights restrictions approach is appropriate for many DMs, for a variety of reasons some DMs, may prefer an alternative form for the expression of their values, e.g. so that they can include local values in the assessment. With this in mind, the second aim of this thesis is to present a possible alternative approach for the DMs to incorporate their values in a DEA assessment and, thirdly, it aims to utilise this alternative approach to improve envelopment. This alternative approach was derived by considering the basic concept of DEA, which is that it relies solely on observed data to form the Production Possibility Set (PPS), and then uses the frontier of this PPS to derive a relative efficiency score for each DMU. It could be perceived, therefore, that the reason for DMUs receiving inappropriate relative efficiency scores is due to the lack of suitable DEA-efficient comparator DMIUs. Thus, the proposed approach attempts to estimate suitable input output levels for these missing DEA-efficient comparator DMUs, i.e. Unobserved DMUs. These Unobserved DMUs are based on the manipulation of observed input output levels of specific DEA-efficient DMUs.
The aim of the use of these Unobserved DMUs is to improve envelopment, and the specific DEA-efficient DMTJs that are selected as a basis for the Unobserved DMILTs are those that delineate the DEA-efficient frontier from the DEA-inefficient frontier. So, the proposed approach attempts to extend the observed PPS, while assuming that the values of the observed DEA-efficient DMIJs are in line with the perceived views of the DM.
The approach was successfully applied to a set of UK bank branches. To illustrate that no approach is all-purpose, and that each has its strengths and weaknesses and, therefore, its own areas of application, a brief comparison is made between the approach of weights restrictions and the approach proposed in this thesis.
Thanassoulis, E. and A1len R., Simulating Weights Restrictions in Data Envelopment Analysis by Means of Unobserved DMUs. Forthcoming in
Management Science.
2. Allen, R., Athanassoupolos, A., Dyson, R.D. and Thanassoulis, E., Weights Restrictions and Value Judgments in Data Envelopment Analysis: The
Evolution, Development and Future Directions. Forthcoming in Annals of
Operational Research.
3. Allen R. and Thanassoulis E., Improving Envelopment iii i)EA. Under review for publication in Journal of The Operational Research Society.
Papers Presented at Conference
I. Productivity Workshop - Athens, Georgia, USA - October 1994
2. Young O.R. Forum - Warwick Business School, Warwick University - March 1995
3. Young O.R. Conference - York University - March 1996
4. IFORS - Vancouver, Canada - July 1996
5. National O.R. Conference - Warwick University - September 1996
Abbreviations ABC: ADMU: AWR: CEA: CFA: CRS: DEA: DM: DMU: DRS: EPPS: FSRD: lM: IRDMU: IRS: LWR: MPSS: MRS: MRT: OM: ORDMU PPS: RDMU: RSRD: RWR: SDMU: SE: UDMU: VRS: WR: Sets of DMUs
AJP0 JE JE0 JF JFI JFIN JFO JFON JIN
Activity Based Costing Anchor Decision Making Unit Absolute Weights Restriction Controlled Envelopment Analysis Constrained Facet Analysis Constant Returns to Scale Data Envelopment Analysis Decision Maker
Decision Making unit [Observed only] Decreasing Returns to Scale
Extended Production Possibility Set Full Set of Radial DMUs
Input Minimisation Input Radial DMU
Increasing Returns to Scale
Linked-Dependent Weights Restriction Most Productive Scale Size
Marginal Rate of Substitution Marginal Rate of Transformation Output Maximisation
Output Radial DMU Production Possibility Set Radial DMU
Reduced Set of Radial DMUs Relative Weights Restriction Scaled DMU
Super Efficiency
Unobserved Decision Making Unit Variable Returns to Scale
Weights Restriction
Set of Referent DMUs to ADMUj 0 under SE
Set of DEA-efficient DMUs
Set of DEA-efficient DMUs excluding]0
Set of Class F DMUs under CRS Set of Class F DMUs under IM VRS
Definitions
Th.i secjpn will define, ui very simple terms, some general terminology that will be used in this.thesis. The tecinology is defined for use in this thesis only.
Absolute Weights Restrictions (AWRs): Restrictions on the actual numerical value
of the DEA weights.
Constant Returns to Scale (CRS): Under efficient input to output transformations,
scaling the input levels by a leads to a scaling of the output levels by 13 , such that a - 13.
Data Envelopment Analysis (DEA): A linear programming technique for
determining the relative efficiency score of a set of DMUs
DEA-Efficient (Pareto-Koopmans): A DMU is DEA-efficient if no other DMU or
linear combination of DMIIJs provide evidence that some of the inputs or outputs of assessed DMU could have been improved without deterioration to some of its other inputs or outputs.
Decision Maker (DM): The person responsible for the efficiency assessment.
Decision Making Units (DMU5): Organisational units that perform the same function
and use the same set of inputs to produce the same set of outputs. e.g. Banks, Schools.
Decreasing Returns to Scale: Under efficient input to output transformations,
scaling the input levels by a leads to a scaling of the output levels by 13, such that a> 13.
Extended Production Possibility Set (EPPS): The extension and possible
modification of the observed PPS, through the use of UDMUs.
Increasing Returns to Scale: Under efficient input to output transformations, scaling
the input levels by a leads to a scaling of the output levels by 13, such that
a
< 13.Input Minimisation (IM): Is a DMU consuming the minimum amount of input to
produce its output relative to the other DMUs in the assessment?
Linked-Dependent Weights Restrictions (LWRs): Restrictions on the size of
input weights relative to the size of output weights, reflecting the relationship between the inputs and outputs.
Output Maximisation (OM): Is a DMU producing the maximum amount of output
from its input levels, relative to the other DMUs in the assessment?
Peers: The DEA-efficient DMUs that are used as a basis for the DEA-efficient input
output levels a DMU could attain.
Production Possibility Set (PPS): This set contains all the obtainable input output
Radial Efficiency: The radial distance of a DMU from the frontier of the PPS.
Relative Efficiency Score: A summary of the measure of the distance between the actual and efficient input output levels of a DMU.
Relative Weights Restrictions (RWR5): Restrictions imposed on the relative size that either input or output weights can take relative to other input or output weights respectively.
Scale Efficiency: A measure of how much of a DMU's inefficiency is solely attributable to its scale of operation.
Slack: The additional improvement required for a DMU to become DEA-efficient (increase in outputs, decrease in inputs), after the radial efficiency of a DMU has been assessed.
Super Efficiency (SE): The relative efficiency score of a DMTJ relative to the other DMUs in the assessment, excluding itself
Targets: The input output levels that would render a DMU DEA-efficient.
Technical Efficiency: A measure of efficiency that ignores the effect of scale size of a DMIJ. That is, a DMU's efficiency is only compared relative to DMIJs of a similar scale. Variable Returns to Scale (VRS): Efficient input to output transformations that do not necessarily follow CRS, i.e. can be IRS, CRS or DRS.
Virtual Weights Restrictions (VWRs): Restrictions on the percentage that an input or output can contribute to the sum of the weighted inputs or outputs respectively.
Classes of DMUs
E: that cannot be expressed as linear combinations of other DEA-efficient DMUs.
E': efficient DMUs that can be expressed as linear combinations of other DEA-efficient DMUs.
F: Radially efficient DMUs but DEA-inefficient, due to the presence of slack values. That is, they can be expressed as a linear combination of other DEA-efficient DMUs plus or minus a slack value.
Overview of the Research Area
of this Thesis
This section covers chapters one to three and is a general introduction to the research area of this thesis. It discusses the general concepts of Data Envelopment Analysis, explains how a relative efficiency score is obtained, and outlines other information provided by the procedure.
More specifically, the need for the inclusion of the DM's value in a DEA assessment, and the current procedures for incorporating values in a DEA assessment are discussed, and their interconnections explored.
Introduction
1.1 Introduction
Two fundamental approaches exist for obtaining measures of efficiency, with each
approach having numerous methods. These two main approaches are; parametric and
non-parametric. The parametric approaches require a priori assumptions to be made with
regard to the production function (see Fare and Primont [29] p.8 for a formal definition) -these types of approaches will not be considered in this thesis. In the non-parametric approaches no assumptions are necessary with respect to the production function. One such approach is Data Envelopment Analysis (DEA) which uses observed data to cstumite an efficiency frontier. This is the broad subject area of this thesis. Thus, throughout this thesis it will be assumed that the Decision Maker (DM) wants a measure of reLitivc efficiency, as defined by DEA.
This chapter is structured as follows: The next section outlines the general concepts of DEA m non mathematical terms; section three mathematically details DEA section four graphically illustrates the approach and section five details the other information provided
byDEA.
1.2 Data Envelo pment Analysis: The Approach
DEA is a mathematical programming technique that is applied to a group of Decision
Making Units (DMUs) which are organisational units that perform the same task, Le.
bank branches or sales people, each having the same multiple incommensurate inputs and
outputs. The initial step in the assessment is to determine a set of relevant inputs and outputs (factors). These factors may be qualitative (weather or location), provided a value
can be given to them, or quantitative (number of employees or amount of produce) and
should be such that it is desired to minimise input levels and maximise output levels. If large numbers of factors are used in the analysis, the method's ability to distinguish between the relatively efficient and inefficient DMUs decreases. Therefore, only the most important factors should be included, see Golany and Roll [33]. DEA can now be applied
and outputs. These multiple inputs and outputs are reduced to a single input value and a single output value by the allocation of a weight to each input and output, with the only restriction on the weights being that they must be strictly positive. The DMUs' weights are calculated by comparing their observed input output levels to the observed input output levels of all the other DMUs in the assessment, in order to show the DMU in the
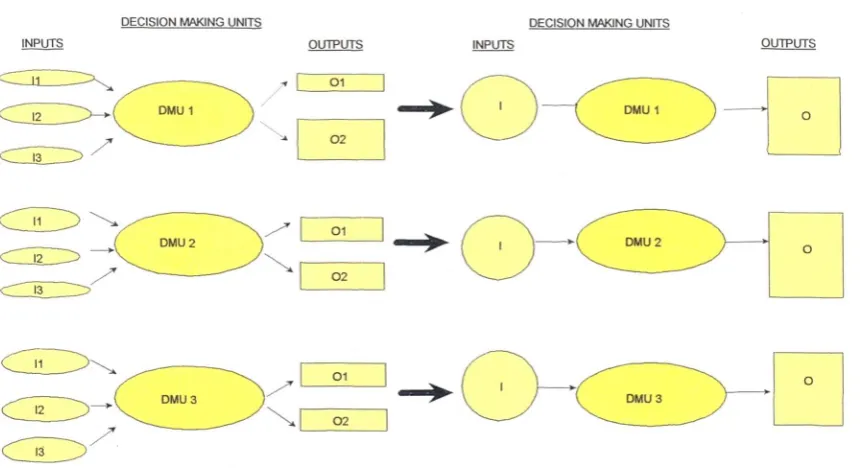
[image:20.595.81.512.398.632.2]"best possible light" compared to all the other DMUs in the assessment. Finally, a measure of relative efficiency is produced as a ratio of the sum of its weighted outputs to the sum of its weighted inputs. For example, in Figure 1.1 a set of 3 DMUs are to be assessed, each consuming varying amounts of three different inputs to produce varying amounts of two different outputs. Through the free allocation of weights to these three inputs and two outputs, they can be reduced to a single value to represent the amount of input used to produce its output relative to the other DMUs in the data set.
Figure 1.1 - Data Envelopment Analysis: The Approach
DECISION MAKING UNITS DECISION MAKING UNITS
i!Efli OUTPUTS !EWi_S QUTPI5S
D [02
0 -KiD
H
III'
____01_____
KIEiIIIx
r-cii___01 __
• Output Maximisation (OM) - Is the DMU producing the maximum
amount of output from its input levels, relative to the other DMUs
in the assessment?
• Input Minimisation (IM) - Is the DMU consuming the minimum
amount of input to produce its output, relative to the other DMUs
in the assessment?
Once the orientation of the efficiency measured has been decided, the relatively efficient
DMUs which form the "production possibility set frontier" can be identified. This frontier
is formed on the assumption that there exists continual linear substitution between any pair
of inputs or outputs over the relevant range. Further, this production possibility set
frontier is the boundary for the "Production Possililit'y Set" (PPS wbicb. contains all
obtainable input and output mixes. For a formal definition of the PPS in DEA see Banker
etal. [7] p.1081.
Further, DEA not only provides a measure of efficiency, it also provides other useful
information, such as targets and peers. Thus the information provided by DEA is:
Efficiency Score: A summary measure of the distance between the
___________________ actual and efficient input output levels of a DMU.
Targets: The input output levels that would render a DMU __________________ DEA-efficient.
Peer DMUs: The DEA-efficient DMUs that are used as a basis for __________________ the stated targets of a DEA-inefficient DMU.
Having outlined the approach oIDEA, the next section will detail the actual DEA model.
1.3 The Derivation of the DEA Model
This idea of an efficiency measure based on observed data which accounted for multiple
inputs and outputs, was first introduced by Farrell [30]. However, his idea remained
undeveloped until Charnes ci a!. [16] derived a linear programming problem to measure
set of N DMU5,j=1...N, each consuming m inputs, x11, i1...m to produce s outputs, y,,
r=l ,...,s. The relative efficiency of DMU Jo is given by the DEA weights ratio models (M1.1) or (M1.2). These are labelled Input Minimisation (IM) and Output Maximisation (OM) respectively, justification for this labelling will be given later. Due to the CRS assumption the relative efficiency scores provided by the two models are the same, see Charnes eta!. [16].
(Mi.1) IriputMinimisation (M1.2) Output Maximisation
Ev,x10
= Max r=i e = Mm '
V,Xq
/1rYr,
s.t. ' ^1 J=1...N s.t. ^1 J=1...N
/rYr,
V1, /Jr ^ S ½, r V, I-Jr ^ ½, r
v and p are the variable weights attached to the inputs and outputs respectively. The relative efficiency score of DMUJ 0 is given by h in (Ml .1), with h = 1! e J in (Ml .2).
Thus, the models in the above form can be thought of as a value-based measure of relative efficiency, (see Thanassoulis [45]). These models can be easily converted to ordinary linear programming problems through a simple transformation, (Ur t/Jr, V = tV1, t 1 = Xv1x 0 ; with t>0 in (Ml .1), see Charnes eta!. [16]). Thus the relative efficiency score of
DMUj0 is given by the DEA weights model (Ml .3) or (Ml .4), which are linearisations of
(M1.3) Input Minmisation (M1.4) Output Maximisation
h = Max e = Mm v1x,1
s.t. v,x,1 = 1 S.t. 1
UrYr, - v,x,1 ^ 0 j=1...N UrYrj - vx,1 ^ 0 j=1...N
V1, Ur ^ C Vi, r V,, Ur ^ g r
v and ur are the weights attached to the inputs and outputs respectively and these are the variables of the model. Finally, C IS a non-Archimedian infinitesimal, see Charnes et a!.
[17]. In practical terms this restriction on the weights to be greater than c, still leads to the virtual zero weighting of an input or output.
From these value-based models, the importance of each input or output to the DMU's relative efficiency score can be determined. This is represented by the value of v1xj0 or
UrYrj0 , and is given the term virtual.
(Ml .5) Input Minimisation (Ml .6) Output Maximisation
In in
= Mm Go - + Sm+r = Max z 0 + + SIn+r)
s.t. 00 x,1 —2 1 x,1 —S1 =0 1 = 1...m s.t. 2,x,1 +S = x,, i1...m
,Yrj - 5m+r = r1 ,...,s Z0Yr, - -F Sm+r = 0 r1 ,...,s
2, Si, Sn,fr ^ 0 t'J, i, r 2, S, Sm±r ^ 0 t7], i, r
If 2*,,> 0, then the corresponding DMU is a peer to DMUj0, and * will be used to denote
the value of a variable at the optimal solution to the mode] in which it appears.
S1 and Srn+r represent slack variables and iS S* > or m+r > IVki kx a
value. So, if Sj > 0 or S*m+r > 0, for some I or r then the DMU either lies on or is
projected on a DEA-inefficient frontier segment. A slack in an input, 5k,> 0, represents, in that input only, an additional inefficient use of the input. A slack in an output, S*mp> ,
represents, in that output only, an additional inefficiency in the production of that output. One way of looking at why slack values are obtained is that there does not exist a relatively efficient DMU or a linear combination of efficient DMUs that have a similar operating mix to these inefficient DMUs. That is, there is a lack of similar comparator DMUs, which could be viewed as missing data, see Burgess [13]. This concept of slack values, will be illustrated graphically in the next section.
At this point it is useful to distinguish between the 'radial efficiency' and the 'DEA-efficiency' of a DMU.
• The DEA-efficiency score of DMUj0 is h, determined using model (Ml.3) or
(M1.4) or lIe in (Ml.5) or (Ml.6). A DEA-efficient DMU is considered to be
technically efficient and it must therefore satisfy the following conditions:
No positive slack values e.g. S1 =
Sm^r 0; Vl,r.
• The radial efficiency of DMU J
is the inverse of the maximum factor by which its output levels can be
raised simultaneously within the PPS, whilst its inputs are held
constant. (That is, with reference to (Ml .6) the radial efficiency is
liz0.)
is the factor by which its input levels can be lowered simultaneously
within the PPS, whilst its outputs are held constant. (That is, with
reference to (Ml .5) the radial efficiency is Oo.)
Further, efficiency can be broken down into:
• Technical efficiency: A measure of efficiency given the scale size of a DMU.
• Scale efficiency: A measure of how much of a DMU's inefficiency is soley
attributable to its scale of operation.
Since its original formulation, considerable research has been conducted and as a consequence, DEA has expanded. For a brief synopsis of the evolution and the current state-of-the-art in DEA and an up-to-date bibliography see Seiford [43].
Having discussed the CRS DEA model used to determine the relative efficiency scores of DMUs, and to aid in its explanation, the next section will illustrate the method through the use of a simple numerical example.
1.4 Data Envelopment Analysis: A Graphical Illustration
are each consuming a normalised level of input, this allows the two-dimensional
[image:26.595.126.456.244.477.2]representation of the PPS in DEA.
Table 1.1 - Example Data Set I
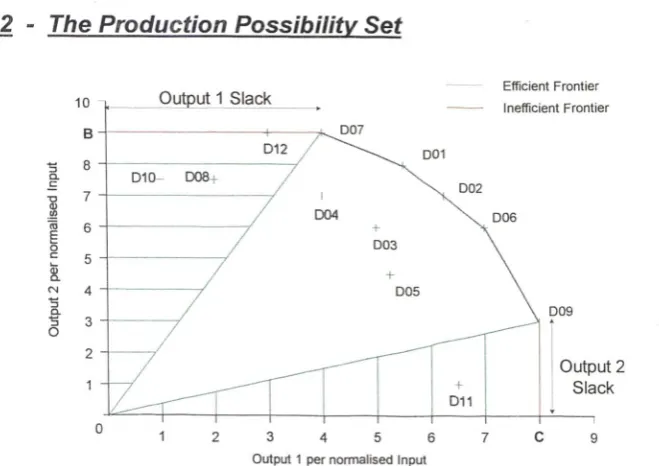
DOl D02 D03 D04 D05 D06 D07 D08 D09 D1O Dli D12 Out p ut 1 5.5 6.25 5 4 5.25 7 4 2 8 1 6.5 3 Out put 2 8 7 6 7 4.5 6 9 7.5 3 8 1 9
The PPS for DMUs DO1-D12 is plotted in Figure 1.2.
Figure 1.2 - The Production Possibility Set
io Output 1 Slack
B
D12
Di0 DO: 7
7
Efficient Frontier Inefficient Frontier
DOl D02
03
006
09 005
Output 2
-f Slack Dli
1 2 3 4 5 6 7 C 9 Output 1 per riomialised Input
The DEA-efficient frontier is defmed by DMUs D07, DOl, D06 and D09 which are
Pareto-Koopmans efficient, i.e. scale and technically efficient, see Cooper et a!. [26]. The
DEA-inefficient frontier segments are defmed by BDO7 and CDO9 and are not
Pareto-Koopmans efficient. One such DMU is D12 in Figure 1.2, which is clearly relatively
inefficient, as it is dominated by D07 and it has a positive output 1 slack value. Similarly
for DEA-inefficient DMUs that are projected onto these inefficient frontier segments, slack
values are obtained. For example, in Figure 1.2, when Dl 0 and D08 are projected onto
the frontier they both have an output 1 slack value, and similarly when Dli is projected
onto the frontier it has a slack value for output 2.
At this point, it is useful to clarify the classifications of DMUs under CRS as they will be
the DMUs under VRS is given in the literature.] Following the classification of DMUs by Chames et a!. [19], class E are those DEA-efficient DMUs that are linearly independent of other DEA-efficient DMUs. Class E' are those DEA-efficient DMUs that can be expressed as a linear combination of other DEA-efficient DMUs. Class F are those DMUs that have a radial efficiency score of 1 but have slack values, e.g. at least one St, > 0 or S,+,.> 0 in (Ml .5) and (Ml .6). Classes NE, NE' and NF represent the classes for the DEA-inefficient DMUs and are based on their radial projections onto the DEA-frontier, i.e. if their projections on the DEA frontier are class E, E' or F respectively. For example, if a DEA-inefficient DMU is radially projected directly onto a class E DEA-efficient DMU, it will be class NE.
The DMUs in Figure 1.2 would be classed as follows: D07, DOl, D06, D09 are class E; D02 is class E'; whereas D12 is class F. The remaining DMUs are DEA-inefficient and are classed as follows: D04 and 003 are NE'; D05 is class NE and D08, D10, Dli are class NF. It is this class of DMUs that the approach in this thesis concentrates on.
Further, following the definitions in Bessent et a!. [12], those of class NE and NE' are termed as Property Enveloped DMUs and have S1 = Sm±r 0; Vi,r in (M1.5) and (Ml .6) as required. Those DMUs of class F or NF are termed non-enveloped DMUs and have at least one S,> 0 or S*,n+r> 0 in (Ml .5) and (Ml .6). This implies they do not use all of their inputs and outputs to determine their relative efficiency score, i.e. assign at least one weight in (Ml .3) and (Ml .4). This implies that there are no DEA-efficient DMUs with similar operating mixes to the DEA-inefficient DMUs. Thus the observed data set has no efficient comparator levels for these DMUs to be measured relative to. So it is these DMUs that have relative efficiency scores that may not reflect their true efficiency and are thus the focus of the proposed procedure of section C.
performance, i.e. use as benchmarks. This additional information will be considered in the next section.
1.5 By-Product of a DEA Assessment: Peers & Targets
The targets provided for inefficient DMUs are based on the performance of DEA-efficient DMUs, their peers. Throughout this thesis, it is assumed that the targets are set based on the pre-emptive priority to radially project the DEA-inefficient DMUs onto the DEA-efficient frontier. However, other forms of target setting exist which are based on non-radial measures, see Thanassoulis and Dyson {48J. Target setting re'rès on a basic
Chapter One - Infroduction April, 97
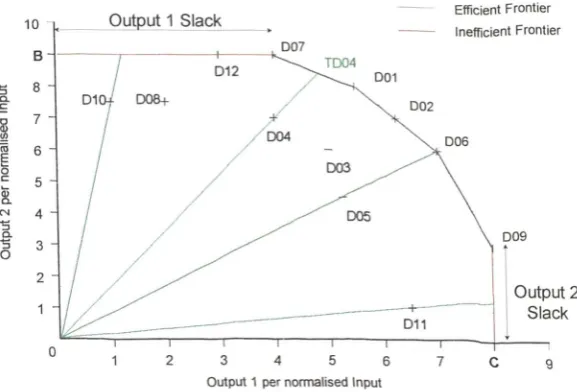
Figure 1.3 - Radial Target Setting for Inefficient DMUs
10 Output 1 Slack Efficient Frontier
B - - - 007
- Inefficient Frontier
/ D12
8 001
D10DO8+ 7-
/
ND02
/ -D04 N 006
o
E 5 /
/
I /;
Outp2
Dli Slack
0 I I
-2 3 4 5 6 7 C Output 1 per normalised Input
Figure 1.3, shows that proper]y enveloped DMUs i.e. class NE and NE' are radially projected onto a DEA-efficient frontier segment. For example, DMU D04, a properly
enveloped DMU, is projected onto TDO4, which is a linear combination of DMUs D07 and DOl. Therefore, to reach its radial target, DMU 004 has to increase both its output levels in equal proportions, and thus maintains its current operating mix. Unfortunately, this is not true if the DMU is non-enveloped, i.e. class NF or F, their targets are not based solely on radial increases/decreases to their inputs/outputs, e.g. DMU Dl 0. For these DMUs there is also a suggestion for the DMUs to change their operating process, in order to attain efficiency. This applies to DMUs Dl 2 in Figure 1.3, as DEA suggests the input output levels of D07 as its targets. So for DMU 012 to obtain its target it needs only to increase output 1. Thus, it will have to put more emphasis on producing output I, while maintaining its present level of output 2. This will require Dl 2 to alter its present operating mix.
Chapter One - Introduction 97
Having outlined the basic principles of DEA and the information provided by the analysis, a summary of the approach is now offered.
1.6 Conclusion
DEA is a linear programming technique for assessing the relative efficiency of a set of DMUs, such as schools and bank branches. Each DMU operates its production process differently but consumes the same set of inputs to produce the same set of outputs. The relative efficiency score is obtained by the free allocation of weights to a set of inputs and outputs, with a DEA-efficient frontier being defined by the observed input output )eve)s of
the DMUs. As a by-product of the analysis, inefficient DMUs are VerecX racaX tac'g,ets and peers, which they might use as benchmarks to improve their performance.
This introductory chapter has outlined the DEA approach for measuring the relative efficiency of DMUs which has grown in popularity since its initial formulation by Charnes
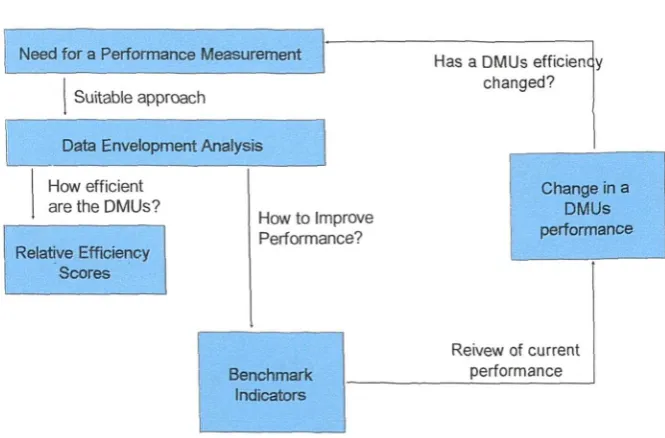
[image:30.595.81.414.492.711.2]et al. [16], with the original concept for the need for some form of measure for relative efficiency by Farrell [30]. Figure 1.4 summaries the general process.
Figure 1.4 - Overview of the General Process
NeedforaPerforrnanceMeasuremJ Has a DMUs efficien y changed? Suitable approach
Data Envelopment Analysis
How efficient Change in a are the DMUs? DMUs
How to Improve
r Performance? performance Relative Efficiency
Scores
Reivew of current Benchmark performance
Indicators
New\
Concepts
Why Read This Thesis?
Defining
concepts
Motivation
Aims
,>/iustifYin
-
concepts
2.1 Introduction
This introduction will detail the general motivating reasons for the inclusion of value judgments in DEA assessments. These reasons will be discussed in greater detail in the
next chapter see also Allen et al. [4].
As detailed in chapter one, DEA treats the observed input and output levels as fixed. Thus the DEA model assigns variable weights to these factors, which are then interpreted as the value attributed to the inputs and outputs. So, an assessed DMU is freely allowed to allocate the weights, in order to show the DMU 'in the best possible light'.
It should be noted that the DEA model oniy considers the quantity of the inputs and outputs and does not take into account the value of the inputs and outputs; thus, inappropriate estimates of efficiency may be obtained. There are severaX reasons for ciis.
• Non weighting of the inputs and/or outputs
DMUs can attribute low weights (E, which in practical terms is virtually zero) to their relatively low levels of output and their relatively high levels of input, so that they are effectively ignored in the assessment. Xn extreme tc tth. re(ative efficiency scores based on the ratio of a single weighted output to a single weighted input.
•
Non reflection of the relative relationships between inputs or outputsDMUs can assign weights to their inputs or outputs in a counter-intuitive manner, that is,
ignoring accepted views about the value of the different inputs or outputs. For example, in the assessment of a set of police forces, the solution of a burglary crime appears to be valued more than that of a violent crime by some forces, see Thanassoulis [44].
Further, the weights can be used to estimate marginal rates of substitutionitransformations (see Charnes et al. [16]). However, with the virtual zero weighting of an input or output this means that these marginal rates cannot be defined.
•
Non reflection of dependent relationships between the inputs and outputsin some manner. For example, see Thanassoulis et a!. [47], where in their assessment of
perinatal care units, one of the outputs, 'survivals' was directly dependent on an input, 'babies at risk'. Thus it was felt that the weights assigned to these factors should be linked in some way.
In general, to overcome the problem of inappropriate efficiency estimates, the DM's value judgments on the inputs and outputs are incorporated into the analysis. As the term value judgments will be used throughout the thesis, there is a need to define the term:
"logical constructs expressed as the DM's opinions on the
production process under analysis"
Thus, value judgments are DM specific and essentially they begin with the selection of the input output variables. For example, variables that are omitted from the assessment are implicitly given zero weight, see Golany and Roll [33]. However, this is not the type of value judgments that are to be considered in this thesis. The value judgments that are to
be considered in this thesis affect the selection of the optimal set of weights for the inputs and outputs when assessing a DMU's relative efficiency. Hence, it could be said that they are the type of values that are incorporated into the analysis in order to obtain a better picture of the DMLJ's overall relative efficiency. Further, this thesis is concerned with the inclusion of qualitative information on quantitative factors, rather that the actual inclusion of qualitative factors, see Cook eta!. [23].
Thus, the need for the inclusion of value judgments in a DEA assessment has been established. The next section outlines why there is a need for an alternative approach to those methods available at present.
2.2 Motivation
also Allen et al. [41 . However, there is one primary approach for incorporating value judgments into a DEA assessment, and that is, Weights Restrictions (WRs), which explicitly restrict the DEA weights, Ur or v, in models (Ml .3) or (Ml .4) of chapter one.
The following are observations from this approach that motivated the need for an alternative approach for the incorporation of value judgments in a DEA assessment, which prompted the production of this thesis.
2.2.1 Specification of the Value Judgments
In order to implement weights restrictions, the DM is required to specify information on their values. The format of this information depends on the type of imposed restriction, but the three main forms of expression are:
• Numerical bound values e.g. lower or upper bounds
These can be either the direct or indirect restriction of the contribution of the inputs and/or outputs to the relative efficiency score. In general, there is a lack of objectivity in the setting of numerical bound values, see Roll et al. [41]. This is mainly due to the fact that in general the actual numerical weight value holds no real meaning, except in specific applications, see Dyson and Thanassoulis [271. Thus there is a need for an objective approach to ensure that all inputs and outputs contribute to the relative efficiency score, i.e. no input or output is assigned an s weight.
• Relative restrictions e.g. marginal rates of substitution
In order to incorporate the relative relationships between inputs or outputs, an explicit definition of the relationship has to be made. Thus, the DM is required to specify global relative relationships between the related inputs or outputs.
production process involves services and the interpretation of the weights as marginal rates holds little meaning. For example, in the assessment of a set of bank branches the outputs may include the number of mortgage applications and the number of counter transactions.
In this case, the first output (the number of mortgage applications) is clearly of higher value to the branch. The question then is how to determine the value of this output relative to that of the second output (the number of counter transactions)? Hence an approach that allows the DM an alternative expression for these relationships and for the inclusion of local values would be desirable.
• Linked-dependent restrictions
These are restrictions that link the size of the input weight to the size of the output weight. Once again, this type of restriction requires the explicit definition of the relationship between the inputs and outputs at a global level, which in certain applications may not be appropriate or easy for the DM to defme. This is particularly true in a Variable Returns to Scale (VRS) assessment, where the relationship between the inputs and outputs by definition is allowed to vary. Thus there is a need for an approach that a((ows for the inclusion of local values that apply only to specific operating mixes within the PPS.
This section has briefly highlighted, that for some DMs or certain applications, the specification of their value judgments in the form of weights restrictions may prove to be difficult or inappropriate. Therefore, there is a need to offer the DM an alternative form of
expression for their value judgments and an approach that allows for the inclusion of local values for applications where the limitation of weights restrictions to the inclusion of global values may be restrictive, i.e. in Variable Returns to Scale (VRS) applications.
2.2.2 Implementation
the use of weights restrictions in a VRS DEA assessment. Hence the need for an alternative approach that avoids this problem.
2.2.3 Interpreting the ResuRs
It is known that the incorporation of value judgments in a DEA assessment alters the PPS, see Roll and Golany [42]. However, under weights restrictions, this alteration is only implicit and the explicit input output levels of the altered PPS are not known. Therefore, is it reasonable to interpret the obtained results as relative efficiency scores? Further, at present, targets are based on observed standards and do not truly reflect the thpur ocpuc
levels that the DMUs are measured relative to. Thus, to aid the DM in their interpretation of the results and for the setting of objective targets, there is a need for an exp\ict
expression of the value judgments in terms of the inputs and outputs of the assessment.
Having identified the main areas of motivation, the next section will outline the main objectives that this thesis aims to achieve.
2.3 Objectives
of several values, either a marginal rate of substitution, a marginal rate of transformation or a minimal/maximal weight value.
Finally, section C uses this alternative approach to concentrate on the following main objectives.
2.3.1 Increase Factor Contribution
As noted earlier, in a DEA assessment under free weights it is frequently found that many of the incorporated inputs and outputs do not contribute towards the relative efficiency scores of DEA-inefficient DMUs. That is, although they are thought sufficiently important to be included in the analysis, in the actual assessment of relative efficiency they are not given any value by some inefficient DMUs. This can be viewed as a lack of DEA-efficient comparator DMUs for the inDEA-efficient DMU, i.e. the DEA-DEA-efficient DMUs are of a dissimilar operating mix to the DEA-inefficient DMUs. Thus, the approach for including value judgments in this thesis is to provide estimates of DEA-efficient UDMUs with similar input output operating mixes to the DEA-inefficient DMUs, which at present have no observed comparator DEA-efficient DMUs.
2.3.2 Feasible Production Levels
It has been noted that the introduction of values in a DEA assessment leads to the PPS being extended, see Roll and Golany [42] and Dyson et al. [28]. The approach proposed
2.3.3 Varying Local Value Judgments
As mentioned earlier, incorporating value judgments via weights restrictions only allows for the introduction of global values. Thus it is assumed that the values hold universally for all the DMUs in that data set, regardless of their operating mix and their priorities in relation to the involved inputs/outputs. The inclusion of global values may be appropriate in some applications, such as Dyson and Thanassoulis [27, where the weights have a meaning universally. However, this may not always be the case, and DMUs with different
operating processes may place different values on the different inputs/outputs and the relationships between them. This is particularly important in the case where the DMUs operate under Variable Returns to Scale (VRS). Thus the approach of UDMUs provides the DM with a means for incorporating varying local value judgments into the assessment.
These are the three main objectives of this thesis. The assumptions that are made for this approach are now stated.
2.4 Assumptions
The following assumptions have been made in the proposed approach of section C.
2.4.1 DEA-Efficient DMUs
2.4.2 Returns to Scale of VRS Frontier
The proposed approach does not set out to explicitly alter the observed returns to scale of the observed DEA frontier. It simply attempts to extend it in an appropriate manner.
2.4.3 Controllable Inputs and Outputs
It is assumed that all the inputs and outputs in the DEA assessment are controllable. That is the DM is able to manipulate the input output levels of the DEA-efficient DMUs in order to derive UDMUs.
2.4.4 Encouragement of Individual Inputs and Outputs
The approach is aimed at encouraging individual inputs and outputs to contribute to the relative efficiency score of DEA-inefficient DMUs, rather than attempting to simultaneously encourage multiple inputs and outputs to contribute to a DEA-inefficient DMU's relative efficiency score. Therefore, if a DEA-inefficient DMUs virtually ignores
several inputs and outputs in its initial assessment, full envelopment for these D'MV s may not be attained.
One outstanding issue now remains - how is the approach of UDMUs determined suitable for expressing the DM's value judgments in a DEA assessment?
2.5 Methodology
Turning to the issue of how the approach was derived, it was noted earlier that Roll and Golany[42] demonstrate that the inclusion of an absolute weights restrictions in a DEA assessment leads to an implicit modification of the PPS. Similarly, Dyson et a!. [28] note
"the inclusion of value judgments in the form of weights restrictions
implicitly alter the PPS"
led to an alternative perspective of the problem for the inclusion of values in a DEA assessment, i.e. that of missing suitable comparator DEA-efficient DMUs.
Hence the development of the approach presented in this thesis, which constructs suitable estimates for these missing comparator DEA-efficient DMUs. These suitable estimates are constructed from the observed DEA-efficient DMUs and the DM's values judgments.
2.6 Validity
In order to demonstrate that the proposed approach is a valid one, the theoretical differences between the proposed approach and weights restrictions are highlighted in the concluding chapter, demonstrating that neither approach is all-purpose, and that each has its strengths and weaknesses and, thus, its own individual areas of application. In terms of the usage of this approach, it is difficult to appraise, however, the proposed approach was successfully applied to a set of bank branches operating in the United Kingdom. Although no direct illustrative comparison of the application of the proposed approach and weights restrictions is offered in this thesis, a comparison of the approaches can be found in Allen
and Thanassoulis [5].
2.7 By-Product
2.8 Conc'usion
The principal motivation and aim of this thesis is to provide an alternative to weights
restrictions for the incorporation of value judgments in a DEA assessment. Value
judgments are incorporated into an assessment for three main reasons:
a) to avoid the non weighting of inputs and outputs;
b) to allow the inclusion of relative relationships between the inputs or outputs;
c) to allow the inclusion of linked-dependent relationships between the inputs
and outputs.
The approach suggested in this thesis attempts to as k cxv,
UDMUs into the observed data set.
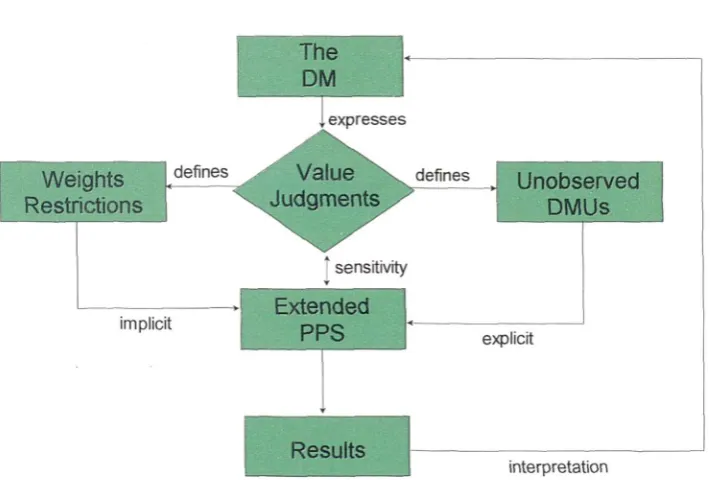
Figure 2.1 attempts to demonstrate the inter-relationship between some of the problem
[image:41.595.74.432.440.680.2]areas to be investigated.
Figure 2.1 - DEA and Value Judgments
Weights Restrictions
implicit
The
-expresses
defines Value Ndefines
Unobserved
dgments7 DMUs
sensitivity
Extended
PPS expIict
Results
terpretation
Chapter three will discuss the literature and also highlight some of the points noted in this
chapter as the motivating reasons for this thesis; although chapter five will expand these
The Evolution of Incorporating Value
Judgments in Data Envelopment Analysis
3.1 Introduction
Farrell [30] originally proposed the concept of a comparative efficiency measure
determined from observations rather than by theoretical specification of a production
function as followed by economists. This development was operationalised by Charnes et
a!. [16] who established DEA as a prominent methodological tool for assessing the relative
efficiency of DMUs. The phenomenal expansion of the method, see Seiford [43], covered
a very wide area of applications and theoretical extensions including computations, AJi and
Seiford [3] and target setting, Thanassoulis and Dyson [48].
The need to incorporate value judgments in DEA has been derived as a consequence of the growing use of DEA in the solution of real life problems. The desire to incorporate value judgments into the assessment has resulted in the development of explicit restrictions of
the DEA-weights, with reference to the DEA weights model (Ml .3) or (Ml .4) in chapter one. Currently, value judgments, generally in the form of weights restrictions, cover a considerable part of the DEA literature without however showing any signs of saturation. The aim of incorporating value judgments is to introduce prior views or information regarding the assessment of the efficiency of DMIUs. The incorporation of these opinions will have implications for the relative efficiency score of the assessed DMUs and possibly the peers and radial targets provided.
This chapter reviews the evolution of approaches for capturing value judgments in a DEA assessment and is organised as follows: The next section highlights the application driven motivation for the incorporation of value judgments into a DEA assessment. The third section details the alternative approaches for the inclusion of value judgments and are presented as they arose from the application of DEA to real problems. The fourth section discusses how the incorporation of these value judgments into the assessment affects the interpretation of the relative efficiency score, estimation of targets and the selection of peer comparators for individual DMUs.
3.2 Value Judgments in DEA: Motivation and Purpose
DEA in its purest form, Charnes et a!. [16], allows total flexibility in the selection of weights, such that each DMU will achieve the maximum efficiency score feasible for its
input and output levels.
This complete flexibility in the selection of weights is important in the identification of
inefficient DMUs, which are under-performing even with their own set of weights. As a
consequence, the management of an inefficient DMU cannot argue that they were not
informed of the importance attached by top management to certain inputs/outputs, as no
priorities over the inputs or outputs are included in the analysis.
However, the weights estimated by DEA can prove to be inconsistent with prior
knowledge or accepted views on the relative values of the inputs and outputs. For
example, in the first application of DEA, by Charnes et a!. [18] evaluating the performance of "Program Follow Through" (a system of support for under privileged children) in the
USA, an analysis of the data shows that many DMUs were rated effic)ent 1y p)athng thtii
output weight solely on "self esteem" and ignoring performance on mathematics and verbal
reasoning.
The initial development of DEA by Charnes et a!. [16] was followed by a rapid expansion of theory and applications without, however, challenging the fundamental basis of DEA
insofar as the flexibility in the selection of weights is concerned. The evolution of value
judgments (see chapter two for a definition) in the assessment of efficiency followed as a
natural by-product of real life applications, some of which are discussed later. A number
of reasons motivating the use of value judgments in DEA are discussed next.
• To increase the know'edge of the production process
When assessing the relative efficiency of U.S.A. Air Forces, Clark [21] found that due to
the lack of comparability of efficient DMUs with inefficient DMUs, a DMU's efficiency
score obtained from the Charnes et a!. [16] model may not represent a DMU's true efficiency. That is, the DMUs that were found to be relatively efficient under DEA were
DMUs are projected onto rather arbitrarily generated, artificial frontier facets of the
DEA-frontier (created by the inclusion of the c, see (Ml .3) or (Ml .4) of chapter one). In
addition, these artificially generated frontier facets do not exhibit meaningful efficient
trade-off's for the inputs and outputs. Thus to provide further insight into the
organisation's operations and the production processes of all the DMUs under analysis, the
DEA-frontier is extended using observed Marginal Rates of Substitution (MRS).
Consequently, these inefficient DMUs will use all their inputs and outputs to determine
their relative efficiency score.
• To enable discrimination between efficient units
The use of DEA by Thompson et at. [55] to support the siting of nuclear physics facilities in Texas, highlighted a problem of lack of discrimination when a small set of DMUs is
being assessed, as five out of six alternative facilities were found relatively efficient. The
discrimination of DEA was improved by defming ranges of acceptable weights, namely
assurance regions, which were then introduced to determine the preferred DEA-efficient
site.
• To incorporate prior views on the value of individual inputs and outputs
Thanassoulis et at. [49] assessing the performance of rates departments, found that the Audit Commission was concerned that some local authorities were deemed efficient due to
excessively high weights being placed on the numbers of rebates of taxes and court
summonses of recalcitrant tax payers (outputs), while more 'normal' outputs, such as tax
accounts administered, were effectively disregarded. Restrictions on the flexibility of
weights were imposed by Dyson and Thanassoulis [27] in an attempt to incorporate top
management perspectives on the relative importance of the inputs and outputs used in the
assessment.
• To reflect the values of certain inputs and/or outputs
survivals" (output). The ratio of the number of survivals to babies at risk was the actual variable to be included in the assessment, and the approach adopted allows the importance of the survival rate ratio to be varied, but not the individual components of the ratio.
In the assessment of the performance of University departments by Beasley [10] and Ahn and Seiford [1] in the U.K. and U.S.A. respectively, it was argued that the Universities with emphasis on postgraduate students should be rewarded in the assessment. Further, Ahn and Seiford [1] sought to guarantee that State funded students should be prioritised in the assessment, as the Universities rely on these students for higher grant support from the State Government.
• To incorporate prior views on efficient and inefficent OM(fs
In assessments of efficiency, management often have prior perceptiori a to vhic* of the DMUs under assessment they consider to be "good" and "poor" performers. For example, Charnes et a!. [15], in assessing the performance of banks in the U.S.A., found that "the Charnes eta!. [15] model recognised some notoriously inefficient banks as DEA-efficient". Managerial perception had to be incorporated within the assessment of efficiency in order to bring the results closer to the prior perceptions of management. This brought forward the "cone ratio" family of models, where the efficiency of banks was assessed on the basis of the input/output values of three preselected banks which were recognised as very good performers. It will be shown later that the preselection of DEA-efficient DMUs for assessing efficiency is a particular type of the cone ratio approach. Nevertheless, the preselection of DMUs for assessing efficiency is in contrast to the rates department study (Thanassoulis et a!. [49]), which was carried out to challenge perceived wisdom on efficient departments.
• To respect the economic notion of input/output substitution
As previously noted, the weights can be used to estimate MRS/MRT, see Charnes et a!.
Direct restrictions on the input and output weights
marginal rates can not be defined. This creates a problem in relating the DEA-weights with the economic literature.
The aforementioned applications have led to a number of extensions to the original DEA model of Charnes et at. [16] for incorporating value judgments in DEA assessments. The next section outlines the main theoretical developments in this area.
3.3 Incorporating Value Jud g ments in DEA
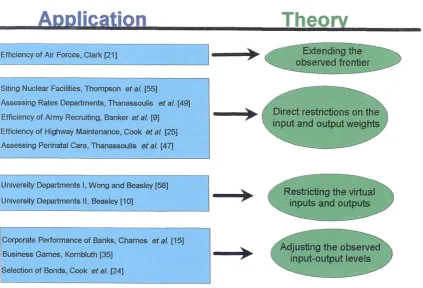
[image:47.595.81.505.355.643.2]Figure 3.1, classifies the existing methods for incorporating ra1u jdgrct ix TEA four approaches and identifies a variety of applications using each approach.
Figure 3.1 - Current Approaches for Incorporating Value Jud gments in DEA
ADDlication
Theory
Efficiency of Air Forces, Clark [21] Extending the
observed frontier
siting Nuclear Facilities, Thompson et aL [55]
Assessing Rates Departments, Thanassoulis eta!. [49]
Efficiency of Army Recruiting, Banker et aL [9]
Efficiency of Highway Maintenance, Cook et aL [25] Assessing Perinatal Care, Thanassoulis eta!. [47]
University Departrnentsl, Wong and Beasley [58]
Restricting the virtual
Jniversity Departments II, Beasley [10] inputs and outputs
-Corporate Performance of Banks, Charnes etaL [15]
Adjusting the observed
Business Games, Kornbluth [35] input-output levels /1 Selection of Bonds, Cook et aL [241 -- -
--The four broad approaches for incorporating value judgments in DEA outlined are:
• Extending the DEA-frontier
• Direct restrictions on the weights
• Adjusting the observed input-output levels
These approaches will now be detailed in turn. The discussion will be restricted to incorporating value judgments in the basic DEA model, Charnes et a!. [16], which
implicitly assumes that the DMUs being assessed operate a CRS transformation of the inputs into outputs. This is mainly due to the fact that no real discussion exists in the current literature as to how to meaningfully incorporate value judgments into a VRS DEA assessment. However, this issue will be addressed in chapters seven and eight.
3.3.1 Extending the DEA-Frontier
This approach is motivated by the desire to increase the power of DEA as a management decision making tool. It attempts to extend the DEA-frontier to provide the DM with a greater insight into the production processes of all the DMIJs in the assessment by generating artificial efficient frontier facets based on observed trade-offs for inputs and outputs. Consequently, all inefficient DMUs use all the selected inputs and outputs to determine their relative efficiency score, and the artificial efficient facets exhibit some form of meaningful efficient trade-offs for the inputs and outputs. In generating an artificial efficient facet, inefficient DMUs become quasi-enveloped DMUs as defined by Bessent et al. [12]. This term is used to define those DMUs that are partially enveloped by observed frontier segments and partially by unobserved frontier segments. This methodology was initially discussed by Clark [21] and later by Bessent et a!. [1], Olesen and Petersen [39] and Lang et a!. [38]. In addition C hang and Guh [14] and Green et a!. [31] discuss a
similar procedure that differs only in the selection of which frontier segment to extrapolate in order to improve envelopment. To demonstrate the basic concepts of this approach a simple graphical illustration will be used.
A simple example
Dl 2 and Dli are non-enveloped and following the procedure known as Constrained Facet Analysis (CFA), artificial frontier segments are introduced that extend the observed frontier facets to quasi-envelop the DMUs of class NF and F using observed MRS.
Figure 3.2 - Extending the Production Possibility Set
12 11 10
I 4 5
6 7 8 9 10 Output 1 per normalised Input
In order to quasi-envelop, DMUs, D08, D12 and D1O, the observed frontier segment of DOl D07 is implicitly extended to AD1 0, based on the assumption that the existing MRS between DOl and D07 can be extended as far as AD1 0. Similarly, the observed frontier segment of D06D09 is implicitly extended to quasi-envelop Dli.
When the methodology is applied to the multi input output case, there may exist a variety of possible frontier facets that can be extended, with different algorithms being presented by Bessent et a!. [12], Olesen and Petersen [39] and Lang et a!. [38] for the selection of the most appropriate frontier facet to extend and envelop the inefficient DMUs.