University of Warwick institutional repository: http://go.warwick.ac.uk/wrap This paper is made available online in accordance with
publisher policies. Please scroll down to view the document itself. Please refer to the repository record for this item and our policy information available from the repository home page for further information.
To see the final version of this paper please visit the publisher’s website. Access to the published version may require a subscription.
Author(s): Neil Stewart, Nick Chater and Gordon D.A. Brown Article Title: Decision by sampling
Year of publication: 2006 Link to published
Running Head: DECISION BY SAMPLING
Decision by Sampling
Neil Stewart
Nick Chater
Gordon D. A. Brown
University of Warwick, England
Tel: +44 (0) 24 7657 3127
Fax: +44 (0) 24 7652 4225
Department of Psychology
University of Warwick
Coventry
CV4 7AL
England
Stewart, N., Chater, N., & Brown, G. D. A. (2006). Decision by sampling. Cognitive
Abstract
We present a theory of decision by sampling (DbS) in which, in contrast with traditional
models, there are no underlying psychoeconomic scales. Instead, we assume that an attribute's
subjective value is constructed from a series of binary, ordinal comparisons to a sample of
attribute values drawn from memory and is its rank within the sample. We assume that the
sample reflects both the immediate distribution of attribute values from the current decision's
context and also the background, real-world distribution of attribute values. DbS accounts for
concave utility functions; losses looming larger than gains; hyperbolic temporal discounting;
and the overestimation of small probabilities and the underestimation of large probabilities.
Keywords: judgment; decision making; sampling; memory; utility; gains and losses; temporal
Decision by Sampling
Here we offer an account of why the descriptive psychoeconomic functions - concave
utility functions for money, hyperbolic temporal discounting functions, and inverse-S-shaped
subjective probability functions - take the forms that they do. The essence of our decision by
sampling (DbS) account is that attribute values (e.g., monetary amounts, probabilities, delays)
are evaluated against a sample of other attribute values using simple cognitive tools. The
decision sample is assumed to comprise both attribute values from both the immediate context
in which a decision is made (e.g., the attribute values of other options on offer) and values
from memories of previously encountered attribute values (e.g., those values encountered in
previous decisions). In this article, we focus upon the effect of previously encountered
attribute values.
Theories of decision making often take economic theory as a starting point: expected
utility theory for decision under risk; exponential discounting for decisions with delayed
outcomes. The next step is to assess the degree to which people make decisions as they should
(e.g., Allais, 1953; Kahneman & Tversky, 1979, 2000). The normative theory is then modified
to create a descriptive theory of observed behavior by including additional psychological
insight (e.g., prospect theory, Kahneman & Tversky, 1979, Tversky & Kahneman, 1992,
regret theory, Loomes & Sugden, 1982, and rank dependent utility theory, Quiggin, 1983,
1992, in decision under risk; hyperbolic discounting, Rachlin, 1989, for intertemporal choice;
support theory, Tversky & Koehler, 1994; for probability judgment). In beginning with a
limited set of simple cognitive tools we are taking psychology as a starting point. We then
consider how economic decisions might be made using these simple tools.
A key difference between the approach we develop here and those derived from
normative economic accounts is that we do not assume that people have stable, long-term
internal scales along which they represent value, probability, temporal duration, or any other
judge whether a target value is larger or smaller than these items. This approach is inspired by
and builds on a series of successful accounts of key aspects of judgment and decision making
based on psychological assumptions concerning sampling from, and comparison with, items
from memory. In norm theory (Kahneman & Miller, 1986) the normality of a stimulus is
derived by comparing it to the norm (counterfactual examples and a set of exemplars retrieved
from memory) that it evokes. In decision field theory (Busemeyer & Townsend, 1993), and its
multialternative generalization (Roe, Busemeyer, & Townsend, 2001), the time course of
decision making is accounted for by the sequential sampling of information from the decision
context, with outcome valances constructed relative to one another. In support theory
(Tversky & Koehler, 1994), the subjective probability of a focal hypothesis depends on the
sample of alternative hypotheses considered by the subject, and is given by the ratio of the
support for the focal hypothesis and the sum of the support for all hypotheses under
consideration (see Windschitl & Well's, 1998, comparison heuristic for a similar mechanism).
Dougherty, Gettys, and Oden's (1999) decision making model MINERVA-DM (based on
Hintzman's, 1984, 1988 memory model) gives a mechanism by which the support for
hypotheses depends on the similarity to traces stored in memory, providing an account of
many heuristics and biases (see also Juslin & Perrson, 2002). In the stochastic difference
model (González-Vallejo, 2002), the differences between the target attribute value and other
attribute values in the sample of items in the decision context determines the preference for
one prospect over another. In summary, in all of these models, judgments and decisions result
from comparison of an attribute's value to a sample of other values, either from the decision
context or from memory. For a review of memory processes in judgment and decision making
see Weber, Goldstein, and Barlas, (1995) and Weber & Johnson (in press).
In DbS, we assume that only the most simple cognitive processes - ordinal comparison
and frequency accumulation - are involved in evaluating a target attribute against a decision
"greater than", "equal to", or "less than") is motivated by evidence from psychophysics which
suggests that people are rather good at discriminating stimuli from one another, but rather bad
at identifying or estimating the magnitude of the same stimuli (see Garner, 1962; Miller, 1956;
Laming, 1984, 1997; Shiffrin & Nosofsky, 1994; Stewart, Brown, & Chater, in press). Our
assumption that people are good at keeping track of and manipulating frequencies is well
established (e.g., Gigerenzer & Hoffrage, 1995; see Sedlmeier & Betsch, 2002, for a recent
review). By keeping a frequency count of the number of comparison outcomes that favor the
target, one can derive the rank of the target attribute value within the decision sample (see,
e.g., Kornienko, 2004, for a demonstration that a cardinal utility function may be derived by
keeping a frequency count of binary, ordinal comparisons.) It is this rank that we assume is the
subjective value of an attribute. When normalized to lie between 0 (the worst attribute value)
and 1 (the best attribute value), the subjective value or relative rank of an attribute value is
given by r = (R - 1) / (N - 1) where R is the rank within the sample of N items. The relative
rank is effectively the proportion of attribute values in the sample that are less than the target
attribute value or, equivalently, the probability that a randomly selected attribute value will be
less than the target attribute value.
In assuming that the subjective value of an item is its rank within a sample, DbS
embodies the frequency principle of frequency theory (Parducci, 1965, 1995). In
range-frequency theory, the subjective value of an item is a weighted sum of its rank within the
immediate context and its position within the range set by the immediate context. We consider
the range principle further in the General Discussion.
So far we have said little about the sample of attribute values against which an item is
compared. The basic idea is that, when considering a target attribute value, there will typically
already be some other attribute values from the context of the decision in the sample. The
target attribute value will also evoke other values from long-term memory, and it is the effect
the subjective value of an option is constructed online whenever it is considered (cf., Bettman,
M. F. Luce, & Payne, 1998; Payne, Bettman, & Johnson, 1992; Slovic, 1995) and will vary
from occasion to occasion with (a) the distribution of attribute values from the immediate
decision context, (b) the distribution of attribute values in memory, and (c) stochasticity in the
sample of attribute values from both the immediate decision context and also from memory.
As a starting point, we assume that the contents of memory reflects the structure of the
world, and represents a subset of the attribute values that people typically encounter. There is
good evidence that memory is adaptively reflects the structure of the environment (e.g.,
Anderson, 1990; Anderson & Milson, 1989; Anderson & Schooler, 1991; Chater & Brown,
1999; Oaksford & Chater, 1998; Shepard 1987). In the following sections we will examine the
distributions of gains, losses, time delays, and probabilities that people encounter. We focus on
these attributes because they are the psychological primitives of economic decisions: Many
decisions involve evaluating the value of some risky, uncertain, or delayed gain or loss. We
will use these distributions to make predictions about the subjective value functions that will
be revealed when people make decisions in the context of these real-world distributions.
Gains
First we consider gains. Following Kahneman and Tversky (1979) we consider gains
and losses separately. Key questions are: (a) What is the distribution of gains in people's
memories? (b) What effect will this distribution have on the subjective valuation of gains?
We assume that the decision sample, to which a target gain is compared, is a small,
random sample of gains from memory. Of course this random sampling assumption is likely to
be incorrect: other factors, such as recency, similarity, and background knowledge will surely
play a role. However, in what follows we pursue this random sampling hypothesis as a first
approximation.
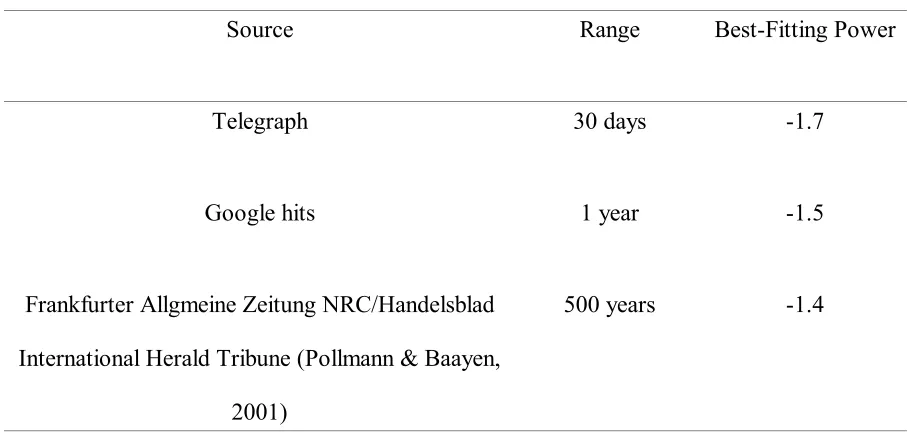
An approximation to the distribution of gains that people encounter can be revealed by
1A shows the frequency with which credits of different amounts are made. These data are a
random sample of one year of credits to current accounts held by a leading UK bank.
Automatic credits were omitted, but all manual payments including direct debits, standing
orders, and salary payments were included. The distribution of credits approximately follows a
power law, with many small gains and relatively fewer larger gains (the data roughly follow a
straight line on the plot of log frequency against log credit). The observation of this power-law
relation between event magnitude and event probability is unsurprising, as it is seen in many
aspects of the world (see Bak, 1997, for a review). For example, natural phenomena such as
earthquake energies follow this pattern (Gutenberg & Richter, 1949; Johnstone & Nava,
1985), as do social phenomena like the size of corporations (Ijiri & Simon, 1977), city sizes,
and the frequencies of words within natural language (Zipf, 1949).
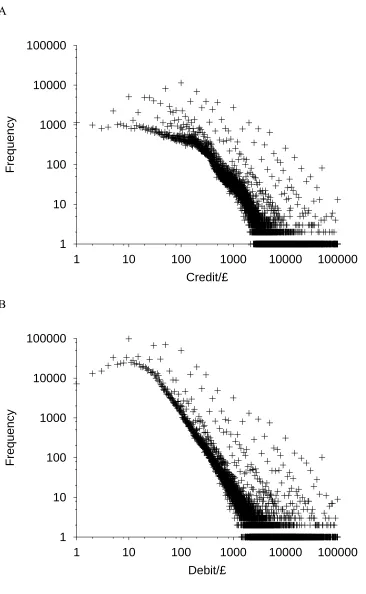
Supposing that the decision sample can contain an unlimited number of exemplars, the
subjective value of a target credit within our larger sample of credits is given by its relative
rank within this large sample. Figure 2A plots the relative rank of each credit. Because of the
equivalence between the relative rank of a target attribute value and the proportion of attribute
values that are smaller than the target, Figure 2A can also be described as a plot of the
cumulative probability of obtaining a gain at least as big as that on the abscissa.
As a direct consequence of the distribution of credits, relative rank is an increasing but
negatively accelerating function of the size of the credit. Thus, additional incremental wealth
has a diminishing impact on the relative rank of the credits. For example, a credit of £1000 has
less than twice the psychological value of a credit of £500. In summary, from only the
assumption that people make ordinal comparisons with a sample of values reflecting the
positively-skewed real-world distribution, DbS predicts that the marginal subjective value of
an extra unit of wealth diminishes as wealth increases (i.e., concave utility functions for gains).
If the distribution f(g) of gains g in the world follows a power-law distribution with
revealed utility function, as the relative rank of g is given by the cumulative distribution
function r(g) = c / (1 + ) g+1.
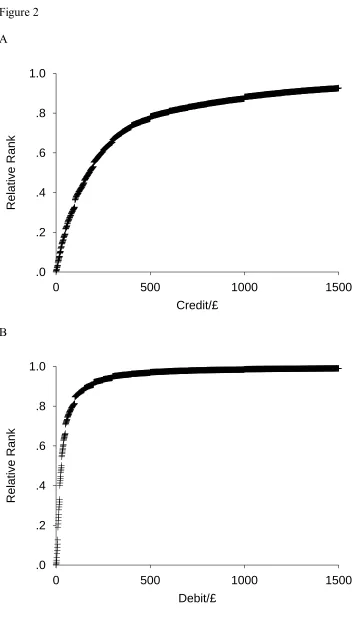
The assumption that gains are fully sampled is unlikely to be true given the
well-established finding of a severely limited capacity of short-term memory (Miller, 1956).
However, if a small, randomly drawn sample of gains is considered, then similar predictions
follow. The relative rank of an attribute value is determined by the probability that a randomly
sampled credit will be less than or equal to that value. Thus, the distribution of relative ranks
for a given target and given sample size will be binomial. Figure 3A illustrates the binomial
distribution of relative ranks obtained for a target value of £250 if 5 items are sampled
randomly from the distribution of credits. Figure 3B illustrates how this binomial distribution
will change as a function of the target credit. (Every plane perpendicular to the attribute value
axis is a binomial distribution.) As the mean of a binomial distribution is its probability
parameter, then Figure 2A represents the mean relative rank for a target credit, independent of
sample size.
Bordley and LiCalzi (2000) present an argument that is similar to the DbS account
above. In their account, the value of a gain is the probability that it will meet an uncertain
target. Thus, the value of the gain depends on its location within the distribution of target
values. Bordley and LiCalzi do not give a detailed psychological account of the origin of the
distribution of the target values, but do suggest that they result from uncertainty over which
targets are necessary to achieve higher superordinate goals. They assume that people select an
outcome to maximize the probability of meeting this target and show that this approach makes
the same predictions as expected utility. This approach is similar to DbS in that the subjective
value of a target attribute depends upon its ordinal position in some reference distribution, but
differs from DbS in assuming that the reference distribution reflects an uncertain aspiration
level rather than the real-world distribution of gains.
distributed noise. The power-law function is a result of memory reflecting the scale-free
distribution of credits observed in the environment, and the binomial noise is the result of a
sampling process. This motivation of this prediction stands in contrast to descriptive models,
which simply assume a curvature of the utility function, rather than explaining it. For example,
in prospect theory (Kahneman & Tversky, 1979; Tversky & Kahneman, 1992) the curvature
of the utility function describes risk aversion. Here we have independently motivated the
curvature, and risk aversion will follow as a consequence of this curvature.
Losses
We carried out a parallel analysis for losses. Figure 1B shows how the frequency with
which debits are made from current bank accounts depends on the magnitude of the debit.
Like gains, the distribution of losses also follows a power law, with many small losses and
relatively few large losses. The mean relative rank of losses (for any sample size) can be
derived as for gains, and is illustrated in Figure 2B. As before, incremental loss produces a
diminishing rise in relative rank. A comparison with gains reveals an interesting prediction.
There are relatively more small losses compared to small gains (as reflected in the differing
best fitting powers of -0.93 for gains and -0.96 for losses). This makes intuitive sense: One is
paid in a lump sum (e.g., a monthly salary) which one spends on many things (e.g., mortgage,
grocery bills, etc.). Because of this asymmetry, a loss of a given magnitude will have a higher
relative rank than that of a gain of the same monetary amount. Of course, this conclusion, that
losses loom larger than gains, is exactly that embodied in Kahneman and Tversky's (1979)
prospect theory. DbS predicts this asymmetry in behavior because there is an asymmetry in the
natural real-world distribution of gains and losses.
Friedman (1989) gives an argument related to DbS. Friedman assumes that there are
more small gains and losses than large gains and losses, consistent with our data on credits and
debits. He further assumes that we have a limited capacity for sensitivity to these gains and
most likely outcomes: We are assumed to be more sensitive to small gains and losses because
there are more of them. This is consistent with our DbS account according to which people
are sensitive to small gains and losses because they are more numerous and hence more
frequently sampled. Friedman proves that these two assumptions are sufficient to produce an
S-shaped approximation to the true, conventional, concave utility function with the point of
inflection at current wealth.
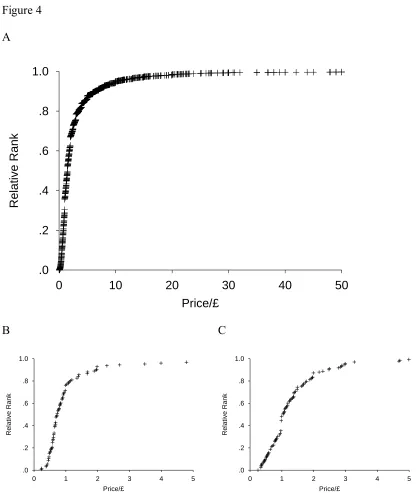
One might wonder whether the positively skewed distributions of gains and losses will
be found else where or whether they are specific to bank accounts. One reason to expect that
these positively skewed distributions will occur in many contexts is the ubiquity of power law
distributions. Another is that we found positively skewed distributions in other domains. For
example, we have also examined the distribution of prices in UK supermarkets. Figure 4A
shows the relative ranks for a large number of prices in the supermarket. Figures 4B and C
show two examples of the relative ranks calculated for bread and chocolate products. In
almost all of the cases we have examined, we have found positively skewed distribution of
prices, which leads to a concave function for relative ranks.
Time
We seek a uniform account of behavior across a wide variety of domains. There is
evidence that the processing of number and time may rely upon a common cortical resource
(Walsh, 2003). Thus, the treatment of temporal delays that we offer here is the same as that
outlined above for gains and losses. More specifically, the subjective value of a target temporal
delay will be determined in the context of a decision sample of other temporal delays.
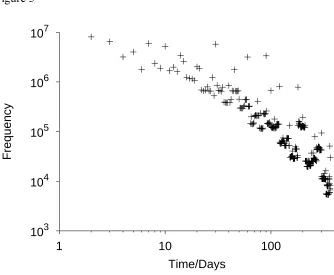
We argue that DbS explains of some of the key temporal anomalies reviewed by
Loewenstein and Thaler (1989). As before, we assume that the distribution of delays in
memory reflects the distribution in the real world. To obtain a crude approximation, our
colleague, Stian Reimers, collected the number of hits produced by an internet search engine
over different search strings representing the same period (e.g., "a day", "one day", "1 day",
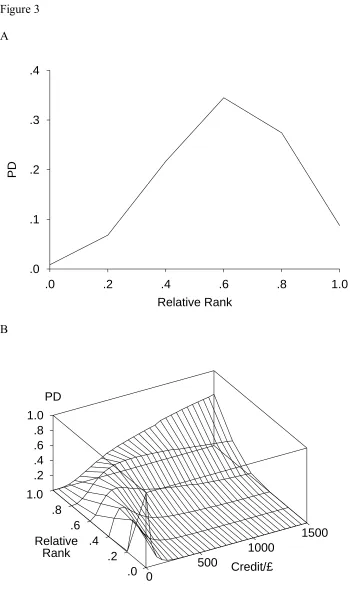
"24 hours") for intervals between 1 day and 1 year. Figure 5 plots the frequency of different
temporal intervals as a function of their magnitude. As for gains and losses, the distribution
approximately follows a power law (replicating the findings of Pollmann, 1998; and Pollmann
& Baayen, 2001, who used different sources of data and time periods). The best fitting slope
for this distribution, and those obtained by Pollmann from other corpora with other ranges, are
listed in Table 1. (Power laws also describe the time intervals between repetitions of words in
New York Times headlines, words in parental utterances to children, and e-mails from
particular correspondents in Anderson's mail box, Anderson & Schooler, 1991).
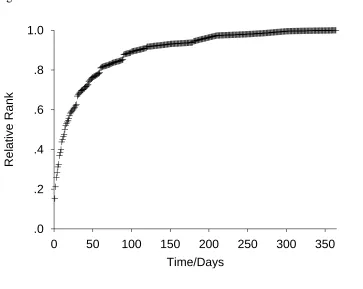
Hyperbolic Temporal Discounting
Figure 6 shows the mean relative rank assigned to each delay as a function of delay
magnitude assuming random sampling from the distribution in Figure 5. Incremental delay has
a diminishing effect, just as for gains and losses. DbS predicts a specific form for the mean
relative rank of a delay as a function of its magnitude. A straight line provides a better fit to a
log-log plot of the distribution of temporal intervals (Figure 5) than it does to a linear-log plot,
indicating that a power law function describes the distribution of intervals better than an
exponential function. Approximating the distribution of times t with a power law f(t) = c t
-gives the cumulative distribution function, which is the mean relative rank function, of r(t) = c
t-+1 / (1 - ). Thus DbS predicts power-law temporal discounting, in which the discount rate
decreases over time, rather than the normative exponential discounting, where the discount
rate is constant. It is experimentally well established that people's discount rate does indeed
decrease over time (Kirby, 1997; Benzion, Rapoport, & Yagil, 1989; Thaler, 1981).
As estimates of range from -1.7 to -1.4 (see Table 1), estimates of the power of the
discounting function will range from -0.7 to -0.4. A power of -1.0 gives hyperbolic
discounting and therefore DbS predicts sub-hyperbolic discounting. This differs from
is predicted either by hyperbolic or exponential discounting. Just such a finding is reported by
Myerson and Green (1995) and Simpson and Vuchinich (2000).
Discount Rate Depends on the Magnitude of the Gain
Discount rate decreases with the magnitude of the gain on offer (e.g., Benzion, et al.,
1989; Green, Myerson, & McFadden, 1997; Holcomb & Nelson, 1989, as cited in
Loewenstein & Thaler, 1989; Thaler, 1981). If magnitudes are sampled at random from
memory then DbS does not account for this phenomenon. If it is assumed that similarity plays
a role in the sampling process, DbS can offer an account. There must be a positive correlation
between the delay until a gain and the size of the gain in the world: As large gains are less
frequent than small gains, the average delay between large gains must be larger than the delay
between small gains. Assume that people sample large delays when considering large gains,
because large gains and large delays were associated in the past. In this context of large
delays, the target delay will receive a low relative rank compared to the case when the sample
comprises small delays. In other words, in the context of delays evoked by the large gain, the
given target delay will seem less bad, and thus be discounted less. We return to the issue of
similarity sampling in the General Discussion.
Discount Rate is Greater for Gains than Losses
Thaler (1981) found that discount rates were higher for gains than for losses of
equivalent magnitude. In any account where losses loom larger than gains, including DbS, the
discount rate for gains will appear higher. This is because the discount rate depends not only
on the discounting function but also upon the curvature of the utility function. Consider the
discount rate implied by an indifference between £x now and the larger amount £y delayed by
time t. With a power law utility function u(x) = x and any discount function f(t),
x= yf t
x
y=f t
1
The discount rate incorporates the curvature of the utility function (e.g., Benzion et al. 1989;
Mazur, 1987; Thaler, 1981, but see Chapman, 1996, for a separation, and also Kirby &
Santiesteban, 2003, though this example does not involve gains and losses). Thus, if the
curvature is larger for losses, the discount rate will be smaller. Note that, even if the free
parameter(s) of a utility function are fitted at the same time as the free parameter(s) of the
discounting function and differences in the discounting parameters are found, one cannot be
sure that the difference in discounting parameters reflects different discounting of gains and
losses. Johnson and Bickel (2005) found that, when fitting a hyperbolic-like discounting
function of the form x / y = 1 / (1 + k t)s, the k and s free parameters were correlated. The
equivalence of s in this form with in the above form means that if is different for gains and
losses, k will also differ for gains and losses even if gains and losses are discounted in exactly
the same way.
DbS and Working Memory Load
The DbS explanation of the shape of the temporal discounting function is that the
subjective value of a target delay is derived from comparisons with a sample of delays from
memory. In support of this, a working-memory load has been found to affect temporal
discounting. With a larger working-memory load, discounting of delayed gains is greater
(Hinson, Jameson, & Whitney, 2003). According to DbS, a larger working memory load
should reduce the number of items in the decision sample. In turn, this means that, in the
absence of other larger delays from memory, the delay associated with a delayed outcome will
seem particularly bad in comparison to only the zero delay of an immediate outcome. Thus,
DbS correctly predicts the finding of greater discounting when working memory is loaded.
Summary
phenomena reported in the literature. There are surely other important psychological factors at
play, such as savoring and dread (e.g., Loewenstein, 1987) and mental accounting (e.g.,
Shefrin & Thaler, 1988; Prelec & Loewenstein, 1998). However, DbS can explain why
discounting is (sub)hyperbolic and, with a plausible modification (assuming that similarity
sampling rather than random sampling), can explain why the discount rate is reduced for larger
amounts of money. Finally, because the curvature of the utility function is often combined
within the measure of discount rate, DbS (and presumably other models) can explain why
gains are discounted more heavily than losses.
Risk
We treat probability in the same way as we have treated gains, losses, and delays. We
will argue that the distribution of probabilities that people experience is such that small
probabilities will be over weighted and large probabilities will be under weighted. In other
words, subjective probability is an inverse S-shaped function of actual probability (e.g.,
Abdellaoui, 2000; Bleichrodt & Pinto, 2000; Gonzalez & Wu, 1999; Kahneman & Tversky,
1979; Prelec, 1998; Tversky & Kahneman, 1992; Wu & Gonzalez, 1996, 1999; but see
Hertwig, Barron, Weber, & Erev, 2004, for the opposite pattern for small probabilities when
probabilities are experienced as the number of successful outcomes over a series of trials).
There is some evidence that probabilities (or frequencies) are compared with attribute
values retrieved from memory. Dougherty and Hunter (2003a, b) found correlation between
working memory span and probability judgments. Larger working memory spans coincided
with less subadditivity. (Subadditivity is the extent to which the judged probabilities of a set of
mutually exclusive, exhaustive events sum to greater than 1.) Further, time constraints
increased subadditivity. They argued that these data are consistent with a model where larger
working memory and longer time allows target probabilities to be compared to a larger pool
of sampled probabilities. Together with the finding that the particular frequencies with which
probabilities are judged in comparison to a decision sample.
There is one striking difference between the distributions of gains, losses and delays,
and the distribution of probabilities: Probabilities are bounded to be between 0 and 1, and thus
cannot follow a power-law distribution. Here we shall argue that there are more cognitively
relevant events with small and large probabilities than with mid-range probabilities.
Specifically, we shall present four arguments. Each leads to the same conclusion: that small
probabilities will be overestimated and large probabilities underestimated in a DbS framework.
The Distribution of Probability Phrases
As with time and money, here we attempt to find a proxy for the distribution of
probabilities in long-term memory from which people sample when they evaluate a target
probability. Because people prefer to give verbal rather than numerical descriptions of
probabilities (Beyth-Marom, 1982; Brun & Teigen, 1988; Budescu & Wallsten, 1985; Erev &
Cohen, 1990; Olson & Budescu, 1997; Wallsten, Budescu, Zwick, & Kemp, 1993), use many
different verbal labels (Budescu, Weinberg, & Wallsten, 1988; Karelitz & Budescu, 2004), and
find it about as easy to reason with verbal or numerical descriptions of probabilities (see
Budescu & Wallsten, 1995, for a review) we chose to analyze the frequency with which verbal
phrases occurred in natural language. As before, we assume that the availability of
probabilities in memory reflects this real world distribution.
Karelitz and Budescu (2004) asked 20 participants to generate phrases to "select
phrases that spanned the whole probability range and that they also used in their everyday
lives" (p. 29). We used the 71 different phrases that their participants generated in our
analysis. For each phrase, we attempted to determine two things: (a) the numerical probability
equivalent of the phrase, and (b) the frequency with the phrase is used to describe probabilities
in natural language.
There is already a literature that attempts to relate numerical probabilities and verbal
to imagine that a truthful person had used each phrase to describe the probability of winning
an urn draw by drawing a red ball from 100 balls in total. For each phrase, participants were
asked to say how many red balls (between 0 and 100 inclusive) the phrases suggested were in
the urn. For each participant, phrases were presented in a different random order. Table 2
shows the mean and standard deviation of the probability attached to each phrases. Out of a
total of 2,840 responses, 121 lay two interquartile ranges outside the upper and lower
quartiles and were deleted as outliers. Their deletion does not affect the qualitative pattern of
the results. Where our phrases overlap with those of other researchers (Beyth-Marom, 1982;
Budescu & Wallsten, 1985; Clarke, Ruffin, Hill, & Beaman, 1992; Regan, Mosteller, &
Youtz, 1989) there is reasonable agreement on the numerical equivalents.
To estimate the frequency of the phrases in natural language, we searched the British
National Corpus (BNC) World Edition (http://www.natcorp.ox.ac.uk/index.html). There are
about 100 million words in the BNC, which was designed to be representative of spoken and
written English. The frequency with which each phrase occurred is listed in Table 2. Where
one phrases is a sub-phrase of another (e.g., 'certain' is a sub-phrase of 'fairly certain'), then the
frequency of the sub-phrase was counted ignoring occurrences of the subsuming phrase.
Because some of the phrases also occur in natural language outside the context of probability
description, a random sample of twenty occurrences was analyzed for each phrase to estimate
the proportion of the time that the phrases was used to describe a probability. The product of
the frequency of occurrence and the proportion of times a phrase is used to describe a
probability was calculated to give the frequency with which each phrase was used to describe
a probability. (Omitting this weighting does not alter qualitative pattern described below.)
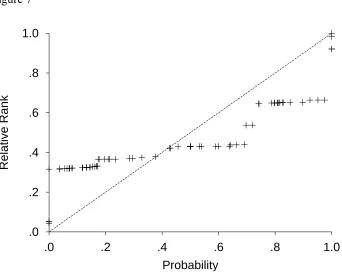
Figure 7 plots the relative rank of each phrase against the probability that best
represents it. Because very small (or zero) and very large (or certain) probabilities are more
frequent than for midrange probabilities, the function has an inverse S-shape. Because large
judgments would be accurately calibrated (i.e., at which the subjective probability function
crosses the line y = x) is less than p = .5. When the function w(p) = p / ((p +(1 - p))1 / ) is
fitted to these data, the best estimate for is .59 (r2 = .92). The range of values for which
90% of the variance is captured is .46 to .67. This range coincides reasonably well with
values found by Camerer and Ho (1994, = .56), Tversky & Kahneman (1994, = .61) and
Wu and Gonzalez (1996, = .71). In other words, there is good agreement between the
function we have derived here using the distribution of probability phrases in natural language
and those that best describe choices between gambles.
Table 2 shows that the numerical values assigned to many probability phrases are quite
variable. This finding is well established in the literature (see Budescu & Wallsten,1995).
Thus, the positioning of each probability phrase on the abscissa of Figure 7 is subject to some
noise. However, if one instead smears out the contribution to the increase in relative rank due
to each phrase over the full distribution of numerical probability equivalents for each phrase,
rather than just using the mean equivalent, a very similar inverse S-shape function is found.
The Distribution of Probabilities in Experiments
Brown and Qian (2004) examined the distribution of probabilities used in experiments
designed to elicit the form of the probability weighting function in decision making under both
risk and uncertainty. In a majority of studies, smaller and larger probabilities are
over-represented compared to mid-range probabilities. Figure 8A illustrates this with the
probabilities used by Gonzales and Wu (1999). Figure 8B shows the relative rank that would
be assigned to a target probability if the sample people compared it to comprised the
experimental probabilities for each experiment. Again, small probabilities are overestimated
and large probabilities are underestimated.
Subjective Estimates of Probability Frequency
Brown and Qian (2004) asked participants to estimate the relative frequencies with
probabilities are rated as occurring most frequently, and (b) high probabilities are rated as
occurring more often than low probabilities. Assuming the veridicality of participants' ratings,
DbS can therefore explain both the S-shape of the probability weighting curve and also its
asymmetry.
Sampling of Events
From assuming that there are few frequent events and many rare events (Oaksford &
Chater, 1994) we argue that the distribution of probabilities experienced is such that there are
many small and large probabilities and relatively few moderate probabilities. Here we illustrate
this argument by considering a toy universe, where there are only 100 possible events that can
and will ever occur. We begin by assuming that the frequency of these events follows Zipf's
power law (see Figure 9A). Many real-world events, such as the frequency of words in natural
language, follow just such a distribution (see, e.g., Bak, 1997; Ijiri & Simon, 1977;
Mandelbrot, 1982; Zipf, 1949). According to support theory (Tversky & Koehler, 1994),
people judge the probability of an event by comparing it to possible alternative events. Thus,
here we do not assume that people have access to the raw frequencies of each event. Instead
they judge how likely each event is compared to a subset of possible alternatives. Continuing
the word frequency example, the raw frequencies themselves are not of communicative
importance. Instead, what matters and what is experienced is co-occurrence (indeed many
computational models of the lexical semantics are constructed from just such co-occurrence
relations, e.g., the hyperspace analogue to language, Lund & Burgess, 1996, and latent
semantic analysis, Landauer and Dumais, 1997). That is, they experience the relative
frequencies of words in a particular context. For example, the raw frequencies of "hedge" and
"fence" are not experienced directly. Instead, we experience their relative frequencies in
contexts like "the horse jumped over the...".
Figure 9B shows the probability with which various relative probabilities are
sampling two events E1 and E2. Call the absolute probability of these events p1 and p2. Thus,
the probability of randomly sampling the pair from the universe is given by the pair probability
p1 p2. The relative probability of event E1 is p1 / (p1 + p2) and the relative probability of event
E2 is p2 / (p1 + p2). The probability with which each relative probability can be experienced can
be calculated by averaging over all possible event pairs, and it is this distribution that is plotted
in Figure 9B. We suggest that it is these relative probabilities that people encode, and thus
sample from memory. Figure 9C plots the mean relative rank of a probability within a sample
from all of the relative probabilities (effectively the cumulative density function, exactly as for
gains, losses, and delays). There are two important features of this resulting function. First,
there are more small and large relative probabilities than intermediate values: The cumulative
density function is steepest initially and finally. Second, certain round fractions (e.g., 1/2, 1/3)
occur frequently. Note that most of the density of the fractal-like pattern is at the edges
despite the central spikes.
The immediately preceding argument assumes people are sensitive to the relative
probability of one event compared to another p1 / (p1 + p2). An alternative assumption is that
people are sensitive to the odds p1 / p2. Because odds are a simple monotonic transform of
relative probability - specifically odds = probability / (1 - probability) - the distribution and
cumulative distribution of odds can be derived directly from those for relative probability.
Crucially, for a given pair of events, the relative rank of the relative probability is the same as
the relative rank for the corresponding odds. Thus, according to DbS the relative rank of an
event will be the same whether people are sensitive to odds or relative probability (though
presenting the chances of an event happening as odds rather than probability might well evoke
a different sample of chances from long-term memory).
General Discussion
The shapes of the descriptive functions for the utility of gains and losses, temporal
Here, we have offered an account of why these functions might take the forms that they do.
DbS makes two key claims about the psychology of decision making. First, people can make
only binary, ordinal comparisons between attribute values. Second, attribute values are
compared with a decision sample comprising a sample of values from memory. The
distribution of values in memory is assumed to reflect the distribution of attribute values in the
world. Thus, according to DbS, these functions take the forms they do because of the
real-world distribution of gains, losses, delays, and probabilities. These assumptions are sufficient
to account for incremental wealth having diminishing incremental utility (i.e., risk aversion);
losses looming larger than gains; sub-hyperbolic temporal discounting, with a dependency of
magnitude and nature of the outcome; and overestimation of small probabilities and
underestimation of large probabilities.
DbS and Economic Theory
The assumption that people do not directly utilize internal scales for value constitutes a
break from Bentham's (1789/1970) notion that utility is calibrated on an internal psychological
scale and thus a break from psychological theories derived from economics that make a similar
assumption. Interestingly, mainstream economic theory has not assumed the existence of such
scales. Indeed the revealed preference interpretation (Samuelson, 1937), which has become
standard in economics, takes utility to be revealed by observable preferences. For one item to
have higher utility than another for a particular person is taken to mean no more than the first
item would be chosen over the second by that person. Savage (1954) generalized this result to
utilities and probabilities, showing that, given certain normatively reasonable constituency
conditions on people's preferences over gambles, these preferences could be used to reveal
utility and probability information simultaneously. From the revealed preference perspective,
the utility and probability scales are derived from dispositions concerning preferences, rather
than amounting to psychological claims. The approach developed in this paper has intriguing
have access only to their binary preferences (or more generally binary, ordinal comparison of
perceptual magnitudes) and hence, to the extent that people have a broader grasp of their own
more global preferences, these must be constructed from their own binary preferences
(Kornienko, 2004), just as the economist constructs probability and utility scales from a
person's binary choices. This account also has a striking dissimilarity from the economists'
conception. This is because we assume that sampling from memory is limited and stochastic.
People's judgments of a particular attribute will be strongly influenced by the particular
comparison items that they happen to sample. Hence, people's assessments of payoffs,
probabilities, time intervals, and other attributes, will be highly malleable, rather than
conforming to a stable ordering as in standard economic theory.
Prospect Relativity
In this article we have focused upon the effect of the attribute values that people
sample from memory. However, as we suggested above, we also think that attribute values
from the immediate context in which a decision is made are also likely to be sampled and thus
influence judgment and decision making. Two existing experiments have examined the effect
of the context in which a decision is made on judged certainty equivalents of risky prospects
(Birnbaum, 1992; Stewart, Chater, Stott, & Reimers, 2003) and in decision under risk
(Stewart et al., 2003; see Benartzi & Thaler, 2001, for a real-world example). In both of these
experiments the distribution of options (either values from which a participant had to draw a
certainty equivalent, or the range of prospects from which a participant could select one to
play) was manipulated. Birnbaum and Stewart et al. both found strong effects of these
manipulations which were consistent with attribute values being judged in comparison to other
attribute values in the immediate decision context.
DbS and the Time Course of Decision
Recently, psychologists have begun to consider the time course of decision making
sequential sampling model, where pairs of attribute values are subject to ordinal comparison,
and frequency counts of favorable comparisons are maintained. This formulation could
naturally be extended to model the time course of decision making. We envisage that this
accumulation will continue either until a response deadline or until some threshold or
difference is reached.
This account differs from that of Roe et al. (2001) and Diederich (2003). In their
account, dimensions, rather than attribute values, are sampled in an all or none process, with
stochastic switching between dimensions during the course of the decision process. At each
step, the valence of each alternative is derived by comparison with every other alternative in
the choice set. Valences are integrated over time to produce preferences, with the preferences
for each option competing via similarity weighted lateral inhibition. In DbS, valences would
simply be incremented by favorable ordinal, binary comparisons. Competition between options
in DbS would not come from lateral inhibition, but instead from the fact that comparisons are
binary. Because comparisons are assumed to be binary, introducing a new option that is similar
to an existing option would cause the favorable comparisons to be shared between them.
Range-Frequency Theory
In Parducci's (1965, 1995) range-frequency theory, an attribute value is a weighted
sum of its ordinal rank within the immediate context and its interval scale position within the
range set by the immediate context. In DbS, only rank matters. However, in DbS, effects of
the absolute magnitude of an attribute value (i.e., range effects) can arise because items in the
decision sample includes not only items from the immediate context but also other values from
memory. If the distribution of extra-contextual attribute values is uniform, then the subjective
attribute value is that given by range-frequency theory. Thus, we suggest that demonstrations
of effects of the position within the range with rank held constant in fact reflect the use of
attribute values from outside the immediate context. To the extent that these are fixed from
available when this is not necessarily the case.
Consistent with this, applications of range-frequency theory to areas such as price
perception and wage satisfaction ratings have typically found that the rank/frequency
weighting is weighted more highly, and the range/end-point relative position less highly, when
the distribution of the decision sample is made salient (e.g., by simultaneous presentation:
Brown, Gardner, Owald, & Qian, 2004; Niedrich, Sharma, & Wedell, 2001; cf. also Alba,
Mela, Shimp, & Urbany, 1999).
Decision by Similarity Sampling
It is unlikely that attribute values in the decision sample are sampled randomly from
memory. It seems likely that other factors such as similarity and recency must play a role.
Most models of memory retrieval assign a major role to recency as a factor determining
retrieval probability, and hence any complete account must assume that recent items are more
likely to be included in the decision sample. For example, Parducci (1996) argues that the
context for evaluation includes both recent exemplars and also remembered extreme exemplars
(anchors). However similarity will also determine the probability of inclusion: for example, the
price of a car is likely to be judged with reference to a sample of similarly-priced cars, and
wage satisfaction is likely to be evaluated in terms of a sample of wages earned by individuals
in similar occupations and earning similar wages (e.g., Rablen, Brown, & Oswald, 2004).
In the discussion of how discount rate depends on the magnitude of the outcome, we
suggested that the long [shorter] delays experienced in the receipt of large [smaller] monetary
values would be sampled when considering the discounting of larger [smaller] values. This
suggestion is consistent with the idea that whole exemplars are sampled, rather than isolated
attribute values. Many exemplar models of memory offer the potential for
independently-motivated accounts of the retrieval processes that might underpin the formation of decision
samples. Indeed, some of these accounts have been applied to judgments of probability. In
interpreted in relation to an evoked contextual set of relevant stimuli or events that are
retrieved in response to the event to be judged. Such retrieval may be similarity-based.
Dougherty et al. (1999) develop a similarity-based model of memory, Hintzman's MINERVA2
(Hintzman, 1984, 1988), and apply it to a wide range of likelihood judgment phenomena.
Thus, exemplar theories of memory can underpin models of availability, and DbS can be
interpreted as an account of processes operating subsequent to availability-stage phenomena.
More specifically, the availability heuristic suggests that event frequencies or likelihoods are
judged by the ease with which instances come to mind (Tversky & Kahneman, 1973). As
Schwarz and Vaughn (2002) note, fluency of recall and content of recall may provide distinct
sources of information. DbS, while focussing on content, is distinctive in assuming that only
relative magnitude judgments are available to provide the basis for judgment, and that
judgments are made purely on the basis of a tally of the number of retrieved exemplars above
and below the target item on the dimension of interest. In some cases (e.g., Brown et al.,
2004) this simplistic sampling provides a better fit to the data than when similarity (or
dissimilarity) are taken into account.
Unifying Normative and Contextual Models of Decision Making
We see the DbS framework as an important step towards unifying traditional models
of decision making, where attribute values are derived from fixed psychoeconomic functions
of external values, and contextually driven models, such as range frequency theory and
multialternative decision field theory. We have offered an account where the frequently
observed psychoeconomic functions arise from the real-world decision making environment
which also incorporates an explanation of how variations in that context will influence
References
Abdellaoui, M. (2000). Parameter free elicitation of utilities and probability weighting
functions. Management Science, 46, 1497-1512.
Alba, J. W., Mela, C. F., Shimp, T. A., & Urbany, J. E. (1999). The effect of discount
frequency and depth on consumer price judgments. Journal of Consumer Research,
26, 99-114.
Allais, M. (1953). Le comportement de l'homme rationel devant le risque, critique des
postulats et axiomes de l'ecole americaine. Econometrica, 21, 503-546.
Anderson, J. R. (1990). The adaptive character of thought. Hillsdale, NJ: Erlbaum.
Anderson, J. R., & Milson, R. (1989). Human memory: An adaptive perspective.
Psychological Review, 96, 703-719.
Anderson, J. R., & Schooler, L. J. (1991). Reflections of the environment in memory.
Psychological Science, 2, 396-408.
Bak, P. (1997). How nature works: The science of self-organized criticality. Oxford, UK:
Oxford University Press.
Benartzi, S., & Thaler, R. H. (2001). Naive diversification strategies in defined contribution
saving plans. The American Economic Review, 91, 79-98.
Benzion, U., Rapoport, A., & Yagil, J. (March, 1989). Discount rates inferred from decisions:
An experimental study. Management Science, 35, 270-284.
Bentham, J. (1970). An introduction to the principles of morals and legislation (J. H. Burns
& H. L. A. Hart, Eds.). London: The Athlone Press. (Original work published, 1789)
Bettman, J. R, Luce, M. F., & Payne, J. W. (1998). Constructive consumer choice processes.
Journal of Consumer Research, 25, 187-217.
Beyth-Marom, R. (1982). How probable is probable? A numerical translation of verbal
probability expressions. Journal of Forecasting, 1, 257-269.
choice-based certainty equivalents. Psychological Science, 3, 310-314.
Bleichrodt, H., & Pinto, J. L. (2000). A parameter-free elicitation of the probability weighting
function in medical decision analysis. Management Science, 46, 1485-1496.
Bordley, R., & LiCalzi, M. (2000). Decision analysis using targets instead of utility functions.
Decision in Economics and Finance, 23, 53-74.
Brown, G. D. A., Gardner, J., Oswald, A., & Qian, J. (2004). Rank dependence in employees'
wellbeing. Manuscript submitted for publication.
Brown, G. D. A., & Qian, J. (2004). The origin of the probability weighting function: A
psychophysical approach. Manuscript submitted for publication.
Brun, W., & Teigen, K. H. (1988). Verbal probabilities: Ambiguous, context-dependent, or
both? Organizational Behavior and Human Decision Processes, 41, 390-404.
Budescu, D. V., & Wallsten, T. S. (1985). Consistency in interpretation of probabilistic
phrases. Organizational Behavior and Human Decision Processes, 36, 391-405.
Budescu, D. V., & Wallsten, T. S. (1995). Processing linguistic probabilities: General
principles and empirical evidence. In J. Busemeyer, D. L. Medin, & R. Hastie (Eds.),
Decision making from a cognitive perspective (pp. 275-318). San Diego, CA:
Academic Press.
Budescu, D. V., Weinberg, S., & Wallsten, T. S. (1988). Decisions based on numerically and
verbally expressed uncertainties. Journal of Experimental Psychology: Human
Perception and Performance, 14, 281-294.
Busemeyer, J. R., & Townsend, J. T. (1993). Decision field theory: A dynamic-cognitive
approach to decision making in an uncertain environment. Psychological Review, 100,
432-459.
Chapman, G. B. (1996). Temporal discounting and utility for health and money. Journal of
Experimental Psychology: Learning, Memory, and Cognition, 22, 771-791.
Cognition, 69, b17-b24.
Clarke, V. A. Ruffin, C. L., Hill, D. J., & Beamen, A. L. (1992). Ratings of orally presented
verbal expressions of probability by a heterogeneous sample. Journal of Applied
Social Psychology, 22, 638-656.
Diederich, A. (2003). MDFT account of decision making under time pressure. Psychonomic
Bulletin & Review, 10, 157-166.
Dougherty, M. R. P., Gettys, C. F., & Ogden, E. E. (1999). MINERVA-DM: A memory
process model for judgments of likelihood. Psychological Review, 106, 180-209.
Dougherty, M. P. R., & Hunter, J. (2003a). Hypothesis generation, probability judgment, and
individual differences in working memory capacity. Acta Psychologica, 113, 263-282.
Dougherty, M. P. R., & Hunter, J. (2003b). Probability judgment and subadditivity: The role
of working memory capacity and constraining retrieval. Memory & Cognition, 31,
968-982.
Erev, I., & Cohen, B. L. (1990). Verbal versus numerical probabilities: Efficiency, biases, and
the preference paradox. Organizational Behavior and Human Decision Processes, 45,
1-18.
Friedman, D. (1989). The S-shaped value function as a constrained optimum. American
Economic Review, 79, 1243-1248.
Garner, W. R. (1962). Uncertainty and structure and psychological concepts. New York:
Wiley.
Gigerenzer, G., & Hoffrage, U. (1995). How to improve Bayesian reasoning without
instruction: Frequency formats. Psychological Review, 102, 684-704.
Green, L., Myerson, J., McFadden, E. (1997). Rate of temporal discounting decreases with
amount of reward. Memory & Cognition, 25, 715-723.
González-Vallejo, C. (2002). Making trade-offs: A probabilistic and context-sensitive model
Gonzalez, R., & Wu, G. (1999). On the shape of the probability weighting function. Cognitive
Psychology, 38, 129-166.
Gutenberg, B., & Richter, C. F. (1949). Seismicity of the earth. Princeton, NJ: Princeton
University Press.
Hertwig, R., Barron, G., Weber, E. U., & Erev, I. (2004). Decisions from experiences and the
effect of rare events in risky choice. Psychological Science, 15, 534-539.
Hinson, J. M, Jameson, T. L., & Whitney, P. (2003). Impulsive decision making and working
memory. Journal of Experimental Psychology: Learning, Memory, and Cognition,
29, 298-306.
Hintzman, D. L. (1984). MINERVA2: A simulation model of human memory. Behavior
Research Methods, Instruments, and Computers, 16, 96-101.
Hintzman, D. L. (1988). Judgments of frequency and recognition memory in a multiple-trace
memory model. Psychological Review, 95, 528-551.
Ijiri, Y., & Simon, H. A. (1977). Skew distributions and the size of business firms.
Amsterdam: North Holland.
Johnson, M. W., & Bickel, W. K. (2005). Delay discounting: A review, reanalysis, and
critique of models and quantifications. Manuscript submitted for publication.
Johnstone, A. C., & Nava, S. (1985). Recurrence rates and probability estimates for the New
Madrid Seismic Zone. Journal of Geophysical Research, 90, 6737.
Juslin, P., & Persson, M. (2002). PROBabilities from EXemplars (PROBEX): A "lazy"
algorithm for probabilistic inference from generic knowledge. Cognitive Science, 26,
563-607.
Kahneman, D., & Miller, D. T. (1986). Norm theory: Comparing reality to its alternatives.
Psychological Review, 93, 136-153.
Kahneman, D., & Tversky, A. (1979). Prospect theory: An analysis of decision under risk.
Kahneman, D, & Tversky, A. (Eds.). (2000). Choices, values and frames. New York:
Cambridge University Press & the Russell Sage Foundation.
Karelitz, T. M., & Budescu, D. V. (2004). You say "probable" and I say "Likely": Improving
interpersonal communication with verbal probability phrases. Journal of Experimental
Psychology: Applied, 10, 25-41.
Kirby, K. N. (1997). Bidding on the future: Evidence against normative discounting of delayed
rewards. Journal of Experimental Psychology: General, 126, 54-70.
Kirby, K. N., & Santiesteban, M. (2003). Concave utility, transaction costs, and risk in
measuring discounting of delayed rewards. Journal of Experimental Psychology:
Learning, Memory, and Cognition, 29, 66-79.
Kornienko, T. (2004). A cognitive basis for cardinal utility. Working paper.
Landauer, T. K., & Dumais, S. T. (1997). A solution to Plato's problem: The latent semantic
analysis theory of acquisition, induction, and representation of knowledge.
Psychological Review, 104, 211-240.
Loewenstein, G. (1987). Anticipation and the valuation of delayed consumption. Economic
Journal, 97, 666-684.
Loewenstein, G., & Thaler, R. H. (1989). Anomalies: Intertemporal choice. Journal of
Economic Perspectives, 3, 181-193.
Loomes, G., & Sugden, R. (1982). Regret theory: An alternative theory of rational choice
under uncertainty. Economic Journal, 92, 805-824.
Lund K., & Burgess, C. (1996). Producing high-dimensional semantic spaces from lexical
co-occurrence. Behavioral Research Methods, Instruments, & Computers, 28, 203-208.
Mazur, J. E. (1987). An adjusting procedure for studying delayed reinforcement. In M. L.
Commons, J. E. Mazur, J. A. Nevin, & H. Rachlin (Eds.), Quantitative analyses of
behavior, Vol. 5: The effect of delay and of intervening events on reinforcement value
Miller, G. A. (1956). The magical number seven, plus or minus two: Some limits on our
capacity for information processing. Psychological Review, 63, 81-97.
Myerson, J., & Green, L. (1995). Discounting of delayed rewards: Models of individual
choice. Journal of the Experimental Analysis of Behavior, 64, 263-276.
Niedrich, R. W., Sharma, S., & Wedell, D. H. (2001). Reference price and price perceptions:
A comparison of alternative models. Journal of Consumer Research, 28, 339-354.
Oaksford, M., & Chater, N. (1998). Rationality in an uncertain world: Essays on the
cognitive science of human reasoning. Hove, England: Psychology Press/Erlbaum.
Olson, M. J., & Budescu, D. V. (1997). Patterns of preference for numerical and verbal
probabilities. Journal of Behavioral Decision Making, 10, 117-131.
Parducci, A. (1965). Category judgment: A range-frequency model. Psychological Review,
72, 407-418.
Parducci, A. (1995). Happiness, pleasure, and judgment: The context theory and its
applications. Mahwah, NJ: Erlbaum.
Payne, J. W., Bettman, J. R., & Johnson, E. J. (1992). Behavioral decision research: A
constructive processing perspective. Annual Review of Psychology, 43, 87-131.
Pollmann, T. (1998). On forgetting the historical past. Memory & Cognition, 26, 320-329.
Pollmann, T., & Baayen, R. H. (2001). Computing historical consciousness. A quantitative
inquiry into the presence of the past in newspaper texts. Computers and the
Humanities, 35, 237-253.
Prelec, D. (1998). The probability weighting function. Econometrica, 66, 497-527.
Prelec, D., & Loewenstein, G. (1998). The red and the black: Mental accounting of savings
and debt. Marketing Science, 17, 4-28.
Quiggin, J. (1982). A theory of anticipated utility. Journal of Economic Behavior and
Organisation, 3, 323-343.
MA: Kluwer Academic Publishers.
Rachlin, H. (1989). Judgment, decision, and choice. New York: Freeman.
Rablen, M. D., Brown, G. D. A., & Oswald, A. J. (2004). Social comparison, adaptation,
and the utility of income. Unpublished manuscript.
Reagan, R. T., Mosteller, F., & Youtz, C. (1989). Quantitative meaning of verbal probability
expressions. Journal of Applied Psychology, 74, 433-442.
Roe, R. M., Busemeyer, J. R., & Townsend, J. T. (2001). Multialternative decision field
theory: A dynamic connectionist model of decision making. Psychological Review,
108, 370-392.
Samuelson, P. A. (1937). A note of measurement of utility. The Review of Economic Studies,
4, 155-161.
Savage, L. J. (1954). The foundations of statistics. New York: Wiley.
Schwarz, N., & Vaughn, L. A. (2002). The availability heuristic revisited: Ease of recall and
content of recall as distinct sources of information. In T. Gilovich, D. Griffin, & D.
Kahneman (Eds.), Heuristics and biases: The psychology of intuitive judgment (pp.
534-547). Cambridge, England: Cambridge University Press.
Sedlmeier, P., & Betsch, T. (Eds.). (2002). Etc. Frequency processing and cognition. Oxford,
England: Oxford University Press.
Shefrin, H., & Thaler, R. H. (October, 1988). The behavioral life-cycle hypothesis. Economic
Inquiry, 26, 609-643.
Shepard, R. N. (1987). Evolution of a mesh between principles of the mind and regularities of
the world. In J. Dupré (Ed.), The latest on the best: Essays on evolution and
optimality. Cambridge, MA: MIT Press.
Shiffrin, R. M., & Nosofsky, R. M. (1994). Seven plus or minus two: A commentary on
capacity limitations. Psychological Review, 101, 357-361.
The Psychological Record, 50, 3-16.
Slovic, P. (1995). The construction of preference. American Psychologist, 50, 364-371.
Stewart, N., Brown, G. D. A., & Chater, N. (in press). Absolute identification by relative
judgment. Psychological Review.
Stewart, N., Chater, N., Stott, H. P., & Reimers, S. (2003). Prospect relativity: How choice
options influence decision under risk. Journal of Experimental Psychology: General,
132, 23-46.
Thaler, R. H. (1981). Some empirical evidence on dynamic inconsistency. Economic Letters,
8, 201-207.
Tversky, A., & Kahneman, D. (1973). Availability: A heuristic for judging frequency and
probability. Cognitive Psychology, 5, 207-232.
Tversky, A., & Kahneman, D. (1992). Advances in prospect theory: Cumulative
representation of uncertainty. Journal of Risk and Uncertainty, 5, 297-323.
Tversky, A., & Koehler, D. J. (1994). Support theory: A nonextensional representation of
subjective probability. Psychological Review, 101, 547-567.
Wallsten, T. S., Budescu, D. V., Zwick, R., & Kemp, S. M. (1993). Preferences and reasons
for communicating probabilistic information in verbal or numerical terms. Bulletin of
the Psychonomic Society, 31, 135-138.
Walsh, V. (2003). A theory of magnitude: common cortical metrics of time, space and
quantity. Trends in Cognitive Sciences, 7, 483-488.
Weber, E. U., Goldstein, W. M., & Barlas, S. (1995). And let us for forget memory: The role
of memory processes and techniques in the study of judgment and choice. In J.
Busemeyer, D. L. Medin, & R. Hastie (Eds.), The Psychology of Learning and
Motivation (Vol. 32): Decision making from a cognitive perspective (pp. 33-81). San
Diego, CA: Academic Press.
P., & Lichtenstein, S. (Eds.), The construction of preference. New York: Cambridge
University Press.
Windschitl, P. D., & Wells, G. L. (1998). The alternative-outcomes effect. Journal of
Personality & Social Psychology, 75, 1441-1423.
Wu, G., & Gonzalez, R. (1996). Curvature of the probability weighting function.
Management Science, 42, 1676-1690.
Wu, G., & Gonzalez, R. (1999). Nonlinear decision weights in choice under uncertainty.
Management Science, 45, 74-85.
Zipf, G. K. (1949). Human behavior and the principle of least effort. Cambridge, MA:
Author Note
Neil Stewart, Department of Psychology University of Warwick; Nick Chater,
Department of Psychology University of Warwick; Gordon D. A. Brown, Department of
Psychology University of Warwick.
We thank Jerome R. Busemeyer, Dan Friedman, José Quesada, and Stian Reimers with
whom we discussed some of the ideas presented in this article. We also thank Rich Lewis for
collecting the credit and debit data, Alan Garrec for help collecting the numerical probability
equivalents, and Stian Reimers for his idea of using Google as a data source for the
distribution of temporal intervals. This research was supported by Economic and Social
Research Council grants L328253039 and RES-000-22-0918.
Correspondence concerning this article should be addressed to Neil Stewart
Department of Psychology, University of Warwick, Coventry, CV4 7AL, UK. E-mail
Table 1
Best Fitting Powers for Power-Law Fits to the Distribution of Delays in Several Corpora
Source Range Best-Fitting Power
Telegraph 30 days -1.7
Google hits 1 year -1.5
Frankfurter Allgmeine Zeitung NRC/Handelsblad
International Herald Tribune (Pollmann & Baayen,
2001)
Table 2
Judged Numerical Equivalents and BNC Frequencies of Probability Phrases.
Judged numerical equivalents BNC frequency
Phrase M SD Mdn IQR Raw
frequency probability usesProportion of frequencyAdjusted
impossible 0.00 0.00 0.0 0.0 6170 1.00 6170
not possible 0.00 0.00 0.0 0.0 1217 1.00 1217
no chance 0.00 0.00 0.0 0.0 534 .60 320
never 0.00 0.00 0.0 0.0 48217 .80 38574
extremely doubtful 3.76 2.81 3.0 3.0 20 .95 19
almost impossible 3.79 3.19 2.5 4.0 486 .90 437
pretty impossible 5.36 5.86 3.0 7.5 2 1.00 2
almost unfeasible 6.33 6.14 5.0 8.0 0 .00 0
highly unlikely 7.11 5.08 5.0 5.0 172 1.00 172
highly improbable 7.31 5.17 5.0 5.0 27 1.00 27
very doubtful 8.08 5.73 5.0 5.0 66 .95 63
very unlikely 8.25 4.58 9.5 5.0 157 1.00 157
little chance 11.75 7.38 10.0 10.0 273 .80 218
faint possibility 11.89 8.71 10.0 15.0 7 1.00 7
pretty doubtful 13.20 8.57 10.0 12.25 1 1.00 1
improbable 13.28 11.22 10.0 15.0 340 1.00 340
small chance 14.43 8.03 10.0 10.0 20 .95 19
not very feasible 14.51 9.63 10.0 12.5 0 .00 0
not likely 15.38 10.23 15.0 15.0 455 1.00 455
slight possibility 16.22 10.98 15.0 12.0 3 1.00 3
doubtful 16.75 10.72 15.0 15.0 1303 .25 326
quite doubtful 17.00 9.51 20.0 10.0 1 1.00 1
pretty unlikely 17.08 10.17 15.0 15.0 6 .83 5
unlikely 17.38 11.55 15.0 17.5 5099 1.00 5099
not very likely 17.72 11.71 15.0 15.0 18 1.00 18
rather unlikely 19.53 12.71 20.0 20.0 17 1.00 17
slight chance 20.93 17.01 15.0 21.3 5 1.00 5
slight probability 21.48 16.22 15.0 20.0 0 .00 0
against the odds 23.46 17.04 20.0 35.0 48 .20 10
a chance 28.49 17.97 25.0 29.0 3093 .22 680
little likely 29.58 18.07 25.0 21.3 2 1.00 2
a possibility 32.85 20.12 30.0 35.0 638 .70 447
uncertain 37.63 16.39 45.0 26.3 4608 .15 691
possible 42.69 16.24 50.0 20.0 31550 .20 6310
Judged numerical equivalents BNC frequency
Phrase M SD Mdn IQR Raw
frequency probability usesProportion of frequencyAdjusted
little uncertain 42.87 23.72 40.0 30.0 16 .13 2
maybe 45.66 10.28 50.0 10.0 6064 .20 1213
even odds 50.00 0.00 50.0 0.0 4 .25 1
fifty-fifty chance 50.00 0.00 50.0 0.0 9 1.00 9
toss-up 50.00 0.00 50.0 0.0 13 0.46 6
medium likelihood 50.00 0.00 50.0 0.0 0 .00 0
fair chance 53.22 11.77 50.0 10.0 57 .35 20
fair possibility 53.86 10.17 50.0 10.0 0 .00 0
fair probability 58.98 13.85 50.5 20.0 0 .00 0
quite possible 59.93 16.39 60.0 20.0 234 .60 140
more likely 63.90 9.36 60.0 10.0 3556 .00 0
probable 64.26 9.88 65.0 10.0 1177 .90 1059
good possibility 66.31 14.14 65.0 15.0 2 1.00 2
good chance 69.08 9.07 70.0 10.0 366 .75 275
likely 69.70 13.20 70.0 20.0 16733 .85 14223
good probability 71.90 10.14 70.0 20.0 1 1.00 1
usually 74.15 10.96 75.0 15.0 18619 .85 15826
rather likely 74.25 9.88 75.0 11.3 1 1.00 1
very feasible 74.26 10.15 75.0 10.0 3 .00 0
most of the time 78.74 10.78 80.0 15.0 580 .95 551
high likelihood 79.73 8.50 80.0 16.3 5 1.00 5
fairly certain 79.83 12.16 85.0 20.0 56 1.00 56
great likelihood 80.82 9.64 80.0 12.5 1 1.00 1
high possibility 80.93 7.30 80.0 11.0 1 1.00 1
most likely 81.05 11.86 80.0 15.0 1341 .00 0
very likely 81.53 8.05 80.0 13.5 296 .85 252
great possibility 82.49 8.04 80.0 10.0 1 1.00 1
quite certain 82.85 10.27 85.0 15.0 97 .90 87
pretty certain 85.30 9.19 89.5 10.0 45 1.00 45
very certain 89.78 7.35 90.0 11.3 15 .87 13
almost certain 92.32 5.76 95.0 5.0 1694 1.00 1694
most definitely 95.13 5.32 95.0 7.8 109 .20 22
sure thing 97.53 4.34 100.0 5.0 27 .35 9
always 100.00 0.00 100.0 0.0 41869 .90 37682
absolute certainty 100.00 0.00 100.0 0.0 37 .40 15
certain 100.00 0.00 100.0 0.0 36121 .25 9030