Review of rational (total) nonlinear dynamic system modelling, identification and control
Quanmin Zhu*
Department of Engineering Design and Mathematics, University of the West of England, Frenchay Campus, Coldharbour Lane, Bristol, BS16 1QY, UK
*Corresponding Author Yongji Wang
School of Automation, Huazhong University of Science and Technology Wuhan, China, 430074
Dongya Zhao
College of Chemical Engineering, China University of Petroleum, Qingdao, China, 266580
Shaoyuan Li
Department of Automation, Shanghai Jiao Tong University, Shanghai, China, 200240
Stephen A Billings
Department of Automatic Control and Systems Engineering, University of Sheffield Mappin Street, Sheffield, S1 3JD
Abstract
This paper is a summary of the research development in the rational (total) nonlinear dynamic modelling over the last two decades. Total nonlinear dynamic systems are defined as those where the model parameters and input (controller outputs) are subject to nonlinear to the output. Previously this class of models has been known as rational models, which is a model that can be considered to belong to the Non-linear AutoRegressive Moving Average with eXogenous input (NARMAX) model subset and is an extension of the well-known polynomial NARMAX model. The justification for using the rational model is that it provides a very concise and parsimonious representation for highly complex non-linear dynamic systems and has excellent interpolatory and extrapolatory properties. However model identification and controller design are much more challenging compared to the polynomial models. This has been a new and fascinating research trend in the area of mathematical modelling, control and applications, but still within a limited research community. This paper brings several representative algorithms together, developed by the authors and their colleagues, to form an easily referenced archive for promotion of the awareness, tutorial, applications, and even further research expansion.
Key words: rational (total) nonlinear dynamic systems, nonlinear rational model set, identification, validation, U-model and U-control
The Non-linear AutoRegressive Moving Average with eXogenous input (NARMAX) model set has been extensively studied in theory (Sontag 1978, Chen and Billings 1989, Haber and Unbehauen 1990) and gradually adopted in applications (Proll and Karim 1994, Wang 1994). There are two main streams of sub-model sets, polynomial and rational models. A polynomial NARMAX model is defined as linear in the parameters and non-linear in the regression terms, and can be used to represent a wide range of linear and non-linear systems. The advantage for identification of polynomial models comes from the fact that the model is linear in the parameters. The rational model (Sontag 1979, Billings and Chen 1989, Billings and Zhu 1991) represents an extension of the polynomial model set, and is defined as a ratio of two polynomial expressions. Therefore rational model is non-linear in both the parameters and the regression terms. This is induced by the denominator polynomial. Accordingly the identification and control of rational models are more challenging based on the total nonlinear structures.
Rational models have been gradually adopted in various applications of non-linear system modelling and control (Ford, Titterington, and Kitsos 1989, Ponton 1993, Kambhampati, Mason, and Warwick 2000), particularly the importance of modelling of chemical kinetics has increased sharply as a consequence of the applicability of modelling of catalytic reactions (Dimitrov and Kamenski 1991, Kamenski and Dimitrov1993). Rational models are not only alternative expressions in approximating a wide range of data sets in chemical engineering, but also are a class of mechanistic models, which most previous experience or theoretical considerations had not put forward (Dimitrov and Kamenski 1991).
A number of methodologies and algorithms have been developed for rational model structure detection, parameter estimation, and correlation based validity tests. These include a prediction error estimator (Billings and Chen 1989), generalised least squares estimators (Billings and Zhu 1991, Zhu and Billings 1991, 1993), recursive least squares parameter estimator (Zhu and Billings 1993), orthogonal model structure detection and parameter estimation algorithm (Billings and Zhu 1994a), genetic model structure detection algorithm (Billings and Mao 1998), back propagation parameter estimator (2003), implicit least squares parameter estimator (Zhu 2005), correlation based model validity tests (Billings and Zhu 1994b, 1995, Zhang, Ashley, and Zhu 2007, Zhu, Zhang, and Ashley 2007).
It should be noted that so far it is still an open research question on how to design rational model based control systems analytically. It is hoped that the U-model framework explained in this paper will provide a concise analytical solution in future studies.
validating identified linear and nonlinear models including neural networks and fuzzy logic models. In section 6, both U-model and U-control are explained conceptually, in terms of the U-transform, for control system design. In section 7, a brief conclusion is drawn to summarise the results.
2 Extended least squares (ELS) algorithm for parameter estimation (Billings and Zhu 1991)
2.1 Rational (total) model
Rational or total nonlinear dynamic systems can be mathematically described with a ratio of two polynomials, and are sometimes commonly known as rational models
( )) ( ),... 1 ( ), (
),... 1 ( ), (
),... 1 (
) ( ),... 1 ( ), (
),... 1 ( ), (
),... 1 ( ) ( ) (
) ( ) ( ) ( ˆ )
( e t
n t e t
e n t y t
y n t u t
u b
n t e t
e n t y t
y n t u t
u a t e t b
t a t e t y t y
de dy
du
ne ny
nu
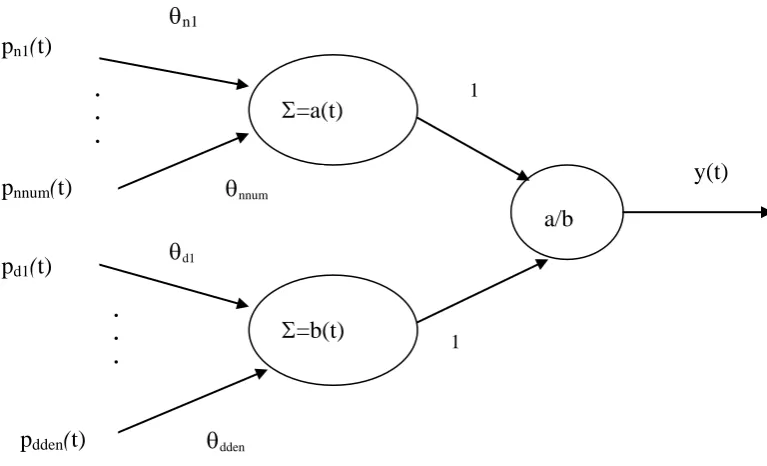
(2.1) where y(t) and yˆ(t)are the measured and one step ahead predicted model outputs respectively, u(t) is the input, e(t) is the model error, and t (= 1, 2, …) is the time index. Generally the numerator a(t) and denominator b(t) are functions of past inputs, outputs, and errors, and can be expressed in terms of polynomials.
den
j
dj dj num
j
nj nj
t p t
b
t p t
a
1 1
) ( )
(
) ( )
(
(2.2)
The regression terms pnj(t) and pdj(t) are the products of past inputs, outputs, and
errors, such as u(t1)y(t3) , u(t1)e(t2) , y2(t1) , and nj , dj are the associated parameters. The task of model structure detection is to select candidate regression terms from a pre-assigned large candidate base. The task of parameter estimation, for a given or detected model structure, is to estimate the associated parameters from the measured inputs and outputs. Model validation is the final step to diagnose the feasibility of an identified model if it is a real representative of the underlying system. The correlation based model validation uses data sequences of input, output, and residual (difference between measured system output and model predicted output) to form a series of correlation functions to determine if the residual has been reduced to an uncorrelated sequence with zero mean and finite variance. Several remarks relating to the characteristics of the rational model of (2.1) are noted below:
also a type of rational model. When the centres and widths are estimated this can become a rational model parameter estimation problem.
2) The rational model can be much more concise than a polynomial expansion, for example
1 ( 1) ( 1)
) 1 ( ) 1 ( 1 ) 1 ( )
( 2 2 4
u t y t y t
t y t u t y (2.3)
3) The rational model can be frequently used to represent complicated system structures with a fairly low degree in both the numerator and denominator polynomials. For example, large and quick deviations in a system output, can be expressed as ) 1 ( 1 1 ) ( t u t y (2.4)
When u(t-1) approaches –1, the model output response will be quickly increased. The power to capture quick and large changes is gained by introducing the denominator polynomial.
2.1 Bias analysis using the ordinary LS algorithm
Directly estimating parameters of model (2.1) is difficult in formulation and time consuming in computation even though a prediction error algorithm has been developed (Billing and Chen 1989). This is because the model is nonlinear in the parameters. An alternative approach is to multiply the denominator polynomial out (2.1) to yield a model expressed as linear in the parameters, then least squares algorithms can be applied with proper reformulation. To this end, multiplying the denominator b(t) on both sides of (2.1) and then moving all the terms except the first term y(t)pd1(t)d1 on left hand side to the right-hand side gives
) ( ) ( ) ( ) ( ) ( ) ( ) ( ) ( ) ( ) ( ) ( ) ( 2 1 2 t t t t p t y t p t e t b t p t y t a t Y den j dj dj num j nj nj den j dj dj
(2.5) where
) ( ) ( ) ( ) ( ) ( ) ( ) ( ) ( ) ( ) ( ) ( ) ( genrality) loosing (without 1 ) ( ) ( ) ( 2 1 2 1 1 1 1 t e t b t t y t p t y t p t p t p t t t t p t y t Y dden d nnum n d n T dden d nnum n d n d d d (2.6)unbiased. If noise (even white noise) exists, a very practical situation, directly using least square algorithms will give biased estimates; simply the noise contaminated output appears in both the dependent variable and regression terms associated with the denominator polynomial b(t). This problem will be discussed and resolved in the next section.
2.2 ELS parameter estimation
This has been derived into following least squares formulation (Billings and Zhu 1991)
2
1 Υ 2
ˆ
e T e
T
(2.7)
Where
ˆ is the estimate of parameter vector , 2
e
is the model error variance, is the regressor matrix and formulated with data length N
) ( )
1 (
) ( )
1 (
N N
T d T
d
T n T
n T
(2.8)
is the dependent variable vector and composed of
TN Y Y(1) ( )
(2.9)
is the error matrix associated with T
and formulated as
( ) ( )
) ( )
( ) ( 0
0 0
2 1
t p t
p t p t
p t
p d d dden
N
k
d T d
(2.10)
is the error vector associated with TΥ
and formulated as
N
k
d T
d t p t
p 1
1( ) ) (
0
(2.11)
An iterative procedure has been developed to obtain the unbiased parameter estimates, which is listed below:
Step 2, Compute the model error sequence by
) ˆ , (
) ˆ , ( ) ( ) (
b a t y t
e . Then estimate
the model error variance by 2 1
e2(t) Ne
.
Step 3, update matrices and , vectors TY and through formulations (2.8) to (2.11).
Step 4, use the extended least squares algorithm (2.7) to estimate parameter vector ˆ . Step 5, Go back to step 2 and repeat until the parameter estimate vector ˆ and model error variance 2
e
converge to constant values. 2.3 Statistics of the estimator
The bias and variance of the estimates have been analysed (Zhu and Billings 1991) in case of model error e(k) is reduced to an uncorrelated noise sequence, which are given as follows.
( ), [*]is theexpectationfunction , 1, )
ˆ (
0 ) ˆ (
2 2
2 1
2 2
2 E t b E
for Cov
Bias
b
e e
T b e
(2.12)
2.4 Summary
Expressing the rational model in terms of a linear in the parameters model makes it possible to use least squares algorithms for parameter estimation, on the other hand the expansion induces inherent correlated errors to give biased estimates while existing linear squares algorithms are applied directly. Therefore the extended least squares algorithm has been developed to set up a basis for concise and unbiased rational model parameter estimation from data sequences.
3 Back propagation (BP) algorithm for parameter estimation (Zhu 2003) 3.1 BP parameter estimation
To derive the parameter estimation algorithm, with reference to model expressions of (2.5) and (2.6), define the error between the measured output and the model output as
2) ( ˆ ) ( 2 1 )
(t y t y t
e (3.1)
The task is to determine a set of parameters in model (2.5) so that the squared error in (3.1) is minimised. The parameter determination can be described as parameter training when the model is interpreted as a neural network structure. To train the parameters njassociated with the numerator polynomial a(t), the local gradients are given by
( ) ) ( 1 ) ( ˆ ) ( ) ( ) ( ) ( ) ( ˆ ) ( ) ( t p t b t y t y t a t a t e t y t y t e nj nj nj (3.2)
To train the parameters djassociated with the denominator polynomial b(t), the local gradients are given by
( ) ) ( ) ( ) ( ˆ ) ( ) ( ) ( ) ( ) ( ˆ ) ( ) (2 p t t b t a t y t y t b t b t e t y t y t e dj dj dj
(3.3)
To carry out recursive computation, a time index k is introduced to the parameter sets )
(k
nj
and dj(k) as they are updated following the time sequence. Convergence has
been proved with dj dj
k nj nj
klim (k) lim (k) (Zhu 2003). Therefore the
parameter variation at time k+1 can be defined as follows
) 1 ( ) 1 ( ) ( ) 1 ( ) 1 ( ) 1 ( ) 1 ( ) ( ) 1 ( ) 1 ( k k e k k k k k e k k k dj dj dj dj dj nj nj nj nj nj (3.4)
where nj and djare the learning rates.
The integrated parameter estimation procedure can be summarised in terms of the BP computation as follows:
I Initialisation
Set all model parameters to uniformly distributed random numbers with zero mean and small variance, or set up the initial parameters using the prior information extraction techniques, such as a least squares estimator.
II Parameter estimation
For l = 0 to L-1 (epoch number)
) 1 ( ˆ ) 1 ( ) 1 ( ) 1 ( ) 1 ( ) 1 ( ˆ ) ( ) 1 ( ) 1 ( ) ( ) 1 ( ) 1 ( 1 1
k y k y k e k b k a k y k k p k b k k p k a den j dj dj num j njnj
(3.5) Backward computation ) 1 ( ) 1 ( ) 1 ( ) 1 ( ) 1 ( ) 1 ( ) 1 ( ) 1 ( 1 ) 1 ( ) 1 ( ) 1 (
2
k p k b k a k e k k e k p k b k e k k e dj dj nj nj (3.6) ) 1 ( ) 1 ( ) ( ) 1 ( ) 1 ( ) 1 ( ) ( ) 1 ( k k e k k k k e k k dj dj dj dj nj nj nj nj (3.7) end end Initialisation
The first step in the above computation is to initialise the parameters. A sensible choice will provide tremendous help for the resultant parameter estimation. A wrong choice of the initial parameters can lead to two critical phenomena, premature saturation and divergence. In the case of premature saturation, the instantaneous sum of squared errors remains almost constant for some period of time during the learning process. In the case of divergence, the sum of squared errors tends to become very large. A general initialisation technique (Haykin 1994) is to uniformly randomise the initial parameters with zero mean and small variance. In this study, the initial parameters will be determined using a prior information extraction technique. Since the model structure is assumed to be known in advance, an ordinary or extended least squares algorithm can be applied to obtain initial estimates. Although biased they should not be far away from the true parameters in Euclidean distance.
Learning rate
The BPE algorithm provides an approximation to the trajectory in parameter space computed in terms of steepest descent. The smaller the learning rate, the smaller the change to the model parameters will be from one iteration to the next and the smoother the trajectory will be in parameter space. However a small learning rate will possibly cause slower convergence of the parameter estimation. If the learning rate is set too large, the estimator may become unstable. The choice of learning rates is discussed below: i) Constant 2 1 constant constant dj nj (3.8)
ii) Inversely decayed sequence
k k k dj
nj
1 ) ( )
(
(3.9)
The disadvantage is that the learning rate decays too fast and this may not be suitable when long training data sequences are available.
iii) Generalised delta rule (Rumelhart, Hinton, and Williams 1986, Jacobs 1988)
( ) ( 1)
)1 (
) 1 ( )
( ) 1 (
) 1 ( ) ( )
1 (
) 1 ( )
( ) 1 (
k k
k k e k
k
k k
k k e k
k
dj dj
dj dj
dj dj
dj
nj nj
nj nj
nj nj
nj
(3.10)
where njand dj are positive numbers called momentum constants. This has been extensively studied and can increase the learning rate and avoid instability. However, this choice involves more computation and requires the know-how to set up the parameters njand dj.
iv) Linearly decayed sequence
To overcome the above disadvantages, a new learning rate sequence has been proposed as follows (Zhu 2003)
00 ) ( )
(
lNk
LN k
k dj end
nj (3.11)
where L is the number of iteration epoch, N is the training data length, l (= 0, …, L-1) for the lth epoch, and 0 end are positive constants for the initial and end learning rates respectively. Figure 2 shows the learning rate variation.
Stopping criterion
Two criteria (Kramer and Sangiovanni-Vincentelli 1989) have been used to stop neural network training. These are formulated by means of local or global minimum of the error surface.
i) Gradient stopping criterion
This states that the BP converges when the Euclidean norm of the gradient vector reaches a sufficiently small gradient threshold. The drawback of this criterion is longer training and complexity in the computation of the gradient vector.
ii) Error measure stopping criterion
To overcome the above drawbacks, a higher order correlation test (Billings and Zhu 1994b, 1995), introduced for non-linear model validation, can be used as a stopping criterion. The tests are described below:
2 2 ___ 2 2 1 2 ___2 2 2
1 1 ___ 2 2 1 2 ___
2 2 2
1 1 ( ) ( ) ( ) ( ) ( ) ( ) ( ) ( ) ( ) ( ) N t e N N t t N t u N N t t
t e t e
R
t e t e
t u t u
R
t u t u
(3.12) where 1 ___ ___2 2 2 2
1 1 1 ( ) ( ) ( ) ( ) 1 1 ( ) ( ) N t N N t t
t y t e t t
N
u u t e e t
N N
(3.13)When the higher order correlation functions Re2( ) and Ru2( ) satisfy
2
2
0 0
( )
0
( ) 0
e u k R otherwise R (3.14)
the estimated parameters are considered to be unbiased. Otherwise the training procedure will continue until the above conditions are satisfied. In practice the 95% confidence limits, 1.96/ N , are used as the stopping thresholds.
3.2 Statistics of the estimator For the bias
( 1) 0) 1 ( ) 1 ( ) 1 ( ) 1 ( 0 ) 1 ( ) 1 ( 1 ) 1 ( ) 1 (
2
k p k b k a E k e E k E Bias k p k b E k e E k E Bias nj dj dj dj nj nj nj nj (3.15)
2
2 22 2 2 ) 1 ( ) 1 ( ) 1 ( ) 1 ( dj e dj dj dj nj e nj nj nj k E k E Var k E k E Var (3.16) where 2 2 2 2 2 ) 1 ( ) 1 ( ) 1 ( ) 1 ( ) 1 ( 1 k p k b k a E k p k b
E nj dj dj
nj
(3.17)
Therefore the variance of each parameter estimate is associated with the noise variance and the second order moment of the regression term.
3.3 Summary
The BP based algorithm provides an alternative approach to estimate rational model parameters. Obviously there is no need to expand rational models into linear in the parameters expressions. Some techniques such as learning rate and stopping threshold play important roles in the iterative training and learning process, which need to be carefully considered in the computations.
4 Orthogonal Least Squares (OLS) algorithm for term selection and parameter estimation (Zhu and Billings 1993, Billings and Zhu 1994)
4.1 Orthogonal parameter estimation
Consider an orthogonal transformed expression of (2.5)
1 2 1 2 ( ) ( ) ( ) ( ) ( ) ( ) ( ) ( ) ( ) ( ) ( ) num den
nj nj dj dj
j j
num den
nj nj dj dj
j j
Y t p t y t p t t
t G t
w t g y t w t g t
(4.1) where
1 2 1 2( ) n( ) d( ) n ( ) nnum( ) d ( ) ( ) dden( ) ( )
T
n d n nnum d dden
t t t t t t y t t y t
G G G g g g g
(4.2)
1 . . . 0 0 . . . . . . . . . . . . . . 1 0 0 . . . . 1 0 . . . 1 ) ( ) 1 ( ) ( ) 1 ( ) ( ) 1 ( 1 1 12 1 n n n T d T d T n T n T T T t t t T N N N W T W (4.3)where is the regressor matrix defined in (2.8). There are several typical algorithms to compute the elements of T, such as Gram-Schmidt, Householder, or Givens transforms (Billings and Zhu 1994a). The orthogonality of the matrix W gives
n nnum d dden
TW D diagd d d d
W 1 2 (4.4)
The unbiased parameter vector G is estimated with
e orth
T orth e T W W W
Gˆ 2 1 Υ2 (4.5)
where
Tdden d d d nnum d n d orth dden d nnum n orth e p e p e p e p e e e e diag 1 2 1 1 1 1 2 2 2 2 2 1 (4.6)
where over bar denotes time average value. The computation of the elements in (4.6) can be found in (Zhu and Billings 1993). Accordingly the original parameter vector in (2.5) can be recovered by
G T1
(4.7)
4.2 Structure detection (term selection)
) ( 1 ) ( 1 2 2 2 2 2 2 2 2 2 2 2 2 2 2 2 2 2 2 2 2 2 2 2 2 2 2 k b N k Y N b e g e g w g err b e g e g w g err b Y b Y e dj dj e dj dj b Y dj dj dj b Y e nj nj e nj nj b Y nj nj nj (4.8)It should be noticed that the larger the ERR, the more contribution of its regression term to reduce the estimation errors. Therefore the candidate term with the largest ERR in each selection sequence should be taken in as the model regression terms. An iterative learning procedure for rational structure detection has been developed as follows:
Step 1, Fit a deterministic rational model (that is no noise model) initially with 3 to 4 regression terms (choice of the terms comes from experience, actually it is not critical) in numerator and denominator polynomials respectively. Therefore the model error sequence e(t) and its variance 2
e
can be approximately obtained.
Step 2, Set up a series of ascending weights of the model variance 2
e
(such as 0.1, 0.25, 0.5 0.75, 0.95, 1, 1, …, 1). Set up a cut-off point (COP), which can be determined by trail and error approach, as
r terms denonimato 2 terms numerator 2 1 1 2 2 2 2 2 2 2 2 2 2 2 2 2 b Y e dj dj dj dj b Y e nj nj nj nj Y e b b e g e g b e g e g err bias err bias COP (4.9)Step 3, Do a search through a pre-set-up full rational model candidate term base to select significant terms according to the ERR values and estimate their associated parameters.
Step 4, Repeat steps 2 and 3 until the computations converge, the preset maximum number of the iterations exceeded, or a specified number of terms are selected in the model.
4.3 Summary
This algorithm delivers a more realistic procedure to fit models to data in case of which terms should be included in the models before estimating their associated parameters.
5.1 Introduction to correlation based model validation
Consider a generalised single input and single output (SISO) nonlinear parametric model.
1 1 1 ˆ
ˆ
( ) ( ) ( ) ( t , t , t ) ( )
y t y t t f y u ε t (5.1)
where fˆ() is the identified nonlinear model. yt1, ut1, and εt1 are measured output, input and residual (the difference between the measured output and the one step ahead model predicted output) vectors with delayed elements from 1 to r respectively. It should be noticed that when above model is properly identified, the residual ( ) t should be reduced to a random noise sequence denoted by e(t) in this section (without being confused with those used in other sections) with zero mean and finite variance (Billings and Zhu 1994). In other words, the residual sequence from a properly identified model should be uncorrelated to the delayed residuals, inputs and outputs (Ljung, 1999).
It should be noticed that all validation methods developed based on nonlinear models have included all linear model validation as their simplified cases. However the linear model based validation test methods can and often do fail when applied to nonlinear model validation.
5.2 Combined ODACF and ODCCF for model validation
Combined omni-directional auto-correlation functions (ODACF) is defined as follows,
) min( ) ( ) max( ) ( ) min( ) max( R else R R R if (5.2)
Combined omni-directional cross-correlation functions (ODACF) is defined as follows, ) min( ) ( ) max( ) ( ) min( ) max( u u u u u u R else R R R if (5.3)
In the above definition
)] ( ), ( ), ( ), ( [ )] ( ), ( ), ( ), ( [ ' ' ' ' ' ' ' ' ' ' ' ' ' ' ' ' u u
u r r r r
where r**() denotes correlation function and the prime ’ in (5.4) to (5.5) denotes that the mean level has been removed from the corresponding data sequence.
Then the validity tests for a properly identified model are derived as
otherwise
, 0 ) (
0 , 1 ) (
(5.6)
u( )0, (5.7)
Compared with the other correlation tests based methodologies, this approach enhances the power of nonlinear model validity tests and significantly reduces the number of correlation plots. For large N the correlation function estimates given in (5.2) and (5.3) are still asymptotically normal with zero mean and finite variance in accordance with the central limit theorem (Bowker and Lieberman 1972). The standard deviations are 1 N and the 95% confidence limits are therefore approximately at 1.95 N .
5.3 Summary
It should be mentioned that the method is not only applicable to rational models, but also for validation of identified neural networks and fuzzy logic models (Zhang, Zhu, and Ashley 2009).
6 U-model and U-control (Zhu 1989, Zhu and Guo 2002) 6.1 Introduction
So far almost all control system design approaches, no matter if they are linear or nonlinear plant based, have taken a unique procedure, set up a specified control system performance/index and then by inverting the integrated function of the plant and design performance in some way, obtain the controller output (that is the input to the plant). There is no problem at all with such procedures for all linear plant based control system design subject to stability considerations, because the linear superposition principle makes the inverse function easily resolved. However when the plants are subject to nonlinear dynamic equations (particularly non-affine models), the inverse functions are more complicated, intractable, or even impossible with analytical solutions, except step by step numerical computations.
Research question one: Can a class of nonlinear dynamic plants, described by smooth nonlinear models in terms of polynomials, be designed directly using the approaches developed from linear control systems?
Research question two: Is there a general approach to resolve the inverse function of nonlinear plants?
time the U-model was named in a study of pole placement controller design for nonlinear plants was by Zhu and Guo (2002), which is a simple mapping from ordinary linear and nonlinear difference equations to time-varying polynomials in terms of the plant input u(t-1) (that is the controller output). The U-model covers almost all existing smooth nonlinear discrete time models as subsets.
Since then, within the first decade, the U-model has been used in designing feedforward control of MIMO nonlinear systems (Ali, Fouad, Muhammad, and Jamil, 2010), Nonlinear leaking minimum square algorithm for inverse adaptive control (Butt, Muhammad, and Tahir, 2005), minimum square error IMC (internal model control) (Muhammad and Haseebiddon, 2005) and General Predictive Control of nonlinear plants (Du, Wu and Zhu, 2012) have also been investigated. It should be noted that the U-model associated publications are still in a very beginning stage. These have had no rigorous analytical description and top journal publication till today.
The other research question: How is the U-model design procedure different from classical procedures in terms of efficiency and effectiveness?
The questions have been the justification for initiating the study. Xu, Zhu, Zhao and Li (2013) have presented a comprehensive survey for the first decade of development on U-model based control system design.
6.2 U-model
Consider a general single input and single output (SISO) discrete time dynamic plant described by the following Polynomial model (P-model).
( ) ( (*), )
(*) ( ( 1) ,..., ( ), ( 1) ,..., ( )) y t f P
P P y t y t n u t u t n
(6.1)
where y t( )R and u t( 1) R are the output and input signals of the plant respectively at discrete time instant t(1, 2, …), n is the plant order. .
1 (*) ( ( 1) ,..., ( ), ( 1) ,..., ( )) L
P P y t y t n u t u t n R is the regression variable vector spanned from the delayed outputs and inputs and [ 0 ] L 1
L R
is the
associated parameter vector. Function f() is a smooth linear or non-linear function. The P-model can be further expressed in terms of regression equation as below
0
( )
( )
L
l l
l
y t
p t
Where the regression terms p tl( ) are the products of past inputs and outputs such as ( 1) ( 3)
u t y t , (u t1) (u t2) , y t2( 1) , and l are the associated parameters. Typically, for example, linear time invariant difference equation based plant models and NARMA (nonlinear auto-regressive moving average) models.
2
( ) ( (*), U( 1))
(*) ( ( 1) ,..., ( ), ( 2) ,..., ( ), )
U( 1) ( 1) ( 1) M( 1)
y t f t
y t y t n u t u t n
t const u t u t u t
Correspondingly its regression equation is given as below
0
( )
( )
(
1)
M
j j j
y t
t u t
(6.2)This is expanded from the above nonlinear function f(.) as a polynomial with respect to u(t-1). where M is the degree of model input u(t1), parameter j( )t is a function of past inputs, outputs (u(t-2), …, u(t-n), y(t-1), …, y(t-n)), and the parameters
0
( L).
6.3 U-control --- U-model based control system design procedure Define the desired plant output asU t( ), it is clear that setting
( )
( )
y t
U t
(6.3) then0
( )
( )
(
1)
M
j j j
U t
t u t
(6.4)Accordingly the task of the design is to determine the desired plant output U t( ) according to a specified performance index, for example,
Pole Placement Control (PPC) (Zhu and Guo 2002)
General Predictive Control (GPC) (Du, Wu, and Zhu 2012)
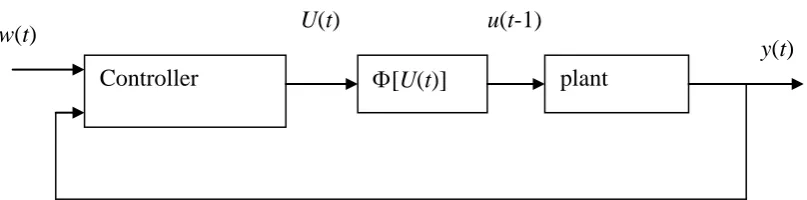
then by resolving one of the roots of (6.4) to obtain the controller output. The block diagram, Figure 3 shows a general U-model based closed loop control system structure. It should be noted that so far it is still an open research question of how to use the U-model approach to design rational model based control systems. Therefore fundamental research should be performed in the future research development.
6.4 Summary
Design of nonlinear dynamic control systems has been a widely recognised as a challenging issue. The key point in the design is a general model prototype with
( ) ( ) ( )
RU t Tw t Sy t
T T
p d d
conciseness, flexibility and manipulability while keeping little loss of precision. This is the origin of the U-model with insight and procedure. In terms of time-varying parameter polynomials, the U-model almost covers all existing smooth nonlinear discrete time models as its subsets. Based on the U prototype, without complex transformation to its original model and no need for linearization at all, a nonlinear control system can be directly designed by linear control system design approaches, , such as Pole Placement Control (PPC), general predictive control (GPC), Sliding Mode Control (SMC), and so on. Even for linear control system design, the U-model provides another procedure for solutions.
The major contribution of the U-model based design procedure can be listed in order 1) In methodology, those well-known approaches developed from linear systems
can be directly applied to nonlinear control system design, which significantly reduces the design complexity and effectively provides straight forward computational algorithms.
2) In design, it obtains desired plant output first (compared to designing desired controller output in classical framework) and then works out the controller output from U-model in a relaxed root-resolving routine (compared to resolving complex solutions from the inverse of the whole designed systems). 3) For linear control system design it provides new insight and solutions within a
more general and effective frame work. 7 Conclusions
With regard to the presented algorithms, the ELS algorithm sets up a solid and concise basis for expanding this classical approach into nonlinear rational model term selection and parameter estimation. The insight presented in the study could be a useful indication to stimulate other complex model identification with proper extension of classical least squares algorithms. The BP algorithm provides a different angle to study the model parameter estimation issues. However the model structure detection via PB computation (i.e. regression term selection) still remains unresolved. The OLS algorithm provides a step by step procedure to select model regression terms and estimate their associated parameters simultaneously. The new model validation method provides a generic routine to effectively examine the model validity with significantly reduced correlation plots. In control system design, the U-model and hence U-control provide a new procedure from a classical framework, which could provide a concise solution for rational model based control systems design in the future studies. It should be noted again that the structure of the rational model brings various advantages, which cannot be easily contributed through polynomial model sets. On the other hand the rational model presents a number of new challenges for research, demonstration and applications.
Acknowledgement
References
Ali, S.S.A., Fouad, M.A., Muhammad, S., and Jamil, M.B., U-model based learning feedforward control of MIMO nonlinear systems, Electrical Engineering, 91(8), pp. 405-415, 2010.
Billings, S.A. and Chen, S., Identification of non-linear rational systems using a prediction error estimation algorithm, Int. J. Sys., Science, Vol. 20, pp. 467-494. 1989. Billings, S.A. and Mao, K.Z., Structure detection for nonlinear rational models using genetic algorithms, Int. J. Sys. Science, Vol. 29, pp. 223-231, 1998.
Billings and Woon, W.S.F., Structure detection and model validity tests in the identification of nonlinear systems, IEE proceedings, PtD, Vol. 130, pp. 190-199, 1983.
Billings, S.A. and Zhu, Q.M., Rational model identification using extended least squares algorithm, Int. J. Control, Vol. 54, pp. 529-546, 1991; A structure detection algorithm for nonlinear dynamic rational models, ibid., Vol. 59, pp. 1439-1463, 1994a; Nonlinear model validation using correlation tests, ibid., Vol. 60, pp. 1107-1120, 1994b; Model validation tests for multivariable nonlinear models including neural networks, ibid., Vol. 62, pp. 749-766, 1995.
Bowker, A. H., and Lieberman, G. J., Engineering Statistics, Prentice Hall, 1972. Butt, N.R., Muhammad, S., and Tahir, K. An adaptive root-solving controller for tracking of nonlinear dynamic plants, Proceeding of the 2005 IEEE International Conference on Industrial Electronics and Control Applications, Ecuador, pp. 144-149, 2005.
Chen, S. and Billings, S.A., Representations of nonlinear system: the NARMAX model, Int. J. Control, Vol. 48, pp.1013-1032, 1989.
Dimitrov, S.D. and Kamenski, D.I., A parameter estimation method for rational functions, Computers and Chemical. Engineering, Vol. 15, pp. 657-662, 1991.
Du, W.X., Wu, X.L, and Zhu, Q.M., Direct design of U-Model based generalized predictive controller (UMGPC) for a class of nonlinear (polynomial) dynamic plants, Proc. Instn. Mech. Enger, Part I: Journal of Systems and Control Engineering, V 226, pp. 27-42, 2012.
Ford, I., Titterington, D.M., and Kitsos, C.P., Recent advances in non-linear experimental design, Technometrics, Vol. 31, pp. 49-60, 1989.
Haber, R. and Unbehauen, H., Structure identification of nonlinear dynamic system --- a survey on input/output approaches, Automatica, Vol. 26, pp.651---677, 1990. Haykin, S., Neural networks, Macmillan College Publishing Company, Oxford, 1994. Jacobs, R.A., Increased rates of convergence through learning rate adaptation, Neural Networks, Vol. 1, pp.295-307, 1988.
Kambhampati, C., Mason, J.D., and Warwick, K., A stable one-step-ahead predictive control of nonlinear systems, Automatica, Vol. 36, pp. 485-495, 2000.
Kamenski, D.I. Dimitrovl, S.D., Parameter estimation in differential equation by application of rational functions, Comput. Chem. Eng., Vol. 17, pp.643–651, 1993. Kramer, A.H. and Sangiovanni-Vincentelli, A., Efficient parallel learning algorithms for neural networks, In Advances in Neural Information Processing Systems (Touretzky, D.S., ed.), pp. 40-48, San Mateo, CA: Morgan Kaufmann, 1989.
Leung, H. and Haykin, S., Rational function neural network, Neural Computation, Vol. 5, pp. 928-938, 1993.
Ljung, L, Analysis of recursive stochastic algorithms, IEEE, Transactions on Automatic Control, Vol. 22, pp.551-575, 1977.
Ljung, L., System Identification Theory for the User 2nd Edition, Prentice Hall, Upper Saddle River, NJ, 1999.
Muhammad, S. and Haseebiddon, M., U-model-based internal model control for non-linear dynamic plants, Proceedings of the Institution of Mechanical Engineers. Part I: Journal of Systems and Control Engineering, 219(6), pp. 449-458, 2005.
Narendra, K.S. and Parthasapathy, K., Identification and control of dynamical systems using neural networks, IEEE Transactions on Neural Networks, Vol. 1, pp. 4-27, 1990. Ponton, J.W., The use of multivariable rational functions for non-linear data presentation and classification, Computers and Chemical Engineering, Vol. 17, pp.1047-1052, 1993.
Proll, T. and Karim, M.N., Model predictive PH control using real time NARX approach, AIChe J., Vol. 40, pp. 269-282, 1994.
Rumelhart, D.E., Hinton, G.E., and Williams, R.J., Learning representations by back propagating errors, Nature (London), Vol. 323, pp.533-536, 1986.
Wang, L.X, Adaptive fuzzy systems and control, Prentice Hall, Englewood Cliffs, NJ, 1994.
Xu, F.X., Zhu, Q.M., Zhao, D.Y., and Li, S.Y., U-Model based design methods for nonlinear control systems–A survey of the development in the 1st decade, Control and Decision, Vol. 28, No. 7, pp. 961-971, 2013 (in Chinese).
Zhang, L.F., Zhu, Q.M., and Longden, A., A set of novel correlation tests for nonlinear system variables, Int. J. Systems Science, Vol. 38, pp. 47-60, 2007.
Zhang, L.F., Zhu, Q.M., and Longden, A., A correlation-test-based validation procedure for identified neural networks, IEEE Transactions on Neural Networks, Vol. 20, No. 1, pp. 1-13, 2009.
Zhu, Q.M., Identification and Control of nonlinear systems, PhD thesis, University of warwick, UK, 1989.
Zhu, Q.M., Warwick, K., and Douce, J.L., Adaptive general predictive controller for nonlinear systems, IEE Proc. – Control Theory Appl., Vol. 138, No 1, pp. 33-40, 1991. Zhu, Q.M. and Billings, S.A, Recursive parameter estimation for nonlinear rational models, J. Sys. Engineering, Vol. 1, pp. 63-67, 1991; Parameter estimation for stochastic nonlinear models, Int. J. Control, Vol. 57, pp. 309-333, 1993.
Zhu Q.M. and Guo L.Z., A pole placement controller for nonlinear dynamic plants, Journal of Systems and Control Engineering, Proceedings of the Institution of Mechanical Engineers Part I, Vol. 216, No. 6, pp. 467-476, 2002.
Zhu, Q.M., A back propagation algorithm to estimate the parameters of nonlinear dynamic rational models, Applied Mathematical Modelling, Vol. 27, pp. 169-187, 2003.
Zhu, Q.M., An implicit least squares algorithm for nonlinear rational model parameter estimation, Applied Mathematical Modelling, Vol. 29, pp. 673-689, 2005.
Zhu, Q.M., Zhang, L.F., and Longden, A., Development of omni-directional correlation functions for nonlinear model validation, Vol. 43, pp. 1519-1531, Automatica, 2007.
Figure 1 Rational neural network
Figure 2 Linearly decayed learning rate
n1
a/b
=b(t)
=a(t)
nnum
d1
dden
y(t) pn1(t)
pnnum(t)
pd1(t)
pdden(t)
1
1
. . .
. . .
N
2N
L N 0
end
LN slope0 end
learning rate
data sequence
Quanmin Zhu is Professor in control systems at Faculty of Environment and Technology, University of the West of England, Bristol, UK. He obtained his MSc in Harbin Institute of Technology, China in 1983 and PhD in Faculty of Engineering, University of Warwick, UK in 1989. His main research interest is in the area of nonlinear system modelling, identification, and control. His other research interest is in investigating electrodynamics of acupuncture points and sensory stimulation effects in human body, modelling of human meridian systems, and building up electro-acupuncture instruments. Currently Professor Zhu is acting as Member of Editorial Committee of Chinese Journal of Scientific Instrument, Editor (and Founder) of International Journal of Modelling, Identification and Control, and Editor of International Journal of Computer Applications in Technology.
Yongji Wang received the undergraduate degree in Electrical Engineering from Shanghai Railway University, Shanghai, P.R. China, the M.S. degree and the Ph. D degree in automation from Huazhong University of Science and Technology, Wuhan, P.R. China, in 1982, 1984 and 1990, respectively. He has been with Huazhong University of Science and Technology, Wuhan, P.R. China Since 1984, where he is currently a Professor of Control Engineering. His main interest is in intelligent control and autonomous mobile robot, and he has done research in neural network control, predictive control, adaptive control, and most recently, flight vehicle optimal control. Dr. Wang is a member of IEEE, the President of Hubei Automation Association, China, a member of council of the Chinese Automation Association, Standing member of council of Intelligent Robot Committee of Chinese Artificial Intelligence Society. He is an Regional editor (Asia and Pacific) of Int. J. of Modelling Identification and Control.
Dongya Zhao received BEng from Shandong University, Jinan, China, in 1998, MSc from Tianhua Institute of Chemical Machinery & Automation, Lanzhou, China, in 2002 and PhD from Shanghai Jiao Tong University, Shanghai, China, in 2009.
Controller [U(t)] plant
w(t)
y(t) u(t-1)
[image:23.595.134.538.155.255.2]U(t)
He was a research fellow in Nanyang Technological University during 7/2011 to 7/2012. Since 2002, he has been with College of Chemical Engineering, China University of Petroleum, where he is currently an Associate Professor. His research interests include robot control, sliding mode control, process modeling and control, nonlinear system control and analysis.
Shaoyuan LI received the Ph.D degree from the Department of Computer and System Science, Nan Kai University in 1997, he was a Lecture in the Department of Electrical Engineering, Hebei University of Technology, Tianjin from 1994 to 1998, and was with Dept. Automation, Shanghai Jiao Tong University as the post doctorial form 1998 to 2000, since then, he has been with the Department of Automation, Shanghai Jiao Tong University, China, and he is currently full Professor in this Department, and in charge of the Head of this department from 2004 to 2013. His research interest covers system identification and controller tuning, adaptive control, satisfying optimization and predictive control and so on, he is the author or coauthor of four monographs and about two hundred technical papers.