A Nondominated Sorting Genetic Algorithm for Bi-Objective Network Coding Based Multicast
Routing Problems
Authors: Huanlai Xing, Rong Qu
Affiliation: ASAP Group, School of Computer Science, University of Nottingham Corresponding author: Huanlai Xing
Telephone: +(44) 0115 84 66594
E-mail: [email protected]; [email protected]
Address: School of Computer Science, University of Nottingham, Nottingham, NG8 1BB, United Kingdom
Abstract — Network coding is a new communication technique that generalizes routing, where, instead of simply forwarding the
packets they receive, intermediate nodes are allowed to recombine (code) together some of the data packets received from different incoming links if necessary. By doing so, the maximum information flow in a network can always be achieved. However, performing coding operations (i.e. recombining data packets) incur computational overhead and delay of data processing at the corresponding nodes.
In this paper, we investigate the optimization of the network coding based multicast routing problem with respect to two widely considered objectives, i.e. the cost and the delay. In general, reducing cost can result into a cheaper multicast solution for network service providers, while decreasing delay improves the service quality for users. Hence we model the problem as a bi-objective optimization problem to minimize the total cost and the maximum transmission delay of a multicast. This bi-objective optimization problem has not been considered in the literature. We adapt the Elitist Nondominated Sorting Genetic Algorithm (NSGA-II) for the new problem by introducing two adjustments. As there are many infeasible solutions in the search space, the first adjustment is an initialization scheme to generate a population of feasible and diversified solutions at the beginning. These initial solutions help to guide the search towards the Pareto-optimal front. In addition, the original NSGA-II is very likely to produce a number of solutions with identical objective values at each generation, which may seriously deteriorate the level of diversity and the optimization performance. The second adjustment is an individual delegate scheme where, among those solutions with identical objective values, only one of them is retained in the population while the others are deleted. Experimental results reveal that each adopted adjustment contributes to the adaptation of NSGA-II for the problem concerned. Moreover, the adjusted NSGA-II outperforms a number of state-of-the-art multiobjective evolutionary algorithms with respect to the quality of the obtained nondominated solutions in the conducted experiments.
Index Terms — multicast, multiobjective optimization, network coding, Elitist nondominated sorting genetic algorithm (NSGA-II)
1. Introduction
Multicast is a one-to-many communication technique that simultaneously delivers information from the source to a group of destinations (receivers) within the same network so that in a single transmission any receiver is able to obtain the original information sent from the source [38]. With the emergence of increasingly more multimedia applications such as video conferencing and IPTV, multicast has become one of the key supporting technologies in modern communication networks [4][17][18][44].
MAX-FLOW MIN-CUT theorem) the theoretical maximal throughput is always guaranteed [34].
Fig.1 shows a comparison between network coding and traditional routing regarding the average data rate to receivers [46]. Fig.1(a) is a network, where source s multicasts two-bit information (a and b) to node y and node z. Each link can forward a single bit at each time. According to the Max-Flow Min-Cut Theorem, the theoretical maximal multicast throughput is two bits per time. However, as Fig.1(b) illustrates, traditional routing can only obtain an average data rate of 1.5 bits per time unit due to the bottleneck link wx. As can be seen in Fig.1(c), if we allow node w to perform ab
( stands for Exclusive-OR), the receivers both obtain two-bit information at the same time, where original data can be decoded through a(ab) and b(ab). Hence, network coding can always achieve the theoretical maximal multicast throughput.
Fig.1 Traditional routing vs. network coding [46]. (a) The example network. (b) Traditional routing. (c) Network coding.
1.1 Related Work
In network coding based multicast routing problems, the cost of a multicast session is usually considered as a minimization objective. Two types of costs, coding cost caused by coding operations and link cost caused by employing transmission links, have been considered, respectively. One stream of research investigates the minimization of the coding cost of a multicast session, i.e. how to minimize coding resources involved in a network coding based multicast session. In [15] and [32], two greedy algorithms have been proposed to reduce the number of coding nodes. Kim et al
In addition to the cost, the transmission delay of a multicast is another important issue that has received considerable amount of attention. In [48], when minimizing the required coding operations, we make sure that the constructed multicast session meets the delay constraint. Zhang et al present a network coding algorithm for video conferencing systems, where the maximum transmission delay is minimized while high throughput is retained [50]. In [8], the problem of efficiently placing network coding nodes in overlay networks is concerned so as to keep a high data transmission rate and low delivery latency. Two algorithms have been developed to determine the positioning of a given number of coding nodes, where either a central node is aware of the full network statistics, or each node knows the local statistics from its neighbours. In [3], online network coding with timely delivery guarantees is considered, where encoding rules are redefined to break the chains of linear combinations.
Note that, when network coding is implemented, coding cost and link cost will both incur. When setting up multicast sessions, one issue is that service providers of a network are more interested in the total cost (the sum of the coding cost and the link cost) involved during the multicast session, compared with either coding cost or link cost. This is because total cost is more accurate to estimate the network resources consumed for supporting the network coding based multicast. Hence, it is worth studying the minimization of the total cost of a multicast. To the best of our knowledge, no research has been conducted concerning the total cost. On the other hand, network users feel uncomfortable if transmission delays of the applications (e.g. video conferencing and IPTV) they request are too large, i.e. the users expect the transmission delays to be minimized. In this paper, we treat the network coding based multicast routing problem as a bi-objective optimization problem, with one objective to minimize the total cost and the other to minimize the maximum transmission delay of the multicast. These are two conflicting objectives in the bi-objective problem, where optimal solutions are a set of nondominated solutions, known as the Pareto-optimal front (PF) [11].
1.2 Nondominated Sorting Genetic Algorithm II
Recently, multiobjective evolutionary algorithms have received increasing attention due to their population-based structures that can easily obtain multiple Pareto-optimal solutions in a single run [6][13][31]. Among them, elitist nondominated sorting genetic algorithm (NSGA-II) is one of the most successful and widely used multiobjective evolutionary algorithms [11]. Compared with its predecessor [40], NSGA-II is featured with three significant advantages: (1) a fast nondominated sorting approach that reduces the computational complexity from O(MN3) to O(MN2), where M is the number of objectives and N is the population size; (2) an elitism approach that speeds up the search and prevents the loss of the promising solutions already obtained; and (3) a parameter-less diversity-preservation scheme that eliminates the difficulty of setting an appropriate value for the sharing parameter σshare which is responsible for retaining
a diversified population in NSGA [12]. Since its introduction in 2002, NSGA-II and its variants have been successfully applied to various multiobjective optimization problems, including function optimization [12], image watermarking [43], system reliability optimization [29], generation expansion planning [22], electromagnetic device design [9], optimal medical treatment [19], the restoration of supply chain disruptions [39], and so on.
1.3 Contributions of the Present Work
The contributions of our work are summarized as below.
− We for the first time formulate a bi-objective network coding based multicast routing problem, where the total cost and the maximum transmission delay are two conflicting objectives to be minimized simultaneously. We believe such investigation provides the important first step research towards wider range of intelligent resource optimization in network coding based multicast routing.
performance of NSGA-II. Second, we find that NSGA-II is very likely to produce individuals with identical objective values at each generation. These individuals will harm the diversity and hence the performance of NSGA-II. However, the diversity preservation mechanism of NSGA-II is unable to prevent from the spread of these individuals in the population. The two findings are common problems arisen in population-based optimization for highly constrained and complex problems.
− We propose two adjustments to adapt NSGA-II for the bi-objective optimization problem concerned, where each adjustment aims to address one of the above identified findings. The first adjustment is an initialization technique to generate a feasible and diversified population at the beginning of the evolution. Hence the evolution of the search is more effective. The second adjustment is called individual delegate scheme. During the search, the scheme will retain only one of those individuals with identical objective values in the population. The individual delegate scheme acts as a compensation scheme to the diversity-preservation mechanism in the original NSGA-II, and helps to diversify the population.
Performance evaluations have been made via a large set of computer simulations. The proposed NSGA-II has shown to overweigh a number of state-of-the-art multiobjective evolutionary algorithms with respect to the obtained optimization results.
The rest of this paper is organized as follows: Section 2 presents the modeling and formulation of the bi-objective optimization problem. Section 3 briefly reviews the original NSGA-II proposed by Deb et al in 2002 [10]. In Section 4, the structure of the proposed algorithm is given in detail. After that, we analyze and discuss the simulation results in Section 5 and present our conclusions and future work in Section 6.
2. Problem Formulation
We use directed graph G = (V, E) to represent the network model, where V is the node set, E is the link set and each link eT has a capacity of unit rate [1]. In network coding based multicast (NCM), there are a source node sV, a set of receivers T = {t1,…,td}
V, and an expected data rate R (which is an integer). The source wants to deliver the same data to each node tk
T at an identical data rate, i.e. R [24][28]. Linear network coding is considered, which is sufficient to support NCM [34].Given a NCM request, the task in this paper emphasizes how to efficiently construct a subgraph that satisfies the data rate requirement by using NCM. This particular subgraph is called NCM subgraph and denoted by GNCM(s,T). In such a subgraph, there are R link-disjoint paths Pi(s,tk), i = 1,…,R, from s to receiver tk
T
, which guarantees that data rate R can be achieved. In NCM subgraph, a node is called coding node if the node combines different incoming data; for arbitrary coding node, an outgoing link is called coding link if the coded data generated at the node is sent out via this link. For example, the link-disjoint paths within the obtained NCM subgraph in Fig.1(c) are shown in Fig.2 in detail, where data rate R is 2 [49]. Obviously, four paths P1(s, y), P2(s, y), P1(s, z) and P2(s, z) form the NCM subgraph.In network G, a merging node is a non-receiver node that has multiple incoming links[24][28]. Only merging nodes can serve as coding nodes. As discussed in [32], the number of coding operations can be well estimated by that of coding links. In this paper, the total cost of the coding links is used to estimate the coding cost of a NCM subgraph. We assume each link eE, when occupied by the NCM subgraph, incurs a link cost.
To investigate the bi-objective NCM routing problem, some notations are listed below:
Z: the number of coding nodes in GNCM(s, T).
ccode(n): cost of coding node n; The more data streams involved in the coding operation in n, the larger
ccode(n).
clink(e): cost of link e if e
GNCM(s, T).R: the expected data rate from the source to each receiver.
Pi(s, tk) : the i-th path between the source and receiver tk
T, i = 1,…,R, in GNCM(s, T).D(Pi(s, tk)): the end-to-end delay of path Pi(s, tk).
Fig.2 A NCM subgraph and its link-disjoint paths [49].
We define the bi-objective optimization problem as to build a NCM subgraph while simultaneously minimizing two objectives (the total cost Ctotal and the maximum transmission delay Dmax of a multicast routing) and achieving the demanded data rate, as shown below:
Minimize:
T s G
e link Z
n code total
NCM
e c n
c C
,
1 ( ) ( ) (1)
Dmax = max{D(Pi(s, tk)) | i = 1,…,R, tkT} (2) Subject to:
R(s, tk) R, tk
T (3)Objective (1) is to minimize the total cost of the NCM subgraph, which consists of the coding cost and link cost; Objective (2) is to minimize the delay of the NCM subgraph. Constraint (3) defines that the achievable data rate from s to each receiver must be at least R so that we can set up R link-disjoint paths from s to each receiver.
In multiobjective optimization problems, one may not find a single solution that is optimized in every objective [11], e.g. the improvement in one objective may lead to the deterioration in other objectives. In our problem, optimal solutions are a set of nondominated solutions (known as the Pareto-optimal front [11]), where no solution is superior to the others when taking into account all the objectives. For two solutions X1 and X2, we say X1 dominates X2 (or X2 is dominated by
X1) if either of the two conditions hold: {Ctotal(X1) < Ctotal(X2), Dmax(X1) ≤ Dmax(X2)} or {Ctotal(X1) ≤ Ctotal(X2), Dmax(X1) <
Dmax(X2)}.
3. An Overview of Original NSGA-II
NSGA-II is one of the classical algorithms, having been successfully applied to many areas such as function optimization [11][12][40], engineering optimization [9][22][43], management [29][39], medical treatment [19], and so on.
and the offspring population at generation t, respectively. The pseudo code of NSGA-II is shown in Fig.3 (please refer to [12] for details).
In the evolution loop, the parent population P(t) and the offspring population Q(t) are combined together so that the elite solutions (individuals) already obtained cannot be lost. In step 7, all individuals in the combined population S(t) are evaluated (e.g. objective values fi(X), i = 1,…, M, for individual X are calculated) and sorted into different nondomination levels according to the individual dominance scheme [12]. Individuals that are not dominated by any other individual are assigned rank 1. Individuals that are dominated only by the individuals of rank 1 are assigned rank 2, and this recursive process iterates until all individuals in S(t) have a rank number. The nondominated sorting approach in NSGA-II has a computational complexity of O(MN2). To realize the nondominated sorting, NSGA-II uses a domination count nX (the number of individuals which dominate individual X) and an individual set IX that individual X dominates. First of all, each individual X is compared with other individuals within the population and obtains nX and IX. This requires O(MN) comparisons for each individual and hence the total complexity is O(MN2). The above process determines rank 1, i.e. if nX = 0, individual X belongs to the first rank. Based on rank 1, the nondominated sorting approach determines rank 2 as follows: for each individual X with nX = 0, each individual X’ in IX is visited and its domination count nX’ is reduced by one. If nX’ = 0, X’ belongs to rank 2. The above procedure is continued with each individual in rank 2 so that rank 3 can be determined. The above process iterates until all individuals in the population are assigned a rank number. For individuals in rank 2 and above, the domination count nX can be at most N − 1. Hence each individual X can be visited at most N − 1 times before nX is reduced to zero. Note that X will never be visited again after it is assigned a rank number. Also, there are at most N − 1 individuals in rank 2 and above. Hence, to determine rank 2 and above requires a computational complexity of O(MN2) which is the same as to determine rank 1. Therefore, the overall complexity of the nondominated sorting is O(MN2).
When comparing two individuals in parent selection, the crowded comparison operator is adopted to guide the search towards the Pareto-optimal front (PF) [12]. In step 7, the individuals in S(t) are first sorted by their rank in an ascending order, where the one with a lower rank value is selected. If two individuals have the same rank, the crowding distance is used to estimate the density of individuals surrounding a particular individual in the population. The individual with the larger crowding distance is better and is thus chosen. Step 10 applies crossover (with a crossover probability pc) and mutation (with a mutation probability pm) to the individuals in the mating pool to create the offspring population Q(t). The final output is the set of all nondominated solutions in P(t) and Q(t).
1. Initialization
2. Set t = 0 and Q(0) = Ø; 3. Randomly create P(0); 4. repeat
5. t = t + 1; 6. S(t) = P(t) ∪Q(t);
7. Sort individuals in S(t) by using two attributes:
(1) the nondomination rank and (2) the crowding distance; 8. Set P(t) = Ø and put the first N individuals into P(t);
9. Select N individuals from P(t) to fill the mating pool by using tournament selection with crowded-comparison operator;
10. Implement crossover and mutation to the individuals in the mating pool and store the offspring population in Q(t);
11. until the termination condition is met
Fig.3 The pseudo-code of NSGA-II [12].
4. The Proposed NSGA-II
In this section, first of all, the chromosome representation and the objective evaluation are introduced. Then, the two adjustments are described, i.e. an initialization scheme and an individual delegate scheme. Finally, the overall structure of the proposed NSGA-II is given in detail.
4.1 Chromosome Representation and Objective Evaluation
When developing multiobjective evolutionary algorithms, chromosome representation is one of the most important issues that need to be carefully devised. For the bi-objective optimization problem concerned in this paper, we adopt the binary link state (BLS) encoding to represent solutions. It has been successfully used in a number of network coding resource minimization problems (including some of our previous research) [24][28][49].
As mentioned in Section 2, merging nodes within network G are of particular importance as they are allowed to perform coding if necessary. To explicitly show all possible ways of how information flows via a particular merging node, the graph decomposition method is employed to decompose each merging node in G into a number of nodes connected by links [24][28]. As a result, a secondary graph GD is created. The detailed procedure is shown below. For the
i-th merging node, let In(i) be the number of incoming links and Out(i) be the number of outgoing links, respectively. The original i-th merging node is decomposed into two sets of nodes: (1) In(i) nodes, u1,…,uIn(i), referred to as incoming
auxiliary nodes, and (2) Out(i) nodes, w1,…,wOut(i), referred to as outgoing auxiliary nodes. The j-th incoming link of the
i-th original merging node is redirected to node uj; and the k-th outgoing link of the i-th merging node is redirected to node wk. Besides, a directed link e(uj, wk) is inserted between uj and wk, j = 1,…,In(i), k = 1,…,Out(i). The graph decomposition method is widely adopted in the literature [20][24][28]. Fig.4 shows how merging nodes in a graph are decomposed. Fig.4(a) is the original graph with source s and receivers t1 and t2, and v1 and v2 are two merging nodes.
After graph decomposition, the secondary graph is shown in Fig.4(b), where four newly inserted links are inserted into each merging node, helping to show every possible route that the information may pass through v1 and v2.
(a) (b)
Fig.4 An example of graph decomposition. (a) the original graph. (b) the secondary graph GD.
In the BLS encoding approach, an individual (solution) X = {x1, x2,…, xm} is represented by a string of binary bits, where each bit xi is associated with one of the newly inserted links between auxiliary nodes, e.g. e(uj, wk) in GD. Value ‘1’ at bit xi means its corresponding link exists in GD, and value ‘0’ otherwise. Hence, each individual corresponds to an explicit secondary graph GD which may or may not support a valid network coding based multicast routing solution.
solutions. In communication networks, merging nodes are placed at key positions of a network, responsible for switching and diverting flows. If all merging nodes are deactivated from the network, it is highly likely to lead to an infeasible NCM subgraph due to the violation of the data rate restriction. As aforementioned, how flows pass the merging nodes is determined by the states of the incoming auxiliary links of GD. Many inactive incoming auxiliary links in GD (i.e. many 0’s in a chromosome) is very likely to lead to infeasible solutions. This is why the search space of BLS contains too many infeasible solutions (see Section 5.3 which demonstrates and analyze this finding). These infeasible solutions disconnect feasible areas in the search space and dramatically increase the difficulty of finding an optimal solution by evolutionary algorithms.
To evaluate a given individual X in all objectives, we first check if X is feasible. Each individual corresponds to a unique secondary graph GD. We apply Goldberg algorithm [16], a classical max-flow algorithm, to compute the max-flow between the source s and an arbitrary receiver tk∈T in GD. As mentioned in Section 2, each link in G has a unit capacity. The max-flow between s and tk is thus equivalent to the number of link-disjoint paths between s and tk found by the Goldberg algorithm. If all d max-flows are at least R, where d is the number of receivers, rate R is achievable and the individual X is feasible. Otherwise, X is infeasible.
In the problem concerned in this paper, there are two optimization objectives, i.e. the total cost Ctotal and the maximum transmission delay Dmax. For each infeasible individual X, we set Ctotal(X) = Ψ1and Dmax(X) = Ψ2, where Ψ1 and Ψ2 are
two sufficiently large values (Ψ1 = Ψ2 = 10,000 in this paper). Otherwise, if X is feasible, we first find a corresponding
NCM subgraph GNCM(s, T) and then calculate Ctotal(X) and Dmax(X). For each receiver tk∈T, we select R paths from the obtained link-disjoint paths from s to tk (if the max-flow is R then we select all the link-disjoint paths) and thus obtain R·d paths, i.e. Pi(s, tk), i = 1,…,R, k = 1,…,d. We map all the selected paths to GD and obtain a feasible GNCM(s, T) based on which the two objectives Ctotal(X) and Dmax(X) can be easily calculated according to formula (1) and (2) in Section 2.
4.2 The Initialization Scheme
The bi-objective optimization problem we study is a highly constrained problem, where infeasible solutions accounts for a large proportion of the search space (see detailed analysis in Section 5). Randomly created initial population may seriously deteriorate the optimization performance of NSGA-II.
It is widely recognized that, for evolutionary algorithms, a good initial population is more likely to lead to a better optimization result. For the network coding resource minimization problems in [24][28] and our previous work [47][48][49], an all-one individual, i.e. ‘11…1’, is inserted into the initial population to guarantee that the search begins with at least one feasible individual (the all-one individual ensures that a feasible NCM subgraph can be found). This scheme shows to efficiently improve the evolution and solution quality and can be directly applied to our problem.
However, inserting an all-one individual is not sufficient to create a good initial population for the multiobjective problem concerned here. With a limited number of feasible individuals (i.e. the all-one individual may be the only feasible individual), the population cannot evolve efficiently towards the Pareto-optimal solutions. Inspired by the initialization scheme in [24][28], we propose a new scheme that not only generates a considerable amount of feasible individuals but also make sure these individuals are diversified. Let X = {x1, x2,…, xm} be an arbitrary individual, where
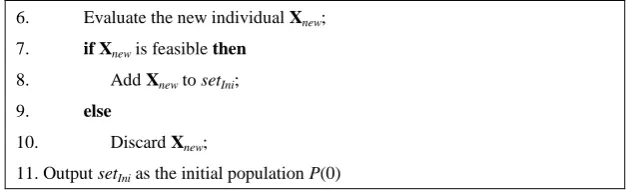
xi, i = 1, 2, …, m, is the i-th bit of X. Let N be the population size. Let setIni be the set of generated initial solutions. Fig.5 shows the procedure of the new initial scheme.
1. Set setIni = Ø and add an all-one individual to setIni 2. while |setIni| < N do
6. Evaluate the new individual Xnew; 7. if Xnew is feasible then
8. Add Xnew to setIni; 9. else
10. Discard Xnew;
11. Output setIni as the initial population P(0) Fig. 5 The procedure of the proposed initialization scheme.
The new initial scheme enables the proposed NSGA-II to start with a set of feasible individuals, which helps it to obtain nondominated solutions that are as close to the true PF as possible (see Section 5 for details).
4.3 The Individual Delegate Scheme
As mentioned in Section 4.1, each individual X corresponds to a unique secondary graph GD. If a valid NCM subgraph is obtained, X is seen as a feasible individual; otherwise, X is infeasible. For a feasible X, to determine its NCM subgraph, the max-flow from the source to each receiver is computed from the corresponding GD. Clearly, the max-flow to each receiver may remain the same if GD is slightly changed, e.g. the links and nodes occupied by the max-flow are not removed from GD. If none of the max-flows is affected, the corresponding NCM subgraph remains unchanged. According to this feature, one may imagine that different secondary graphs may result into the same NCM subgraph as long as they are similar to each other. In other words, it is possible that similar individuals (i.e. with small hamming distance) may result into identical NCM subgraph and thus have identical Ctotal and Dmax. Admittedly, very different NCM subgraphs may also have the same Ctotal and Dmax in some instance. However, this is very unlikely to happen from our observations, mainly due to the highly constrained problem, and thus is negligible. We may assume that individuals with the same objective values are associated with identical NCM subgraph.
There is a diversity-preservation mechanism in the original NSGA-II. This mechanism deletes similar individuals from the population according to two attributes: the nondomination rank and the crowding distance. Individuals with a higher rank level and a lower crowding distance are more likely to be removed during the evolution of the population (see Section 3). However, assume a case where similar individuals in the first rank (i.e. nondominated individuals) correspond to the same NCM subgraph (this is quite possible because of the feature of our optimization problem). The existence of these individuals in this case decreases the diversity in the population. Unfortunately, the diversity-preservation mechanism in NSGA-II cannot identify these individuals because they are different in genotype space. The incompetence of NSGA-II in handling this case may lead to the spread of similar individuals in the first rank and thus a rapid loss of population diversity. In the experiments, we observe that in solving the problem concerned, those individuals (with the same Ctotal and Dmax) quite often account for a large proportion of the parent population P(t) which maintains the elite individuals found so far and serves as the source to fill the mating pool (see Section 5.4 for details). Hence, the optimization performance of NSGA-II is deteriorated in dealing with the problem concerned in this paper.
We develop an individual delegate scheme to diversify the population by deleting some of the individuals which have the same Ctotal and Dmax. This scheme is inserted between step 6 and step 7 in Fig.3. Assume population S(t) has 2N individuals (half from P(t) and half from Q(t)). There are two types of individuals in S(t): (1) individuals each with a unique Ctotal and/or Dmax, and (2) individuals sharing identical Ctotal and Dmax with others. For the latter type of individuals (e.g. k1 individuals in S(t)), we divide them into k2 groups of individuals, where in each group individuals have identical
Ctotal and Dmax. For each group, the individual delegate scheme reserves one individual of the group and deletes all others from the group, thus leaving 2N-k1+k2 individuals remaining in S(t). Hence, the population diversity of our algorithm
[image:9.595.140.456.72.169.2]Suppose there is a group (one of the k2 groups) of individuals with the same Ctotal and Dmax. Theoretically, we cannot tell which one is better in the phenotype space. Fortunately, these individuals are usually different in the genotype space [26]. Hamming distance is widely used to measure the differences between two individuals in terms of their genes. In this paper, we use average Hamming distance to find the delegate of the group. For an individual Xi in the group, and each individual in S(t), Xj, where j = 1,…,2N and j ≠ i, the average Hamming distance (AHD) of Xi is defined as (4).
i j
j i i
N
AHD XOR( , )
1 2
1 )
(X X X (4)
A larger AHD indicates Xi is situated in a less crowded region. We select the individual with the largest AHD as the delegate of that particular group to maintain the diversity of the population.
The individual delegate scheme is designed to diversity the population of our algorithm. It ensures that, in the parent population P(t), any two individuals are different in terms of objective values. The effect of the individual delegate scheme is evaluated in Section 5.
4.4 The Procedure of the Proposed NSGA-II
The proposed NSGA-II is characterized by two adjustments when applied to solve the bi-objective optimization problem concerned in this work. Fig.6 shows the detailed procedure of NSGA-II.
Instead of randomly generating the initial population, the proposed initialization scheme is used to produce N
promising individuals. The main loop is similar to the procedure of original NSGA-II (shown in Fig.3) except for the use of the individual delegate scheme (step 8 in Fig.6). After applying this scheme, the size of S(t) may become smaller than
N due to the deletion of individuals. So we replace step 8 in Fig.3 with steps 10-13 to determine P(t). The termination condition is either (1) a predefined number of generations, or (2) a predefined amount of computational time.
1. Initialization 2. Set t = 0;
3. Set the offspring population Q(0) = Ø;
4. Create the parent population P(0) by using the new initialization scheme; // see Section 4.2 5. repeat
6. t = t + 1;
7. S(t) = P(t) ∪ Q(t);
8. Delete the individuals in S(t), chosen by the individual delegate scheme; // see Section 4.3
9. Sort individuals in S(t) by using: (1) nondomination rank and (2) crowding distance; // see Section 3 10. if |S(t)| ≤ N then
11. Set P(t) = S(t); 12. else
13. Set P(t) = Ø and put the first N individuals of S(t) into P(t);
14. Select N individuals from P(t) by using the tournament selection with crowded-comparison operator; 15. Recombine the N individuals by crossover and mutation and produce offspring population Q(t); 16. until the termination condition is met
17. Output the nondominated solutions in P(t) and Q(t);
Fig. 6. The procedure of the proposed NSGA-II.
5. Performance Evaluation
[image:10.595.67.525.422.696.2]the effectiveness of the two adjustments, i.e. the initialization scheme and the individual delegate scheme, respectively. Finally, we compare the proposed NSGA-II with state-of-the-art multiobjective evolutionary algorithms (e.g. NSGA-II [12] and SPEA2 [52]) in terms of the optimization performance.
5.1 Test Instances
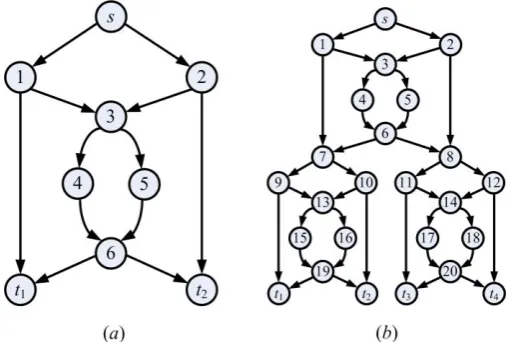
We consider 10 different test instances, two on fixed networks and eight on randomly generated networks. The two fixed networks are 7-copy and 15-copy networks which have been used in a number of publications (e.g. [24][47][49]) to test the performance of algorithms on the network coding resource minimization problem. Fig.7 illustrates an example of
n-copy network, where Fig.7(b) is a 3-copy network constructed by cascading 3 copies of the original network in Fig.7(a). As for n-copy network, the source is the node on the top and the receivers are at the bottom, e.g. s is the source and ti, i = 1…4, is the i-th receiver in the 3-copy network. The n-copy network has n + 1 receivers to which data rate from the source is 2. The eight random networks (Rnd-i, i = 1,…,8) are directed networks with 20 to 50 nodes. Table 1 shows the 10 instances and their parameters. In all experiments, the link cost clink(e) for link e is uniformly distributed in the
range [5, 15]. The coding cost ccode(n) for node n is in proportion to the number of data streams which are involved
in the coding operation in node n. This makes sense because the more data streams involved, the more public buffering and computational resources consumed, and hence the larger cost. We assume the cost per data stream for
[image:11.595.170.424.421.592.2]coding is fixed at 4. For example, if there are two data streams involved in coding, the coding cost is 8. The propagation delay of link e is randomly generated in [2ms, 10ms]. We assume any coding operation consumes the processing time of 2ms. To encourage future scientific comparisons, the detailed information of all instances is provided at http://www.cs.nott.ac.uk/~rxq/benchmarks.htm. All experiments were run on a Windows XP computer with Intel(R) Core(TM)2 Duo CPU E8400 3.0GHz, 2G RAM. The results are achieved by running each algorithm 20 times (unless stated otherwise), from which statistical analysis is carried out.
Fig.7 An example of n-copy network. (a) original network. (b) 3-copy.
Table 1 Experimental Networks and Instance Parameters.
Networks
Original network G Decomposed graph GD
nodes links receivers rate nodes links
auxiliary links
7-copy 57 84 8 2 117 164 80
15-copy 121 180 16 2 253 356 176
Rnd-1 20 37 5 3 54 81 43
Rnd-2 20 39 5 3 65 89 50
[image:11.595.127.472.649.770.2]Rnd-4 30 69 6 3 113 181 112
Rnd-5 40 78 9 3 124 184 106
Rnd-6 40 85 9 4 91 149 64
Rnd-7 50 101 8 3 178 246 145
Rnd-8 50 118 10 4 194 307 189
5.2 Performance Measures
To evaluate the performance of a multiobjective evolutionary algorithm from various aspects, we use the following three performance metrics which have been widely recognized in the studies of multiobjective optimization problems [33][41][51]:
Inverted generational distance (IGD): Let PFref be a reference set of nondominated solutions of the true PF and
PFknown be the set of nondominated solutions obtained by an algorithm. Solutions in PFref are expected to be uniformly distributed in the objective space along the true PF. IGD is defined as (5).
ref PF v known ref PF v d PFIGD ( , )
| |
1
(5)
where d(v, PFknown) is the Euclidean distance (in the objective domain) between solution v in PFref and its nearest solution in PFknown. This metric measures both the diversity and the convergence of an obtained nondominated solution set. A lower IGD indicates a better overall performance of an algorithm.
Generational distance (GD): GD measures the average distance from the obtained nondominated solution set
PFknown to the reference set PFref, defined as (6).
2 / 1 ) , ( | | 1
PFkn o wn v ref known PF v d PF
GD (6)
where d(v, PFref) is the Euclidean distance (in the objective domain) between solution v in PFknown and its nearest solution in PFref. A smaller GD indicates the obtained PF is closer to the true PF.
Maximum spread (MS): this metric reflects how well the true PF is covered by the nondominated solutions in
PFknown through the hyperboxes formed by the extreme function values observed in PFref and PFknown, as shown in (7).
Mi i i
i i i i F F F f F f M MS 1 2 min max min min max max ) , max( ) , min( 1 (7)
where M is the number of objectives; fimaxand
min
i
f are the maximum and minimum values of the i-th objective in
PFknown, respectively; and Fimaxand
min
i
F are the maximum and minimum values of the i-th objective in PFref,
respectively. A larger MS shows the obtained PF has a better spread.
Note that sometimes we do not know the true PF for highly complex multiobjective optimization problems including the problem concerned in this work. To determine a reference set PFref, we combine the best-so-far solutions obtained by all algorithms in all runs and select the nondominated solutions as the reference set. This has been widely adopted in evaluating multiobjective algorithms in the literature.
5.3 The Initialization Scheme
5.3.1 The Distribution of Feasible Solutions over the Search Space
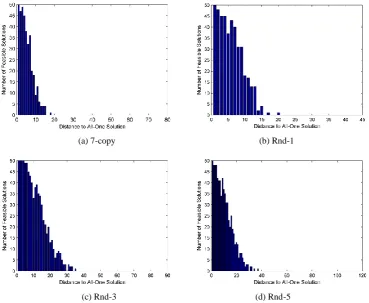
In this experiment, we generate a set of neighborhood solutions of different hamming distance to the all-one solution and study the distribution of those feasible neighbors to the all-one solution. Assume a solution is represented as n binary bits, where n is an integer. The all-one solution thus has a maximum distance of n to the all-zero solution.
For each hamming distance of i (i = 1,…, n − 1) to the all-one solution, we obtain 50 neighbors which represent
solutions moving away from the all-one solution. We record the number of feasible solutions in the 50 neighbors and plot the number against i on four selected instances, as shown in Fig.8.
(a) 7-copy (b) Rnd-1
(c) Rnd-3 (d) Rnd-5
Fig. 8. Number of feasible solutions vs. distance to all-one solution on four selected instances.
The results are interesting. Although feasible solutions are not evenly distributed over the search space around the all-one solution, those with smaller distance are more likely to be feasible. That is, the region where the all-one solution resides contains more feasible solutions. Hence inserting an all-one solution, to some extent, helps to guide the search towards promising region of more feasible solutions. This is also the reason that we generate a set of variants with small distance to the all-one solution as the initial population.
5.3.2 The Effectiveness of the Initialization Scheme
To evaluate the proposed initialization scheme, we compare the performance of three initialization schemes, as listed below.
Ini-1: randomly generating the initial population (commonly used in evolutionary algorithms); Ini-2: randomly generating the initial population with an all-one vector inserted [24][28][49]; Ini-3: the proposed initialization scheme (see Section 4.2);
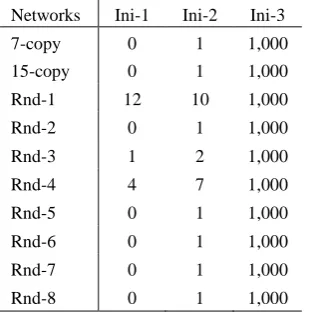
[image:13.595.111.481.189.492.2]This number is sufficiently large to reflect the performance of each scheme. Table 2 shows the comparisons of the three initialization schemes in terms of producing feasible solutions. It is seen that the population created by Ini-3 is full of feasible solutions for each instance, not surprisingly due to the devised scheme. Ini-2 generates at least one feasible solution in each instance, where one of them would be the all-one individual introduced. Both Ini-3 and Ini-2 enables the search to start with feasible solution(s). However, for Ini-1, the number of feasible solutions is zero for most of the instances (7 out of 10), even though the population size is large enough. This is because the search space of the problem contains large amount of infeasible solutions, thus random initial population would hinder the effective evolution in NSGA-II.
Table 2 Comparisons of Initialization Schemes Ini-1, Ini-2 and Ini-3 Regarding The Number of Feasible Solutions. Networks Ini-1 Ini-2 Ini-3
7-copy 0 1 1,000
15-copy 0 1 1,000
Rnd-1 12 10 1,000
Rnd-2 0 1 1,000
Rnd-3 1 2 1,000
Rnd-4 4 7 1,000
Rnd-5 0 1 1,000
Rnd-6 0 1 1,000
Rnd-7 0 1 1,000
Rnd-8 0 1 1,000
Our second experiment focuses on the impact of different initialization schemes on the performance of NSGA-II. We hereafter set initial population size as 40, offspring population size N = 40, the crossover probability pc = 0.9, and the mutation probability pm = 1/ℓ, where ℓ is the encoding length [12]. NSGA-II terminates after 200 generations.
First, for each scheme, we count the number of runs which output feasible solutions after the evolution, as shown in Table 3. We see that both Ini-2 and Ini-3 perform much better than Ini-1. This observation illustrates that Ini-1 is not an appropriate initialization scheme for our optimization problem. We hereafter only consider Ini-2 and Ini-3 as possible initialization schemes and compare them in terms of their effect on the performance of NSGA-II.
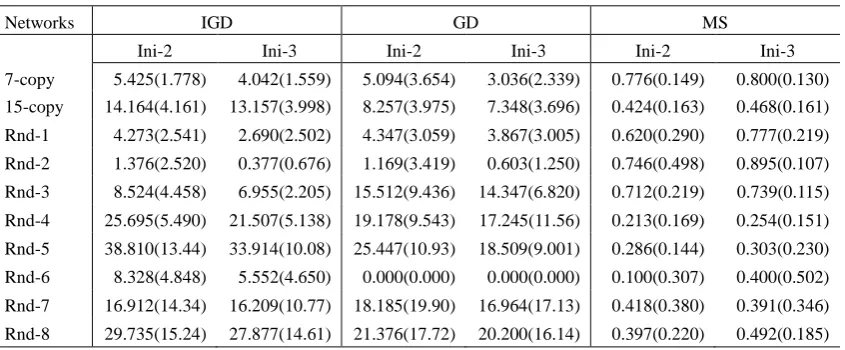
We collect the mean and standard deviation of IGD, GD and MS obtained by NSGA-II with Ini-2 and Ini-3, respectively, as seen in Table 4. As mentioned in Section 5.2, IGD can reflect both convergence and diversity of an algorithm, showing the overall performance of a multiobjective algorithm; GD shows how far the obtained PF (PFknown) is away from the true PF (PFref) and MS represents how well PFref is covered by PFknown. Regarding the IGD, when adopted in NSGA-II, Ini-3 leads to a better overall performance for all instances compared with Ini-2, i.e. Ini-3 always lead to a smaller mean and standard deviation of IGD. Similarly, for GD, Ini-3 outperforms on 8 instances (except Rnd-4 and Rnd-6), meaning that PFknown obtained by NSGA-II with Ini-3 is usually closer to PFref than that of Ini-2. For MS, Ini-3 outperforms on 7 instances, implying PFknown obtained by NSGA-II with Ini-3 has a better spread in most of the instances.
According to the experiments above, we find that Ini-3, when used in NSGA-II, outperforms Ini-1 and Ini-2 and is more likely to guide the search towards the PF.
Table 3 The Number of Runs That Output Feasible Solutions. Networks Ini-1 Ini-2 Ini-3
7-copy 0 20 20
15-copy 0 20 20
[image:14.595.222.388.229.385.2] [image:14.595.224.373.713.771.2]Rnd-2 6 20 20
Rnd-3 14 20 20
Rnd-4 18 20 20
Rnd-5 0 20 20
Rnd-6 5 20 20
Rnd-7 1 20 20
Rnd-8 0 20 20
Table 4 The Impact of Ini-2 and Ini-3 on the Performance of NSGA-II. X and Y in X(Y) Denotes the Average and Standard Deviation, Respectively, from 20 Runs.
Networks IGD GD MS
Ini-2 Ini-3 Ini-2 Ini-3 Ini-2 Ini-3
7-copy 5.425(1.778) 4.042(1.559) 5.094(3.654) 3.036(2.339) 0.776(0.149) 0.800(0.130) 15-copy 14.164(4.161) 13.157(3.998) 8.257(3.975) 7.348(3.696) 0.424(0.163) 0.468(0.161) Rnd-1 4.273(2.541) 2.690(2.502) 4.347(3.059) 3.867(3.005) 0.620(0.290) 0.777(0.219) Rnd-2 1.376(2.520) 0.377(0.676) 1.169(3.419) 0.603(1.250) 0.746(0.498) 0.895(0.107) Rnd-3 8.524(4.458) 6.955(2.205) 15.512(9.436) 14.347(6.820) 0.712(0.219) 0.739(0.115) Rnd-4 25.695(5.490) 21.507(5.138) 19.178(9.543) 17.245(11.56) 0.213(0.169) 0.254(0.151) Rnd-5 38.810(13.44) 33.914(10.08) 25.447(10.93) 18.509(9.001) 0.286(0.144) 0.303(0.230) Rnd-6 8.328(4.848) 5.552(4.650) 0.000(0.000) 0.000(0.000) 0.100(0.307) 0.400(0.502) Rnd-7 16.912(14.34) 16.209(10.77) 18.185(19.90) 16.964(17.13) 0.418(0.380) 0.391(0.346) Rnd-8 29.735(15.24) 27.877(14.61) 21.376(17.72) 20.200(16.14) 0.397(0.220) 0.492(0.185)
5.4 The Effectiveness of the Individual Delegate Scheme
As mentioned in Section 4.3, there are two types of individuals in the population, i.e. individuals with unique objective values and those sharing the same Ctotal and Dmax with someone else. We hereafter call them type-1 and type-2 individuals, respectively. Type-2 individuals in the population can be divided into a number of groups. Each group has the same Ctotal and Dmax. The population diversity of a multiobjective evolutionary algorithm could be lost rapidly if there are many type-2 individuals in the population. The decreased diversification may seriously affect the optimization performance of the algorithm. Unfortunately, we find that type-2 individuals often account for a high percentage of the parent population at each generation when applying NSGA-II in the bi-objective problem concerned in this paper. To demonstrate this observation, we run NSGA-II with Ini-2 and Ini-3 on each instance for 20 times, respectively. The average percentage of type-2 individuals of each generation is reported in Table 5. The data are averaged over 200 generations and then over 20 runs. It is clear that type-2 individuals are usually the majority (no less than 60%) of the population.
[image:15.595.89.512.216.391.2]Table 5 The Average Percentage of Those Type-2 Individuals. Networks Ini-2 (%) Ini-3 (%)
7-copy 93.5 89.7
15-copy 88.5 74.1
Rnd-1 91.0 91.2
Rnd-2 94.1 95.8
Rnd-3 91.3 82.8
Rnd-4 94.7 93.1
Rnd-5 84.2 70.2
Rnd-6 99.3 98.4
Rnd-7 92.9 91.1
Rnd-8 69.6 65.6
(a) 7-copy (b) Rnd-1
(c) Rnd-3 (d) Rnd-5 Fig. 9. Percentage vs. generation on four selected instances.
In Section 4.3 we propose an individual delegate scheme (IDS) to maintain the population diversity in NSGA-II by deleting some individuals with identical objective values from the parent population at each generation. To examine the effectiveness of IDS, we compare the performance of the following four variants of the NSGA-II algorithm:
Ini-2: NSGA-II using Ini-2 as its initialization scheme Ini-3: NSGA-II using Ini-3 as its initialization scheme Ini-2 + IDS: NSGA-II using Ini-2 and IDS
Ini-3 + IDS: NSGA-II using Ini-3 and IDS
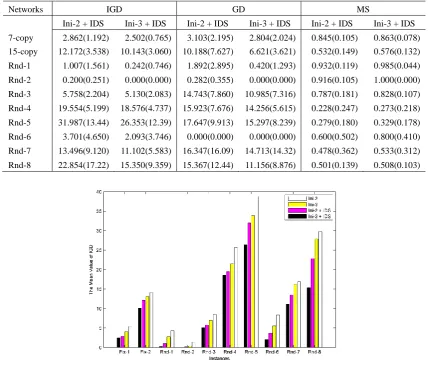
[image:16.595.104.482.82.586.2]in all instances regarding IGD in eight instances regarding GD, and seven instances regarding MS, respectively. Similar observations have been obtained comparing Ini-3 against Ini-3 + IDS in most of the instances. IDS is able to enhance the optimization performance of NSGA-II, no matter which initialization scheme is used. In addition, results in Table 6 demonstrate that Ini-3 + IDS performed the best in NSGA-II for solving the bi-objective optimization problem of this paper. Fig.10 shows the average performance of each variant in terms of the mean value of IGD, GD and MS, respectively, providing an intuitive view of the performance of the four variants of the algorithms.
Table 6 The Impact of Ini-2+IDS and Ini-3+IDS on the Performance of NSGA-II.
Networks IGD GD MS
Ini-2 + IDS Ini-3 + IDS Ini-2 + IDS Ini-3 + IDS Ini-2 + IDS Ini-3 + IDS 7-copy 2.862(1.192) 2.502(0.765) 3.103(2.195) 2.804(2.024) 0.845(0.105) 0.863(0.078) 15-copy 12.172(3.538) 10.143(3.060) 10.188(7.627) 6.621(3.621) 0.532(0.149) 0.576(0.132) Rnd-1 1.007(1.561) 0.242(0.746) 1.892(2.895) 0.420(1.293) 0.932(0.119) 0.985(0.044) Rnd-2 0.200(0.251) 0.000(0.000) 0.282(0.355) 0.000(0.000) 0.916(0.105) 1.000(0.000) Rnd-3 5.758(2.204) 5.130(2.083) 14.743(7.860) 10.985(7.316) 0.787(0.181) 0.828(0.107) Rnd-4 19.554(5.199) 18.576(4.737) 15.923(7.676) 14.256(5.615) 0.228(0.247) 0.273(0.218) Rnd-5 31.987(13.44) 26.353(12.39) 17.647(9.913) 15.297(8.239) 0.279(0.180) 0.329(0.178) Rnd-6 3.701(4.650) 2.093(3.746) 0.000(0.000) 0.000(0.000) 0.600(0.502) 0.800(0.410) Rnd-7 13.496(9.120) 11.102(5.583) 16.347(16.09) 14.713(14.32) 0.478(0.362) 0.533(0.312) Rnd-8 22.854(17.22) 15.350(9.359) 15.367(12.44) 11.156(8.876) 0.501(0.139) 0.508(0.103)
[image:17.595.83.512.196.561.2](b) The mean value of GD for different algorithms.
[image:18.595.171.422.86.262.2](c) The mean value of MS for different algorithms.
Fig. 10. Comparisons of the average performance of different algorithms.
5.5 The Overall Performance Evaluation
For the sake of clarity, we hereafter call the proposed algorithm, i.e. NSGA-II with Ini-3 and IDS, as NSGA-II for network coding based multicast, denoted by NSGAII-4N. In order to thoroughly evaluate the overall performance of NSGAII-4N, we compare it with four state-of-the-art multiobjective evolutionary algorithms in the literature. The four existing algorithms and their parameter settings are shown as below.
− NSGA-II: the original NSGA-II introduced in [12] (see Section 3). We set population size N = 40, the crossover probability pc = 0.9, and the mutation probability pm = 1/ℓ, where ℓ is individual length.
− NSGA-II-2: a modified NSGA-II with a problem specific selection scheme, proposed in [26] to address the issue of the tradeoff between coding cost and link cost in network coding based multicast. We set N = 40, pc = 0.9, and pm = 1/ℓ.
− SPEA2: the strength Pareto evolutionary algorithm 2 [53], one of the widely applied and recognized multiobjective evolutionary algorithms. Let the archive size be Narc. We set N = Narc = 40, pc = 0.9, and pm = 1/ℓ.
system optimization problems [23]. MOPBIL is one of the ideal candidates to challenge GA-based multiobjective evolutionary algorithms. Let nPV be the number of probability vectors, α be the learning rate, and σ be the amount of shift in the mutation, respectively. We set N = 40, Narc = 10, nPV = 5, α = 0.15, pm = 0.02, and σ = 0.05.
Experiments have been carried out upon 10 instances (see Table 1). To make fair comparisons, each algorithm terminates at the same amount of computational time, i.e. c-time. For each instance, we fix its c-time in proportion to the number of nodes in the decomposed graph, i.e. the problem size of the instance. For example, we set c-time = 117 sec. for the 7-copy instance and c-time = 253 sec. for the 15-copy instance (see Table 1 for details).
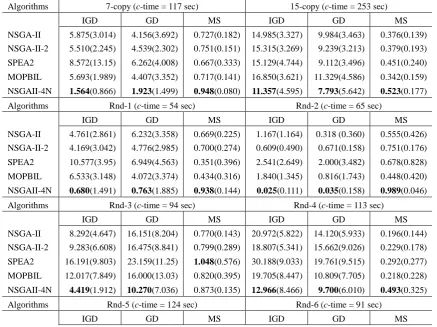
The statistics of IGD, GD and MS of the five algorithms are shown in Table 7. First of all, we can see that the target problem is a hard multiobjective optimization problem since NSGA-II and SPEA2, both widely recognized, cannot find decent nondominated solutions for some instances. For most of the instances, NSGAII-4N obtains the smallest mean IGD, the smallest mean GD, and the largest mean MS, compared with the other four algorithms, demonstrating the best performance among the five algorithms.
As aforementioned, IGD can show the overall performance of an algorithm, measuring its convergence and diversity features simultaneously. To further support our observation that NSGAII-4N outperforms others, we compare the IGD values of the five algorithms by using Student’s t-test [42]. The statistical results obtained by a two-tailed t-test with 38 degrees of freedom at a 0.05 level of significance are given in Table 8. The result of Algorithm-1↔Algorthm-2 is shown as “+”, “”, or “~” when Algorithm-1 is significantly better than, significantly worse than, or statistically equivalent to Algorithm-2, respectively. Table 8 shows that NSGAII-4N outperforms other algorithms in most of the instances except the Rnd-4 and Rnd-8 networks. For the Rnd-4 network, the performance of NSGAII-4N is equivalent to those of NSGA-II-2 and MOPBIL while for the Rnd-8 network NSGAII-4N and NSGA-II-2 are statistically the same. We therefore conclude the proposed NSGA-II has the best optimization performance over all multicast scenarios concerned.
Table 7 Performance Comparisons of the Five Algorithms in Terms of IGD, GD and MS (The Best Mean Values Are in Bold). Algorithms 7-copy (c-time = 117 sec) 15-copy (c-time = 253 sec)
IGD GD MS IGD GD MS
NSGA-II 5.875(3.014) 4.156(3.692) 0.727(0.182) 14.985(3.327) 9.984(3.463) 0.376(0.139) NSGA-II-2 5.510(2.245) 4.539(2.302) 0.751(0.151) 15.315(3.269) 9.239(3.213) 0.379(0.193) SPEA2 8.572(13.15) 6.262(4.008) 0.667(0.333) 15.129(4.744) 9.112(3.496) 0.451(0.240) MOPBIL 5.693(1.989) 4.407(3.352) 0.717(0.141) 16.850(3.621) 11.329(4.586) 0.342(0.159) NSGAII-4N 1.564(0.866) 1.923(1.499) 0.948(0.080) 11.357(4.595) 7.793(5.642) 0.523(0.177) Algorithms Rnd-1 (c-time = 54 sec) Rnd-2 (c-time = 65 sec)
IGD GD MS IGD GD MS
NSGA-II 4.761(2.861) 6.232(3.358) 0.669(0.225) 1.167(1.164) 0.318 (0.360) 0.555(0.426) NSGA-II-2 4.169(3.042) 4.776(2.985) 0.700(0.274) 0.609(0.490) 0.671(0.158) 0.751(0.176) SPEA2 10.577(3.95) 6.949(4.563) 0.351(0.396) 2.541(2.649) 2.000(3.482) 0.678(0.828) MOPBIL 6.533(3.148) 4.072(3.374) 0.434(0.316) 1.840(1.345) 0.816(1.743) 0.448(0.420) NSGAII-4N 0.680(1.491) 0.763(1.885) 0.938(0.144) 0.025(0.111) 0.035(0.158) 0.989(0.046) Algorithms Rnd-3 (c-time = 94 sec) Rnd-4 (c-time = 113 sec)
IGD GD MS IGD GD MS
NSGA-II 8.292(4.647) 16.151(8.204) 0.770(0.143) 20.972(5.822) 14.120(5.933) 0.196(0.144) NSGA-II-2 9.283(6.608) 16.475(8.841) 0.799(0.289) 18.807(5.341) 15.662(9.026) 0.229(0.178) SPEA2 16.191(9.803) 23.159(11.25) 1.048(0.576) 30.188(9.033) 19.761(9.515) 0.292(0.277) MOPBIL 12.017(7.849) 16.000(13.03) 0.820(0.395) 19.705(8.447) 10.809(7.705) 0.218(0.228) NSGAII-4N 4.419(1.912) 10.270(7.036) 0.873(0.135) 12.966(8.466) 9.700(6.010) 0.493(0.325) Algorithms Rnd-5 (c-time = 124 sec) Rnd-6 (c-time = 91 sec)
[image:19.595.80.518.433.760.2]NSGA-II 33.651(12.89) 21.245(10.73) 0.308(0.179) 8.328(2.848) 0.000(0.000) 0.100(0.307) NSGA-II-2 34.660(13.30) 22.360(15.15) 0.223(0.160) 8.790(2.069) 0.000(0.000) 0.050(0.223) SPEA2 47.996(17.01) 24.578(10.94) 0.255(0.192) 9.595(1.528) 0.450(2.012) 0.045(0.203) MOPBIL 37.806(11.02) 20.669(11.10) 0.238(0.163) 8.778(2.066) 0.450(2.012) 0.086(0.270) NSGAII-4N 24.247(9.210) 13.564(7.793) 0.419(0.216) 4.164(4.723) 0.000(0.000) 0.550(0.510) Algorithms Rnd-7 (c-time = 178 sec) Rnd-8 (c-time = 194 sec)
IGD GD MS IGD GD MS
NSGA-II 15.123(10.72) 19.718(25.22) 0.360(0.284) 28.044(16.48) 19.250(11.47) 0.460(0.159) NSGA-II-2 16.471(11.26) 16.483(13.72) 0.401(0.370) 23.029(17.74) 14.940(10.73) 0.496(0.139) SPEA2 25.307(17.40) 24.619(22.61) 0.732(0.695) 52.952(29.05) 30.391(22.17) 0.380(0.295) MOPBIL 18.608(15.62) 14.829(14.24) 0.563(0.376) 44.184(23.11) 28.274(20.99) 0.437(0.236) NSGAII-4N 9.272(5.572) 12.015(10.99) 0.584(0.279) 19.230(9.354) 9.648(3.631) 0.566(0.262)
Table 8 The t-Test Results of Different Algorithms on 10 Instances.
Algorithm-1 ↔ Algorithm-2 7-copy 15-copy Rnd-1 Rnd-2 Rnd-3
NSGAII-4N ↔ NSGA-II + + + + +
NSGAII-4N ↔ NSGA-II-2 + + + + +
NSGAII-4N ↔ SPEA2 + + + + +
NSGAII-4N ↔ MOPBIL + + + + +
Algorithm-1 ↔ Algorithm-2 Rnd-4 Rnd-5 Rnd-6 Rnd-7 Rnd-8
NSGAII-4N ↔ NSGA-II + + + + +
NSGAII-4N ↔ NSGA-II-2 ~ + + + ~
NSGAII-4N ↔ SPEA2 + + + + +
NSGAII-4N ↔ MOPBIL ~ + + + +
6. Conclusion and Future Work
This paper investigates the bi-objective network coding based multicast routing problem, where the two objectives, the total cost and the maximum transmission delay, are minimized simultaneously. We adapt Nondominated Sorting Genetic Algorithm II (NSGA-II) for the above problem by introducing two adjustments, namely the initialization scheme and the individual delegate scheme. The two adjustments both aim to diversify the population thus contribute to an effective evolution towards the Pareto Front. The simulation results show that the adjusted NSGA-II performs significantly better than a number of existing multiobjective evolutionary algorithms in terms of several popular performance measures, i.e. inverted generational distance, generational distance and maximum spread.
[image:20.595.121.475.273.434.2]ACKNOWLEDGMENT
This work was supported in part by China Scholarship Council, China, and The University of Nottingham, UK.
REFERENCES
[1] R. Ahlswede, N. Cai, S. Y. R. Li, and R. W. Yeung, Network information flow, IEEE Transactions on Information Theory 46 (2000) 1204-1216.
[2] C. W. Ahn, Fast and adaptive evolutionary algorithm for minimum-cost multicast with network coding, Electronics Letters 47 (2011) 700-701.
[3] J. Barros, R. A. Costa, D. Munaretto, J. Widmer, Effective delay control in online network coding, in Proceedings of 28th Conference on Computer Communications (INFOCOM 2009), Rio de Janeiro, 2009.
[4] A. Benslimane A, Multimedia multicast on the internet. ISTE, 2007.
[5] N. Cai, R. W. Yeung, Secure network coding, in Proceedings of IEEE International Symposium on Information Theory (ISIT’02), 2002.
[6] Y. Chen, X. Zou, W. Xie, Convergence of multi-objective evolutionary algorithms to a uniformly distributed representation of the Pareto front, Information Sciences 181 (2011) 3336-3355.
[7] P. A. Chou, Y. Wu, Network coding for the internet and wireless networks, IEEE Signal Processing Magazine 24 (2007) 77-85. [8] N. Cleju, N. Thomos, P. Frossard, Network coding node placement for delay minimization in streaming overlays, in Proceedings
of IEEE International Conference on Communications (ICC 2010), Cape Town, 2010.
[9] L. D. S. Coelho, P. Alotto, Multiobjective electromagnetic optimization based on a nondominated sorting genetic approach with a chaotic crossover operator, IEEE Transactions on Magnetics 44 (2008) 1078-1081.
[10]T. Cui, T. Ho, Minimum cost integral network coding, in Proceedings of IEEE International Symposium on Information Theory (ISIT 2007), Nice, France, 2007, pp. 2736-2740.
[11]K. Deb, Introduction to evolutionary multiobjective optimization, in J. Branke et al (ed.) Multiobjective Optimization, Springer-Verlag, 2008.
[12]K. Deb, A. Pratap, S. Agarwal, T. Meyarivan, A fast and elitist multiobjective genetic algorithm: NSGA-II, IEEE Transactions on Evolutionary Computation 6 (2002) 182-197.
[13]E. Fernandez, E. Lopez, F. Lopez, C. A. Coello Coello, Increasing selective pressure towards the best compromise in evolutionary multiobjective optimization: the extended NOSGA method, Information Sciences 181 (2011) 44-56.
[14]C. Fragouli, J. Y. L. Boudec, J. Widmer, Network Coding: An Instant Primer, Computer Communications Review 36 (2006) 63-68.
[15]C. Fragouli, E. Soljanin, Information flow decomposition for network coding, IEEE Transactions on Information Theory 52 (2006) 829-848.
[16]A. V. Goldberg, A new max-flow algorithm, MIT Technical Report MIT/LCS/TM-291, Laboratory for Computer Science, MIT, 1985.
[17]L. J. Harte, Introduction to data multicasting. Althos, 2008.
[18]B. J. Hwang, I. S. Hwang, W. R. Chen, Adaptive radio resource management for interactive user-centric IPTV services in mobile WiMAX networks, Information Sciences 181 (2011) 4024-4040.
[19]S. M. K. Heris, H. Khaloozadeh, Open- and closed- loop multiobjective optimal strategies for HIV therapy using NSGA-II, IEEE Transactions on Biomedical Engineering 58 (2011) 1678-1685.
[20]Y. Ji, H. Xing, A memory-storable quantum-inspired evolutionary algorithm for network coding resource minimization, In Kita E (Ed.) Evolutionary Algorithms, InTech, 2011, pp 363-380.
[21]A. E. Kamal, 1+N protection in optical mesh networks using network coding on p-cycles, in Proceedings of IEEE Globecom, San Francisco, 2006.
[23]J. H. Kim, Y. H. Kim, S. H. Choi, I. W. Park, Evolutionary multi-objective optimization in robot soccer system for education,
IEEE Computational Intelligence Magazine 4 (2009) 31-41.
[24]M. Kim, V. Aggarwal, V. O. Reilly, M. Médard, W. Kim, Genetic representations for evolutionary optimization of network coding, in Proceedings of EvoWorkshops 2007, LNCS 4448, Valencia, 2007, pp 21-31.
[25]M. Kim, C. W. Ahn, M. Médard, M Effros, On minimizing network coding resources: An evolutionary approach, in Proceedings of Second Workshop on Network Coding, Theory, and Applications (NetCod2006), Boston, 2006.
[26]M. Kim, M. Médard, V. Aggarwal, U. M. O. Reilly, On the coding-link cost tradeoff in multicast network coding, in Proceedings of Military Communications Conference (MILCOM2007), Orlando, 2007, pp 1-7.
[27]M. Kim, M. Médard, V. Aggarwal, U. M. O. Reilly, Network coding and its implications on optical networking, in Proceedings of Conference on Optical Fiber Communication (OFC2009), San Diego, 2009, pp 1-3.
[28]M. Kim, M. Médard, V. Aggarwal, U. M. O. Reilly, W. Kim, C. W. Ahn, M. Effros, Evolutionary approaches to minimizing network coding resources, in Proceedings of 26th IEEE International Conference on Computer Communications (INFOCOM2007), Anchorage, 2007, pp. 1991-1999.
[29]A. Kishor, S. P. Yadav, S. Kumar, Application of a multiobjective genetic algorithm to solve reliability optimization problem, in
Proceedings of 2007 International Conference on Computational Intelligence and Multimedia Applications (ICCIMA 07), Sivakasi, 2007, pp. 458-462.
[30]R. Koetter, M. Médard, An algebraic approach to network coding, IEEE ACM Transactions on Networking 11 (2003) 782-795. [31]K. Li, S. Kwong, J. Cao, M. Li, J. Zheng, R. Shen, Achieving balance between proximity and diversity in multi-objective
evolutionary algorithm, Information Sciences 182 (2012) 220-242.
[32]M. Langberg, A. Sprintson, J. Bruck, The encoding complexity of network coding, IEEE Transactions on Information Theory 52 (2006) 2386-2397.
[33]H. Li, Q. Zhang, Multiobjective optimization problems with complicated Pareto sets, MOEA/D and NSGA-II, IEEE Transactions on Evolutionary Computation 13 (2009) 284-302.
[34]S. Y. R. Li, R. W. Yeung, N. Cai, Linear network coding, IEEE Transactions on Information Theory 49 (2003) 371-381.
[35]D. S. Lun, M. Médard, T. Ho, R. Koetter, Network coding with a cost criterion, MIT LIDS Technical Report P-2584, Laboratory for Information and Decision Systems, MIT, 2004.
[36]D. S. Lun, N. Ratnakar, R. Koetter, M. Médard, E. Ahmed, H. Lee, Achieving minimum-cost multicast: a decentralized approach based on network coding, in Proceedings of INFOCOM2005, 2005, pp. 1607-1617.
[37]H. N. Luong, H. T. T. Nguyen, C. W. Ahn, Entropy-based efficiency enhancement techniques for evolutionary algorithms,
Information Sciences 188 (2012) 100-120.
[38]C. K. Miller, Multicast networking and applications. Pearson Education, 1998.
[39]V. Serrano, M. Alvarado, C. A. C. Coello, Optimization to manage supply chain disruptions using the NSGA-II, in Proceedings of IFSA 2, 2007, pp. 476-485.
[40]N. Srinivas, K. Deb, Multiobjective function optimization using nondominated sorting genetic algorithms, Evolutionary Computation 2 (1995) 221-248.
[41]K. C. Tan, Y. J. Yang, C. K. Goh, A distributed cooperative coevolutionary algorithm for multiobjective optimization, IEEE Transactions on Evolutionary Computation 10 (2006) 527-549.
[42]R. E. Walpole, R. H. Myers, S. L. Myers, K. Ye, Probability and statistics for engineers and scientists. Pearson Education, 2007. [43]N. Wang, X. Li, L. Liu, An adaptive multiobjective image watermarking scheme for QIM using NSGA-II, in Proceedings of 2009
International Conference on Computational Intelligence and Security (CIS 2009), Beijing, 2009, pp. 273-277.
[44]X. Wang, L. Fu, C. Hu, Multicast performance with hierarchical cooperation, IEEE/ACM Transactions on Networking 20 (2012) 917-930.
[46]H. Xing, Y. Ji, L. Bai, Y. Sun, An improved quantum-inspired evolutionary algorithm for coding resource optimization based network coding multicast scheme, AEU-International Journal of electronics and communications 64 (2010) 1105-1113.
[47]H. Xing, R. Qu, A population based incremental learning for network coding resources minimization, IEEE Communications Letters 15 (2011) 698-700.
[48]H. Xing, R. Qu, A population based incremental learning for delay constrained network coding resource minimization, in
Proceedings of EvoApplications 2011, Torino, 2011, pp 51-60.
[49]H. Xing, R. Qu, A compact genetic algorithm for the network coding based resource minimization problem, Applied Intelligence, 36 (2012) 809-823.
[50]H. Zhang, J. Zhou, Z. Chen, J. Li, Minimizing delay for video conference with network coding, in Proceedings of ACM SIGCOMM, Barcelona, 2009.
[51]Q. Zhang, H. Li, MOEA/D: a multiobjective evolutionary algorithm based on decomposition, IEEE Transactions on Evolutional Computation 11 (2007) 712-731.
[52]E. Zitzler, M. Laumanns, L. Thiele, SPEA2: improving the strength Pareto evolutionary algorithm, TIK-Report 103, Computer Engineering and Networks Laboratory (TIK), ETH, 2001.