ISSN Online: 2327-5960 ISSN Print: 2327-5952
DOI: 10.4236/jss.2019.711010 Nov. 20, 2019 126 Open Journal of Social Sciences
A Preliminary Study on Parkinson’s Disease
with Regularized Logistic Regression Method
Jophy Lin
Arcadia, CA, USA
Abstract
Parkinson’s disease is a long-term degenerative disorder of the central nerv-ous system. In this paper, we have used gradient descent method with regula-rized logistic regression to give suggestions on the possible reason for the rise of this disease. Results with different regularization are presented and com-pared. We hope this could open a new way for studying complex diseases us-ing data methods.
Keywords
Mental Depression, Parkinson’s Disease, Regularized Logistic Regression, Gradient Descent
1. Introduction
Parkinson is a very common disease around the world. It has been known from ancient times. Parkinson has another name “Kampavata” in the ancient Indian medical system. But in a Western country, we call it “Parkinson”. Parkinson formed by nerve cell damage in the brain causes dopamine levels to drop, after dopamine decreasing in our body system, leading to tremor. Tremor often oc-curs in one hand; it looks like shaking hardly and frequently especially in finger, hand or foot. Other early signs of Parkinson’s disease are voice changes, uncon-trollable movements during sleep, unbalance of handwriting, and limb stiffness or slow movement etc.
Here, we try a new method to investigate the reason that causes Parkinson by data analysis with regularized logistic regression method (this method will be mentioned later). There are certain factors which cause Parkinson. The first is environment. Environmental factors include the relationships with a person who you contact with or living condition. Second, genetics plays a role in Parkinson’s How to cite this paper: Lin, J. (2019) A
Preliminary Study on Parkinson’s Disease with Regularized Logistic Regression Me-thod. Open Journal of Social Sciences, 7, 126-132.
https://doi.org/10.4236/jss.2019.711010
Received: October 18, 2019 Accepted: November 17, 2019 Published: November 20, 2019
Copyright © 2019 by author(s) and Scientific Research Publishing Inc. This work is licensed under the Creative Commons Attribution International License (CC BY 4.0).
DOI: 10.4236/jss.2019.711010 127 Open Journal of Social Sciences diseases with some of the patients’ family history. Third, Parkinson’s diseases are also affected by individual personality. A very common personality characteristic is being ambitious and rigid. Many experts studying on Parkinson’s disease dis-covered that Parkinson patient’s wife or husband also develop a similar symp-tom. The person who has Parkinson, showed some personality traits long before they develop the disease.
2. Background
In the advent of global aging, the rapid growing of elderly populations results in a rising number of PD patients, especially in China. According to the statistical figure “Prevalence of Parkinson’s disease in China”. The rates for the whole age group were 8 - 18/100,000 years, 50/100,000 years for over 65 years, 150/100,000 years for over 75 years, 400/100,000 years for over 85 years [1]. According to the cumulative incidence of age, the risk of Parkinson’s disease among 60-year-olds at age 80 is about 2.5%. These data were derived from other studies, and we found that the population with Parkinson’s disease was predominantly elderly. However, we still need to collect data from different countries to prove that Par-kinson’s disease mostly present in elderly patients. Another data shows that approximately 1 million Americans currently have the disease. The incidence of PD in the US is approximately 20 cases per 100,000 people per year (60,000 per year), with the mean age of onset close to 60 years. The prevalence of PD is reported to be approximately 1% in people 60 years of age and older and increases to 1% to 3% in the 80-plus age group [2][3][4]. With the serious situ-ation of Parkinson’s disease, methods to cure or control the disease are highly desired. Here, we employ the logistic regression with regularization to analyze the potential cause of Parkinson’s disease. A decision boundary is given based on provided data. More complicated regression can be generalized.
3. Logistic Regression Analysis of Parkinson’s Disease
A process that preceding Parkinson’s disease in order to distinguish healthy people and patient. The purpose to utilize each data point from the collection document was trying to show the division of two types of situation. How does this data help us analyze Parkinson—people in Parkinson are hard to segregate while only appears on its superficial if thousand people mixing in a circle then we need to define their separation with a standard. Here are some steps that ex-plain how to plot a decision boundary for Parkinson’s disease.
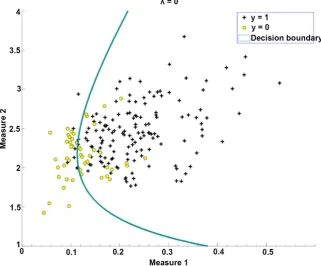
DOI: 10.4236/jss.2019.711010 128 Open Journal of Social Sciences last step of the initial part, the last one is specified in plot order which means given specific and different standards like positive or negative. The reason to set up the direction to discover the overall Parkinson group being easy to recog-nized the patients by the plot that we can use in the actual psychological experi-ment. For example, x1 + x2 = 10, predict y = 1 if x1 + x2 > 10, and y = 0 if x1 + x2 < 10. Legend 1 = legend(“y = 1”, “y = 0”) here using 1 and 0 to represent the healthy person and Parkinson patients (see Figure 1). The steps here are to es-tablish the foundation of a map a feature. To develop the idea of Parkinson’s diseases in many complicated factors. In logistic regression utilized sigmoid function because sigmoid can create a perfect curve line from negative infinity to positive infinity such as (0,1). Notice Equation (1) is sigmoid function or logistic function.
( )
1 1 exp(
)
( )
( )
1 1 exp( )
h x = + −xθ =g xθ =g Z = + −Z (1)
Logistic regression has benefits that come out appropriate S-shaped curve. Sigmoid function to return a probability value that makes easier to map the discrete variables. Basically what the logistic function is doing is taking the log of the odds of an event. The odds of an event are the probability divided by the probability of the event not occurring. The purpose right here is modeling people with Parkinson or non-Parkinson as a linear combination of various features.
4. Predict the Size and Accuracy of the Feature
[image:3.595.207.538.440.697.2]The last steps provided a basic structure of the graph. The next part(Part one) was matching the size of the feature. So set the value of x by seeking its size
DOI: 10.4236/jss.2019.711010 129 Open Journal of Social Sciences which turns to size (x). Then initialize fitting parameters. First, found the size of initial_theta = zeros (size(x, 2), 1). Because of given some specific area on which column and row. Second, after we found the initial_theta then set regularization parameter lambda, lambda = 0.1. By using lambda to create an exact estimation, when lambda smaller or more appropriate and it will suitable for plotting fea-tures, in other words, it won’t cause overfitting or failed to the training data. For example, if lambda extremely large value, then the line—decision boundary,it would be a flat line. For plotting need to use Equation (2) is gradient descent,
(
)
(
0 1)
: , , with 0,1
j j j J j
θ =θ α− ∂ ∂θ θ θ = (2)
The purpose of using gradient descent is finding the minimum of a function of multiple variables in order to figure out the data carry Parkinson’s disease. Then, compute and display initial cost and gradient for regularized logistic re-gression. Also, Equation (3) is cost function with regularization, when theta or coefficient small and reduce its effect of hypothesis function in order to get simpler results.
(
)
( )
2( ) )
0 1 1
(
1 ,
2
m
i
i i
J h x y
m θ
θ θ = = −
∑
(3) [image:4.595.211.533.438.704.2]theta needs to be small that can minimizing the function and close to 0 which get simple hypothesis. Cost function including [cost, grad] = cost FunctionReg (initial_theta, x, y, lambda). The reason we need to use cost function, lambda, and matrix in this part to label the points in the graph but giving a range. Then classify Parkinson patient through the points (see Figure 2).
DOI: 10.4236/jss.2019.711010 130 Open Journal of Social Sciences Figure 3. Decision boundary with regularization parameter λ =100.
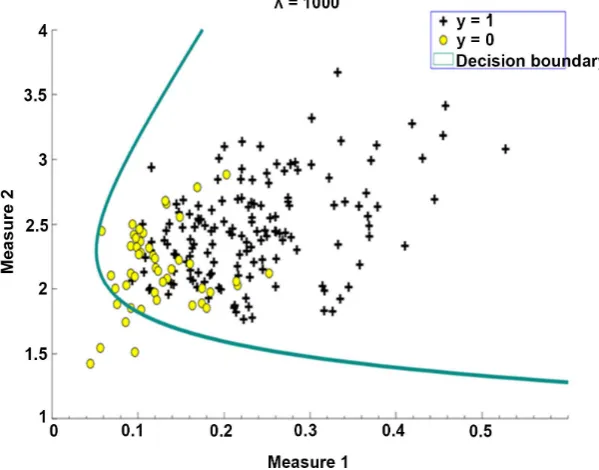
Figure 4. Decision boundary with regularization parameter λ = 1000.
Since already loading a specific range of theta and lambda, the final part is re-gularization and accuracies. Here need to repeat the steps of finding initial_theta which is the same as the last part—regularized logistic regression. Then the next step is set regularization parameter lambda to 1, lambda = 0. Equation (4) is formula Cost function with lambda:
( )
( )
( ) ( ) 21 1
2
1 2
n i
j j m
i
i
J h x y
m = θ λ =θ
Θ = − +
[image:5.595.221.521.343.578.2]DOI: 10.4236/jss.2019.711010 131 Open Journal of Social Sciences If we look at the part before lambda as an “objective”, then lambda is keep the training features small. On the one hand, when lambda estimates towards zero reduced the risk overfitting. On the another hand, Lambda set on zero because when lambda bigger and bigger then the decision boundary will not be accurate. After set lambda, it can directly go to set options and optimized (meliorate) FUNC such as t, x, y, lambda, initial_theta, options. The last step in this part was the most important. For this step need to plot decision boundary. First, labels and legends are given measure as x and y on the coordinate axis. The form as x
label (“Measure 1”) and y label (“Measure 2”). Second, then repeat the same rule as Part one. Set “y = 1” for healthy people, “y = 0” for patients with Parkinson’s disease. Third, the last term is training accuracy and predicts variables in Figure 3 and Figure 4.
Parkinson’s has such a large population. It’s impossible to give accurate results in a single table. Therefore, logistic regression can help us collect information for psychological application, which can effectively distinguish Parkinson’s patients from non-Parkinson’s patients in the population.
5. Conclusion
In this paper, we have proposed a method with regularized logistic regression to study the origin of Parkinson’s disease. Although this method is preliminary, we have given a decision boundary for deciding whether a patient has Parkinson’s disease or not by including two measures. More measures could be included in the future with high performance computers. With the number of patients with Parkinson’s disease increasing every year, the investigation into the disease is important. Since psychology is a discipline that needs to cooperate with statistics and conduct experiments, it is very important to analyze the independent va-riables in order to determine the outcome. Through calculation, the data came directly reflect the changes caused by the influence of some factors on the real population. We hope the method with preliminary results presented here could help open a new way for further investigation.
Conflicts of Interest
The author declares no conflicts of interest regarding the publication of this pa-per.
References
[1] Leroy, E., Boyer, R., Auburger, G., et al. (1998) The Ubiquitin Pathway in Parkinson’s Disease. Nature, 395, 451-452. https://doi.org/10.1038/26652
[2] De Lau, L.M.L. and Breteler, M.M.B. (2006) Epidemiology of Parkinson’s Disease. The Lancet Neurology, 5, 525-535. https://doi.org/10.1016/S1474-4422(06)70471-9 [3] Lang, A.E. and Lozano, A.M. (1998) Parkinson’s Disease. New England Journal of
Medicine, 339, 1130-1143. https://doi.org/10.1056/NEJM199810153391607
DOI: 10.4236/jss.2019.711010 132 Open Journal of Social Sciences International, 14, 430-439. https://doi.org/10.1111/ggi.12123
[5] Seber, G.A.F. and Lee, A.J. (2012) Linear Regression Analysis. John Wiley & Sons, Hoboken.
[6] Currier, J.S., Taylor, A., Boyd, F., et al. (2003) Coronary Heart Disease in HIV-Infected Individuals [J]. Journal of Acquired Immune Deficiency Syndromes, 33, 506-512. https://doi.org/10.1097/00126334-200308010-00012
[7] Neter, J., Kutner, M.H., Nachtsheim, C.J., et al. (1996) Applied Linear Statistical Models. Irwin, Chicago.