Development Of A Web Based Smart
Rainwater Buffer Dashboard
Student: Pepijn T. M. Peeters Supervisor: Richard Bults Critical observer: Hans Scholten
Date: July 2019
BACHELOR THESIS CREATIVE TECHNOLOGY
Faculty of Electrical Engineering, Mathematics and Computer Science
Abstract
During recent years, the city of Enschede is faced with more frequent and heavier rainfall, often resulting in flooding. These floods cause damage to the city and additionally pose a health risk to the citizens. To resolve this issue, a smart rainwater buffering solution was developed: conventional rain barrels are equipped with a smart control unit that discharges the barrel when anticipating rainfall, making sure sufficient buffering capacity is available. Buffering rainwater reduces strain on the sewage system, potentially preventing flooding in the lower areas of Enschede.
To give owners of such a Smart Rainwater Buffer insight into and control over their system, a web-based dashboard was needed. This dashboard should also engage the Smart Rainwater Buffer owner with their device, keeping it operational and spreading the word about the Smart Rainwater Buffer project.
This bachelor thesis focuses on the development of a web based Smart Rainwater Buffer dashboard. For this purpose, previous Smart Rainwater Buffer dashboards have been studied, together with general utility device dashboards, and weather related dashboards. Research into behavioural reinforcement was also done, to find out how users can be kept engaged with the dashboard, and therefore the Smart Rainwater Buffer.
Stakeholders were identified and interviewed to obtain preliminary requirements, which were used to design dashboard concepts. These concepts were discussed with stakeholders to obtain feedback, from which new concepts were created. After several iterations, the final concept was realised as a functional prototype. This prototype was responsive, gave insight into the SRB’s status, past and future precipitation, fill level and temperature, and incorporated gamification elements using behavioural reinforcement by means of competition and self improvement.
Due to interfacing complications with the database server, the prototype used its own local preprocessed dataset. This meant the prototype was bound to simulating a set past date. This prototype was then evaluated with stakeholders. Evaluation with stakeholders proved the prototype to be aesthetically pleasing, easy to use, and to a certain extent also engaging: the competition and self improvement gamification elements in the dashboard proved to positively impact user engagement, al be it lightly. It also became apparent that users were more motivated by self improvement than competition.
Acknowledgments
I would like to thank my supervisor Richard Bults and my critical observer Hans Scholten for their help, guidance, and feedback during this bachelor thesis.
Furthermore, I am grateful to HendrikJan Teekens from the municipality of Enschede, Jeroen Buitenweg from Waterschap Vechtstromen, Jeroen Waterink from the SRB development team, and all other stakeholders for their input, feedback, and cooperation throughout this project.
I would also like to thank Thijs Dortmann for his work on the previous version of the Smart Rainwater Buffer Dashboard. His work proved useful both as study and as inspiration for this bachelor thesis.
Table Of Content
Abstract 2
Acknowledgments 4
1 Introduction 7
1.1 RAINWATER PROBLEM OF ENSCHEDE 7
1.2 SMART RAINWATER BUFFER 7
1.3 RESEARCH QUESTION 8
1.4 REPORT OUTLINE 8
2 State Of The Art 10
2.1 SMART RAINWATER BUFFERS 10
2.2 GENERAL UTILITY DEVICE DASHBOARDS 15
2.3 WEATHER RELATED DASHBOARDS 22
2.4 GAMIFICATION ELEMENTS TOWARDS USER ENGAGEMENT 25
3 Methods And Techniques 29
3.1 DESIGN PROCESS FOR CREATIVE TECHNOLOGY 29
3.2 STAKEHOLDER IDENTIFICATION AND ANALYSIS 31
3.3 INTERVIEWS 32
3.4 USER-CENTERED DESIGN 33
3.5 REQUIREMENT ELICITATION 34
4 Ideation 35
4.1 STAKEHOLDER ANALYSIS 35
4.2 INTERVIEWS 37
4.3 PRELIMINARY REQUIREMENTS 37
4.4 CONCEPT CREATION 40
5 Specification 52
5.1 SYSTEM ARCHITECTURE 52
5.2 FINAL REQUIREMENTS 54
6 Realisation 57
6.1 CHOICE OF TECHNOLOGIES 58
6.2 DATA RETRIEVAL AND WRANGLING 59
6.3 DESIGN CHOICES 59
7 Evaluation 61
7.1 FUNCTIONAL REQUIREMENTS EVALUATION 61
7.2 TESTING PROCEDURE 64
7.3 USER TESTING 64
7.5 EVALUATION CONCLUSION 69
8 Conclusion And Recommendations 71
8.1 CONCLUSION 71
8.2 RECOMMENDATIONS 73
References 74
Appendix A - Interview Jeroen Buitenweg 78
Appendix B - Interview Jeroen Waterink 80
Appendix C - Interview Richard Bults 82
Appendix D - Interview HendrikJan Teekens 84
Appendix E - Interview Hans Scholten 85
Appendix F - Interview Eddo Pruim 87
Appendix G - Interview spreadsheet + trends 88
Appendix H - User Test Jeroen Buitenweg 91
Appendix I - User Test Jeroen Waterink 92
Appendix J - User Test HendrikJan Teekens 93
Appendix K - User Test Eddo Pruim 94
Appendix L - User Test Kasia Zalawska 95
1
Introduction
This introductory chapter will explain the problem and challenges that this project seeks to solve. A research question will be formed, after which the report will be outlined.
1.1 RAINWATER PROBLEM OF ENSCHEDE
Enschede is having trouble with rainwater management, occasionally resulting in flooding. The city is built on a push moraine: the upper parts of the city are about 44 meters higher than the lower parts[1], as illustrated in Figure 1.1.1.
Figure 1.1.1: Height map of Enschede: from high to low; from NAP + 68 m to NAP + 24 m, 44 m difference in altitude. [1]
Since Enschede is full of buildings and streets that do not allow rainwater infiltration, most rainwater has to be drained via the city’s sewer system. The increasing amount of rainwater in recent years has puts too much stress on the (currently mixed) sewer system [2]. This results in a lot of rainwater flowing down the slope of the city, towards the lower areas, consequently flooding these areas. This poses a health risk, and causes a lot of water damage related costs both for citizens and (insurance) companies.
1.2 SMART RAINWATER BUFFER
overflowing their bounds, they are often connected to surface water nearby. The stadsbeek project builds a brook through the north of Enschede since streams and ponds also act as buffers during rainfall.
Another buffering project is the Regentoren project: a network of Smart Rainwater Buffers (SRB)[5]. The Regentoren project aims to upgrade conventional rain barrels with a smart monitoring and control device. The SRB will then discharge rainwater before rainfall, making sure it has the capacity to buffer the incoming rainwater. If these units are rolled out en masse, a lot of rainwater that would normally have to be transported by the sewer system, is stored till after peak moments, reducing stress on the sewer system [6].
The SRB can still be used as a regular rainwater barrel by the owner; e.g. collected water can be used for watering the garden, keeping the soil moist. SRBs can also offer solutions for the sewage system. For example, emptying a full SRB into the sewer will give a huge burst of water, that can blast away clots that build up in the sewers, particularly in the capillaries of this system. For economic and environmental reasons, it is preferred that the owner of the SRB uses the water themselves, rather than flushing it down the sewage system. To motivate an SRB owner to actually do so, the owner needs to feel that his efforts are meaningful, either for themselves or for the community.
SRB owners need to have insight in and control over their SRB. This will be provided via a web based dashboard. That dashboard is a leverage to keep the SRB owner engaged with the Regentoren project, allowing them to see what they accomplish by owning and using an SRB. This should motivate them to use the SRB in their daily lives.
1.3 RESEARCH QUESTION
The goal of this research project is to make a user dashboard for the SRB owner. This dashboard should provide insight into the performance of the owned SRB, and give control over it, and keep a user engaged with the product. This brings up the following research questions:
“How to develop a web-based dashboard that keeps the owner engaged in using their SRB?”
“What are the most important gamification elements for behavioral reinforcement to stimulate engagement?”
“How to incorporate these elements in the dashboard?”
1.4 REPORT OUTLINE
research of the stakeholders, to find their needs and requirements. From this, chapter 5 will decide on the exact specifications of the project, for it to be realised in chapter 6 as a prototype. This prototype will be evaluated in chapter 7. Finally, conclusions will be drawn in chapter 8, followed by recommendations for further
2 State Of The Art
In this chapter, the state of the art on Smart Rainwater Buffer dashboards will be discussed. This includes previous work on SRBs and their dashboards, but also general utility device dashboards (e.g. dashboards of smart home systems) will be discussed. Since the SRB is a weather bound product, dashboards related to weather will also be explored. To engage users with the Smart Rainwater Buffer dashboard, gamification with behavioural reinforcement to stimulate engagement is addressed in a literature review.
2.1 SMART RAINWATER BUFFERS
Firstly, already existing dashboards for Smart Rainwater Buffers were studied. Dashboards included in this research where concepts for the Regentoren project,
University of Twente
As part of the Regentoren project, the municipality of Enschede is investing in the development of SRBs. This is done together with the waterboard Vechtstromen. The SRBs are developed by the University of Twente.
The first version was developed by Vetter[7], as shown in Figure 2.1.1. This version used an industrial container, to have a big capacity. Vetter did not include flow sensors, meaning only the held amount of rainwater could be measured. Temperature sensors were added: when water was about to freeze or at risk for contamination with bacteria like legionella, owners could be notified. Another option would be to automatically discharge the SRB when its content is at risk.
[image:11.596.190.405.493.710.2]
Figure 2.1.1: prototype developed by Vetter[7]
Since his project was more focussed on the physical aspects of the SRB, this dashboard was more of a functional engineering prototype. It consists of a basic webpage, showing the SRB’s location, water temperature and the amount of collected water. One interesting statistic that Vetter added is an expectation for how much water will be collected during the next rainshower. For this purpose, the user has to fill in the size of their rooftop in square meters.
[image:12.596.91.508.190.459.2]
Figure 2.1.2: functional engineering prototype dashboard developed by Vetter[7]
Steeghs[2] and Rindt[6] also developed an SRB, but focused more on household sized barrels to better fit and suit people’s gardens (shown in Figure 2.1.3). Their version used a regular rain barrel that was modified to work as an SRB: it was equipped with a sensor to measure water levels, electronic valves for rainwater output control, flow sensors to measure rainwater going in and out, and a small microcontroller. The SRB would discharge when rainfall was expected, or when requested by either the consumer dashboard or the administrative dashboard. These dashboards where developed by Rindt and Steeghs respectively.
Figure 2.1.3: prototype developed by Steeghs and Rindt[6]
Steeghs’ dashboard, for the municipality, is shown in Figure 2.1.4. Rather than showing rainwater collection levels per buffer, the collected water is expressed per area, both in liters as well as percentage of the total holding capacity of that area. Averages of the neighborhood are presented using bar, pie and line graphs, to show how much rainwater has been collected, how it was used, as well as what the weather and subsequent SRB behaviour will look like. This interface does not offer any control over the privately owned SRBs.
Figure 2.1.4: The dashboard for the municipality developed by Steeghs[2]
[image:13.596.89.507.442.673.2]
water is routed to (garden or sewer). Lastly the user can manually open or close the discharge mechanism, as well as request a specific amount of collected water to be drained.
[image:14.596.89.511.148.421.2]
Figure 2.1.5: dashboard for the SRB owner developed by Rindt[6]
Figure 2.1.6: SRB owner dashboard by Dortmann[8]
Non University of Twente rainwater collection systems
The University of Twente is not the only organisation working on rainwater buffering systems. Another rainwater buffering project in the Netherlands is “Slimme Regenton”, a project by Waterschap Amstel Gooi en Vecht and Studio Bas Sala[9]. This project mostly aims at custom made public space buffers, often having a double function as art or decoration. The “Slimme Regenton” is also deployed at consumers, though not yet on a large scale. No public imagery regarding their consumer dashboard was found.
In Ontario, Canada, an organisation called RiverSides developed the RainGrid[10]. The RainGrid team has since split off from RiverSides, now being its own separate company. Their setup is very similar to the previously named SRBs, with one notable difference being that the buffer container is part of the product. This means people do not get to choose their own barrel, style and capacity.
The RainGrid effort from RiverSides also has a dashboard for the owner of the rainwater buffer (Figure 2.1.7). Their dashboard only shows the amount of water in the buffer as a percentage, only giving liters for the total amount of water that was diverted using their SRB. A big part of this dashboard is dedicated to the weather forecast, rather than statistics about the SRB. This means the user engages with the dashboard also for their own needs, rather than just for the SRB. The user is also given control over the drainage functionality.
Figure 2.1.7: RainGrid dashboard snapshot, taken from the official website [10]
2.2 GENERAL UTILITY DEVICE DASHBOARDS
Several dashboard of other utilities where studied, including the Nest smart thermostat[11], the Strava social fitness network[12], the Tesla app[13] and the Fitbit activity tracker[14]. Each utility is discussed in its own section, with a focus on customisation, gadget appeal and persuasive design.
Customisation can be a good way to make an experience tailored to the user. Customisation can increase the effectiveness of an interface, or ease of use for users. Think of dark modes for certain apps: these can reduce strain on the eyes for people using them in dark environments, while a light mode still offers a clearly visible app to those using it outside, during the day. Customisation can also allow a user to express themselves to others, or change an interface to appeal to them. These kind of customisation options can keep users interested and engaged with a product.
Gadget appeal can engage users with a product in more situations, either because of the functionality or because of the social aspect of showing off new technology. People sharing their fancy new tech with others also works as an advertisement for the product, popularizing it. Gadget appeal is often added by implementing helpful little functionalities, to make products just a bit more interesting.
Nest Smart Thermostat
The Nest Smart Thermostat, shown in Figure 2.2.1, is a thermostat that tries to optimize for environmentally friendly heater usage. To do this, it tracks the requested heating, as well as when users are not at home, or asleep. Then a smart algorithm slowly takes over control of the heating from the user, optimizing it not only to fit the users desires, but also to perform as environmentally friendly as possible. The interface of the Nest Smart Thermostat is kept fairly simple, only showing the requested temperature and the actual temperature. A green leaf is displayed when the Nest Smart Thermostat detects that heating is done more efficient than a regular thermostat.
Figure 2.2.1: Nest Smart Thermostat [11]
The Nest smart thermostat allows for custom use rather than custom design. The thermostat can be conFigured and trained to operate on a customized schedule, which is its main selling point. If the user does not feel like going up to the device itself, the Nest thermostat can be controlled remotely using a phone app. By having these options available, the user can customize their experience to suit their needs.
The Nest smart thermostat also made efforts to have a gadget appeal. The design is very sleek and small, using a color display with fancy animations. The device is controlled with a rotating ring on the outside, and the entire device also functions as a button. To make the device feel even more interactive, the screen lights up as soon as the device is approached. This all makes the Nest smart thermostat feel like a very polished and premium device.
people will try to be better than average, thus reducing energy use even further.
Strava fitness app
Strava is a fitness app that tracks a sporter’s route, speed, distance, etc. The phone app can also be connected to a wide variety of smartwatches, GPS trackers and activity wristbands. During activity, it can show stats like how long you’ve been active, your heart rate, spit average pace, and distance travelled, as shown on the right in Figure 2.2.2. The Strava app can be used to compare and compete with both your own previous workouts as well as your friends and other nearby users. For this purpose, the Strava app also contains user profile functionality (center of Figure 2.2.2), which can be visited and viewed by other users. Activities can also be posted. This will publish them in a feed showing all activities of friends, shown on the left in Figure 2.2.2.
Figure 2.2.2: Strava social fitness app [15]
Strava does not allow for a lot of customisation. The only customisation users get is options to customize their profiles.
For gadget appeal, Strava itself does not do much either. Most of Strava’s gadget appeal rather comes from the devices you connect to it. The app allows for all kinds of smartwatches and fitness devices to be connected to measure the user’s performance. This can bring a lot of extra functionality to the app. After sporting, users can also show others their course: by carefully picking their path, users can ‘draw’ something on the map, often resulting in showcases on social media.
competition by a functionality called ‘segments’. Segments are parts of the road network that are detected to often be part of workouts. Everybody that crosses such a segment will be recorded on a scoreboard, as seen in Figure 2.2.3. The user that traverses such a segment the fastest will be the ‘top of the hill’. After each workout, users will also be shown a list of other strava users that they passed closely during their workout. Another function offered by Strava are challenges, where users worldwide can compete to e.g. climb the most distance by bike, or run a half marathon as fast as they can. Lastly users can create ‘clubs’, where similar competitions can be held between groups of friends. As means of persuasion without other people involved, Strava offers users to set a fitness goal, making them compete with themselves.
Figure 2.2.3: A leaderboard in the Strava Fitness app [16]
Tesla App
charging.
Figure 2.2.4: Tesla Motors app [13]
The Tesla app itself does not have much of customisation for the interface, but instead Tesla provided an API allowing third party developers to make their own apps for the same purpose. This has sprung up numerous apps that look and function differently from the official app developed by Tesla. A notable example is the Remote S app[17], visible in Figure 2.2.5, an app developed by an active community member of Tesla. Remote S includes all functionality form the official Tesla app, but is also capable of planning a route, finding the closest charging point, and integrating with the apple watch and siri.
Figure 2.2.5: interface of the Remote S app [18]
The app of Tesla motors is helpful, but for a big part just a gadget appeal feature of the Tesla car itself. The app is not necessary: every function can be done using the car itself. The app just makes them easier, and possible from anywhere. The owner is granted full control over the car via the app: doors can be unlocked, the roof can be opened, the climate can be controlled, and even the car can be moved, all from within the app. Everything that happens is also fed back into the app: full insight is given into every aspect of the car. The owner is also given a prediction of the estimated performance, given the current charge level.
Persuading users to act wisely is done by the Tesla app. The user can set a goal charge level for their car, so that they only have as much energy stored as they need. This encourages users to think about the environment and their energy bill when charging their Tesla car.
Fitbit
day. The amount of steps taken that day are also shown separately, measured with a gauge, again to show whether the daily goal is reached. Next to this, the amount of calories the user burned that day are displayed. Also shown are the total distance the user has walked/run, how much sleep they got that night, and how many floors they climbed. Users are also given a comparison of their calorie intake and their burned calories.
[image:22.596.76.523.192.440.2]
Figure 2.2.6: Fitbit bracelet and web dashboard[14]
The Fitbit dashboard allows the user to customize their experience by changing the layout of the dashboard, as well as what elements are displayed. There are also options to allow users to switch how their performance is indicated. The Fitbit bracelet offers customisation by allowing the user to pick their own background, as well as changing the strap of the device. This also allows users to express themselves using their Fitbit, by choosing how they present themselves to others. A black leather strap gives an entirely different impression than a woven pink strap.
The Fitbit activity tracker has a lot more functionality built in than needed for just sports tracking. Helpful things during sport include a stopwatch and alarm, but Fitbit also includes a weather forecast, a message system for your smartphone, and contact payment using only the device. The device is not only controlled by a touch screen, but also has a contact button that has a haptic click, making it feel like an actual button, and very high tech.
2.3 WEATHER RELATED DASHBOARDS
Existing weather related dashboards were studied. These include the interface of a home weather station, and online weather forecast websites.
Alecto WS-4800
The Alecto WS-4800 is a weather station that measures temperature, wind direction and speed, humidity, air pressure, wind chill and dew point[19]. It also tracks rainfall, and has an interface where it can show these stats. The downfall can be toggled to be shown over the past hour, day, week or month. This data is shown as a plain number, with its unit (1, 2 and 5 in Figure 2.2.7). The user is also shown the downfall per day, for the past five days. This data is depicted as small bar graphs, labelled 3 and 4 in Figure 2.2.7. No power is granted to customize how this interface displays its data.
Figure 2.2.7: The Alecto WS-4800 interface as shown in the instruction manual [19] 1: rainfall
2: rainfall unit being in (inch) or mm (millimeters) 3+4: rainfall over the past 5 days
5: indication over what timespan rainfall has been measured 6: lights up if the max rainfall alarm has been set
Yr
A norwegian weather forecast website, yr.no[20], defaults to showing the user the forecast of a city per day as shown on the left side of Figure 2.2.8. To the side, a small map is shown that animates downfall as a heatmap, 60 hours into the future, as seen on the right side of Figure 2.2.8. But upon request, the forecast will be shown per day more elaborately: weather can be shown as a graph over time, shown in Figure 2.2.9. The website also grands some additional information, like the times when the sun and moon rise and set. Yr.no also looks for webcams in the area of attention, so if the user wants to see the weather for themselves they can check out a live feed.
Figure 2.2.8: yr.no default interface [20]
Figure 2.2.9: yr.no graph interface [20]
Weatherbug
Weather forecast website weatherbug[21] focuses less on weather forecast, but instead mostly shows stats about the current weather, as seen in Figure 2.2.10. Only small descriptions are given about the weather of the coming night and the next day. The “now” page stats are very elaborate, not just including temperature, rainfall and wind speed, but also informing about air quality, pollen and lightning strikes. If more info is desired, a forecast per hour or per 10 days is also available in a different tab, al be it less detailed. Weatherbug also offers a few dedicated pages to specific topics like regional alerts, hurricanes and even cold and flu spreading.
Figure 2.2.10: Weatherbug’s web interface [21]
Buienradar
The buienradar[22] website keeps its interface rather minimal on opening, as seen in Figure 2.2.11. Only a three day weather forecast and an hourly downfall graph and heatmap are shown. On request, buienradar will show the weather forecast for 14 days. The website also offers to show heatmaps of wind and temperature, and even UV radiation. As a service to developers, buienradar offers weather data in both JSON and RSS formats. For even easier implementation, buienradar offers widgets that can show either a map
2.4 GAMIFICATION
ELEMENTS
TOWARDS
USER
ENGAGEMENT
The dashboard that informs the owner of the current status of their SRB, as well as gives them control over it, is an opportunity to engage users. For this purpose, gamification is considered. Gamification allows for elements of video games to be used for different kinds of applications. One way videogames keep people engaged is by using behavioural reinforcement. In behavioural psychology, a reinforcement is a consequence that is given to an organism based on their actions, to strengthen their future behaviour. This conditions the subject to act towards the desired behaviour. Behavioural reinforcement knows a variety of schedules, differencing in when the reinforcement is actually applied. Reinforcers can both be negative or positive. Both will guide the behaviour towards the desired outcome.
The goal of this literature review is to find how behavioural reinforcement can be applied to this dashboard to engage users with the SRB. The main research question is: “How can gamification with behavioural reinforcement keep people engaged with digital media?” This question will be supported by three other questions: “How does behavioural reinforcement relate to gamification?”, “What reinforcement schedule is best fitted for keeping people engaged with gamification?” and “What factors influence behavioural reinforcement?”.
Relation between behavioural reinforcement and gamification
An important feature to implement in video games is reward and punishment, to reinforcing the player in their skillful play, engaging the user. Chubley and Griffiths [23] connect gaming addiction to these reinforcement features. They also describe how players often consider reward and punishment one of the most important and enjoyable features in video games. King et al. [24] outline a feature model of video game structural characteristics, including reward and punishment, that influence excessive video game playing behaviour. They explain that these features may facilitate initiation, development, and occurence of video game playing.
Most research does agree video game addiction is similar to other addictions though, rather than a result of separate mental issues. In an article discussing wood’s work, Griffiths [27] provides further thoughts and observations saying that very few arguments presented by Wood actually negate the existence of video game addiction. He then goes on to criticize Wood for not giving his own definition of an addiction. Griffiths has been researching the relation between video game addiction and reinforcement in multiple papers, drawing similarities between gambling and gaming, and describing it as a non-financial way of gambling [28][29]. Mathews et al. [30] also connects video game addiction to other behavioural addictions. This research builds forth on the discovered similarities in effect and presentation to other behavioral addictions. Gaming addiction and other addiction forms like gambling addiction activate similar brain regions as drugs of abuse, including the mesolimbic reward system and amygdala[31][32][33]. This means the medical world also sees video game addiction as something similar to gambling addiction. As Kuczmierczyk et al. [34] and Keepers[35] describe, video game addiction is treated the same way as gambling addiction.
Reinforcement schedules for digital media engagement
In behavioural reinforcement, the effectiveness of the conditioning varies strongly on the pattern of the reinforcement. This is called the reinforcement schedule. Different schedules show varying rates of learning behaviour, as well as how long behaviour continues once reinforcement is seized. In the case of gamification, it is preferred that response rates are as high as possible, and that behaviour post-reinforcement lasts as long as possible. Fester and Skinner [36] lay out several simple reinforcement schedules. The first category is based on ratio: the reinforcement depends on the amount of responses of the subject. This includes continuous (every response), fixed (every nth) or variable (average on every nth). The second category is based on interval: the reinforcement is delivered after a time interval. This interval can be fixed, or change with every reinforcement. The third category is time: reinforcement is delivered on a timer, independent of behaviour. This timer too, can be either fixed or variable.
Behavioural reinforcement factors
The effectiveness of behavioural reinforcement in gamification can be influenced by four factors. The first factor is thinning. When using a variable rate reinforcement schedule, the subject can be made to respond more and more before receiving each consecutive next reward. This means the next reward is always just a tiny bit more work than the previous one. Subjects are drawn in using a lot of reinforcements, but will have to respond more and more to keep receiving reinforcements. This concept is called thinning. Implementing thinning in a variable ratio reinforcement schedule will increase response rates, and decrease the chance of extinction [38][39].
The second factor that influences behavioural reinforcement is the “Near-Miss” experience. When implementing behavioural reinforcement, near win situations should be taken into consideration. Video game players perceive a close defeat attempt as one that came very close to winning, rather than purely perceiving the attempt as a loss. Griffiths [40] proved this to be the case on fruit machine gamblers, describing the “Near-Miss” experience. King et al. [24] points out these experiences can be made to occur on purpose in video games, as an added feature. Wadhwa and Kim [41] conducted further research, showing that nearly winning can kindle motivation within the player.
The third factor to influence behavioural reinforcement is the event frequency. To maximize the effect of a reinforcement schedule, a subject should have the possibility to respond again as soon as possible after each reinforcement, and reinforcements should be kept small. Larger wins were associated with disrupt response rates causing bigger post-reinforcement pauses, decreasing event frequency [42]. The event frequency and reinforcement schedules like fixed interval reinforcement are inherently tied together. This means that a change in either one can affect the outcome both of the behavioural reinforcements as well as the willingness of the subject to respond. The event frequency, or how fast a subject can try make another attempt after a previous reinforcement, has an effect on the subject’s will to do so [43][44]. Parke and Griffiths [45] explains that because of the high event frequency, the loss period is very brief. This means the player does not put much thought into investment, and lost money could be won back almost immediately.
Conclusion/Discussion
To persuade users to upgrade their rain barrel to an SRB, as well as persuade users to spread the word, they must be engaged with the SRB. The web-based dashboard that gives them information and control could be a way to offer this engagement. The task of this literature review is to find how gamification using behavioural reinforcement can be applied to a Smart Rainwater Buffer dashboard to engage the user with it. The goal of the literature review is to determine how gamification with behavioural reinforcement can keep people engaged with digital media. To Figure this out, this literature review looked into the relation between behavioural reinforcement and gamification, the best fitted reinforcement schedule for gamification, and the factors that influence behavioural reinforcement. It was found that behavioural reinforcement in video games lead to very engaging and addictive experiences. To maximise engagement, it is advised to use several reinforcement schedules, preferably including fixed ratio and variable ratio reinforcement. When picking reinforcement schedules, the effect of the near-win should be taken into account, as well as the event frequency of the gamification element. To minimize extinction in the subject, thinning should be implemented in the variable ratio schedule. As reinforcer, it is advisable that positive reinforcement is used in gamification, rather than negative reinforcement. This is not because one is better than the other, but because positive reinforcement is associated with joy, while negative reinforcement is associated with frustration. Deliberate extinction should also be taken into consideration.
3 Methods And Techniques
This chapter describes the methods and techniques used in this project. First, the main design process, the Design Process for Creative Technology will be discussed. Then, stakeholder identification will be described, followed by semi-structured interviews and User Centered Design. Finally, the requirement elicitation using MoSCoW and Functional/Non-Functional categorisation will be explained.
3.1 DESIGN PROCESS FOR CREATIVE TECHNOLOGY
The study of Creative Technology has its own design process that is woven into the curriculum. This is why the Creative Technology Design Process[47] is the main method of this bachelor thesis. The Creative Technology Design Process is based on the Divergence and Convergence model of Jones[48]. Jones’ model consists of a divergence phase followed by a convergence phase. The divergence phase allows the design space to be defined and opened up, after which the convergence phase reduces said design space to find the best fit solution. The Creative Technology Design Process is also a spiral model; the process of exploring possibilities and finding options is iterated to find multiple solutions. There are four main phases to the Creative Technology Design Process: ideation, specification, realisation, and evaluation, each of which is elaborated on in the coming subsections. The full structure of the Creative Technology Design Process can be seen in Figure 3.1.1.
Figure 3.1.1: Design Process for Creative Technology, by Mader and Eggink[47]
Ideation
The first phase of the Creative Technology Design Process is the ideation phase. This phase was started by finding stakeholder requirements. First, stakeholders are identified and categorised using the method of Sharp et al.[49]. Then, preliminary requirements are found using semi structured interviews. From there, many ideas are generated, using knowledge gained through the State of the Art research. The resulting ideas are considered and narrowed down using preliminary requirements and feedback obtained from stakeholders. The chosen idea is then iterated on to form the final outcome of the ideation phase.
Specification
retrieved from stakeholders. The low-fi prototype was iterated on with stakeholder feedback, till all requirements were met, and all stakeholders were positive about the design concept.
Realisation
The third phase of the Creative Technology Design Process is the realisation phase, where a functional product prototype is realised. The specification from the previous state is decomposed into components that can be realised and tested separately. They will be evaluated against the set requirements from previous phases and iterated until all requirements are met. Lastly, they can be integrated into a full prototype.
Evaluation
The fourth and last phase of the Creative Technology Design Process is the evaluation phase. Now that a functional prototype is realised, it will be evaluated against the functional requirements from previous phases. All requirements in the “Must” category of the MoSCoW categorisation have to be met by the prototype. Any requirements from the “Should” category will need to be met as well, but failing to do so will still result in a successful evaluation. Any met requirements from the “Could” category add to a positive evaluation, but really do not have to be met. Requirements from the “Won’t” category are not expected to be met. If all functional requirements are met, stakeholder input or user testing can determine whether Nonfunctional requirements are met as well. User testing can also tell whether the user experience is as desired. At last, the entire project will be evaluated, including a commentary of proposed improvements for further research.
3.2 STAKEHOLDER IDENTIFICATION AND ANALYSIS
Part of the ideation phase is the stakeholder identification and analysis. To identify the stakeholders of this project, the stakeholder identification method of Sharp et al.[49] will be used. Sharp et al. propose a method that divide stakeholders into four groups:
- Users - Developers - Legislators - Decision-makers
or supervisors. All identified stakeholders will be mapped on Mendelow’s power versus interest matrix[50], shown in Figure 3.2.1. This makes clear which stakeholders are important for the development of the new product.
Figure 3.2.1: Mendelow’s Power vs Interest (Dynamism) matrix [50]
3.3 INTERVIEWS
To obtain preliminary requirements from the stakeholders, they will be interviewed. Interviews can be done in five different ways[51]: structured, semi-structured, unstructured, informal, and focus groups.
Structured interviews make use of questions that are created prior to the interview. During the interview, a guide is used to steer the discussion. This leaves little room for open answers, but leads to very efficient interviews producing consistent data that can easily be compared across interviewees.
Semi-structured interviews are also steered by an interview guide, with earlier created questions. However, when a researcher senses a user can give more helpful response when following a different trajectory, they can deviate from the interview guide.
An unstructured interview is conducted in a formal setting. However, no prearranged questions or guides are used during the interview. The interviewer has a clear plan in mind regarding the focus and goal of the interview.
An informal interview takes place in a casual setting. During an informal interview, the interviewer talks with the interviewer in a normal way, resembling a regular conversation. This allows the interviewee to really speak their mind openly.
used. Doing so will ensure that important aspects are considered by every stakeholder, while the possibility of exploring interesting answers is available.
3.4 USER-CENTERED DESIGN
User-centered design is an iterative design approach, in which the developer is focussed on the users and their needs[52]. This is different from participatory design, where users are also closely incorporated in the development process. Their respective differences are visualized in Figure 3.4.1.
In this project, user-centered design is implemented by getting feedback of stakeholders for each iteration in the ideation phase. Firstly, preliminary requirements are retrieved from stakeholders, in the case of this project using semi structured interviews, from which dashboard concepts are developed. These concepts are discussed with stakeholders again, to select the most, the best ‘matching’ concept. During the Ideation phase, these steps are repeated until all stakeholders are happy with the dashboard concept. During the specification and realisation phase, stakeholders are not involved.
Figure 3.4.1: ”The current landscape of human-centered design research as practiced in
3.5 REQUIREMENT ELICITATION
After identifying the stakeholders and obtaining the preliminary requirements in semi-structured interviews, it is important to categorize them. This project has a limited timespan, and so it might occur that there is not enough time to implement all preliminary requirements.
MoSCoW
One method to categorize requirements is MoSCoW[53]. The MoSCoW method does so by using four categories:
- Must Have - Should Have - Could Have - Won’t Have
Requirements that are vital for the project are marked as Must Have. If the project does not meet those, it might as well be cancelled. Requirements that are not vital to the product but still very important are marked as Should Have. When requirements are still desired, but do not affect the success of the product, they are marked as Could Have. Any requirement that will not be implemented this development cycle will be marked as Won’t Have. This means work effort has to focus on Must Have requirements, while also trying to complete as many Should Have requirements as possible. Any spare time will be dedicated to Could Have requirements.
Functional and Non-Functional Requirements
4 Ideation
This chapter describes what happened during the Ideation phase of the project. First, a stakeholder analysis was conducted. Said stakeholders have then been interviewed in a semi-structured interview, to obtain a list of requirements. These requirements are categorised to form preliminary requirements. From those preliminary requirements, concepts are developed. The concepts are then iterated on. Each iteration builds on the feedback that stakeholders have on the previous iteration.
4.1 STAKEHOLDER ANALYSIS
Using the method of Sharp et al.[49], the stakeholders have been identified (see Table 4.1.1). Each stakeholder is explained further in their specific subsection.
Stakeholder Contact person Category
Municipality of Enschede HendrikJan Teekens Decision-maker Waterschap
Vechtstromen Jeroen Buitenweg Legislator
Developer Pepijn Peeters Developer
University of Twente Richard Bults
Hans Scholten Decision-maker Legislator Pre-pilot participants Jeroen Waterink
Jeroen Buitenweg HendrikJan Teekens Hans Scholten Eddo Pruim Richard Bults
User
Table 4.1.1: Identified stakeholders and their category in the Sharp et al.[49] method.
Municipality of Enschede
The municipality of Enschede is one of the partners in the development of the Smart Rainwater Buffer and its accompanying systems. This means that the municipality has a good amount of power in the development of the Regentoren project. The interest of the municipality is equally high as its partners: it is their responsibility to resolve the rainwater drainage issues in the lower areas.
University of Twente
Twente has a lot of power over the project, even though they will not use the product themselves. As one of the partners of Regentoren, the University of Twente has a high interest in the project.
Waterschap Vechtstromen
The Waterschap Vechtstromen is also one of the partners of the Regentoren project. The Waterschap Vechtstromen is responsible for the water in the area. Just like the other partners, their interest is high. Waterschap Vechtstromen is also the only legislative stakeholder. This means that their power is also moderate.
Developer
As the party that actually applies all decisions and findings, the developer has a moderate amount of power. As the developer is not a party that facilitates or requires the development of the project, it is important to keep a neutral stance. Taking too much of this power can negatively influence development. The project has been chosen as a bachelor thesis by the developer. Hence, their interest is just as high as the project partners.
Pre-pilot participant
Pre-pilot participants are the target group of this project. These people are the innovators that like to try their hands on new technology. Having signed up as pre-pilot participants themselves, they have a very high interest in the Regentoren project, including the accompanying dashboard. As representatives of end users, the pre-pilot participants have a high amount of power.
Power vs Interest Matrix
Using the method of Mendelow[50], a power-interest matrix can be made, as shown in Figure 4.1.1. Note that even though the Developer has a high interest, they are not assigned to a category. Given the position of each stakeholder on the matrix, we can conclude the priority groups as shown in Table 4.1.2.
Priority Group Stakeholders
Manage Closely Municipality of Enschede
Pre-pilot participants Waterschap Vechtstromen University of Twente
Keep Satisfied None
Keep Informed None
Monitor None
Figure 4.1.1: The Interest vs Power Matrix using Mendelow’s method[50]
4.2 INTERVIEWS
Several semi-structured interviews were conducted with all pre-pilot participants, to find out what is needed from the dashboard. Each individual was interviewed separately, while notes were taken of the answers. These notes can be found in appendix A till F. As the interviews were conducted in dutch, the notes are in dutch too. After finishing all interviews, all the collected notes where interpreted and laid out next to each other in a spreadsheet, which can be found in Appendix G. This spreadsheet too, was made in dutch. Doing this allowed trends to be discovered, leading to preliminary requirements.
4.3 PRELIMINARY REQUIREMENTS
Must Have
Functional Nonfunctional
FR01: The dashboard must display a history and forecast of precipitation, temperature and the SRB’s fill level
NFR01: The dashboard must have a responsive layout: users must be able to comfortably view the dashboard on any device.
FR02: The display of history and forecast must be scalable to fit the user’s desires, e.g. day, week, month, etc
FR03: The dashboard must display the SRB fill level
FR04: The dashboard must display the water’s temperature
FR05: The dashboard must display the current time and date
FR06: The dashboard must show the
location of the SRB
FR07: The dashboard must show the status of the SRB and its subsystems
FR08: If the SRB status changes, then an explanation should be given of the situation and how to resolve it when applicable
FR09: A rain forecast map must be available in the dashboard, displaying the same data as used by the SRB
FR10: The calculation constant of the volume of the SRB must be adjustable in the dashboard
FR11: The calculation constant of the size of the collection area/roof must be adjustable in the dashboard
FR12: The user must be able to set a desired fill level in the dashboard: this will ensure a certain amount of water
is left behind after an automatic discharge
FR13: Users must be able to understand the SRB and its actions: each event should have an explanation available
Should Have
Functional Nonfunctional
FR14: Information about water throughput should be displayed: how much water was discharged, manually used, or overflowed during a rainshower
NFR02: Users should find the dashboard professionally looking
FR15: The users should be able to cancel and plan automatic discharges on their own
NFR03: Desktop and mobile phone versions of the dashboard can change the layout of elements, but not the elements themselves
FR16: Insight should be given into average performance of all SRBs in a given search radius
Could Have
Functional Nonfunctional
FR17: Functionality to see information about SRBs of friends could be
provided
NFR04: A simple layout that only shows info about the here and now could be provided
FR18: The dashboard displays how the SRB network has helped to relief Enschede’s sewer system
FR19: The dashboard could provide functionality to customize the layout
Won’t Have
Functional Nonfunctional
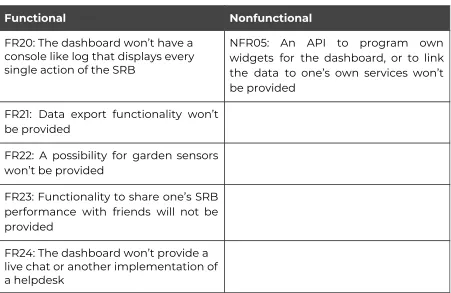
FR20: The dashboard won’t have a console like log that displays every single action of the SRB
NFR05: An API to program own widgets for the dashboard, or to link the data to one’s own services won’t be provided
FR21: Data export functionality won’t be provided
FR22: A possibility for garden sensors won’t be provided
FR23: Functionality to share one’s SRB performance with friends will not be provided
FR24: The dashboard won’t provide a live chat or another implementation of a helpdesk
[image:41.596.73.524.99.392.2]
Table 4.3.1: All identified preliminary requirements, categorised by Must, Should, Could and Won’t have, divided into Functional and Nonfunctional.
4.4 CONCEPT CREATION
The found preliminary requirements are used to create several iterations of concepts to find the final design of the dashboard. Each iteration is discussed with all stakeholders to refine a next version.
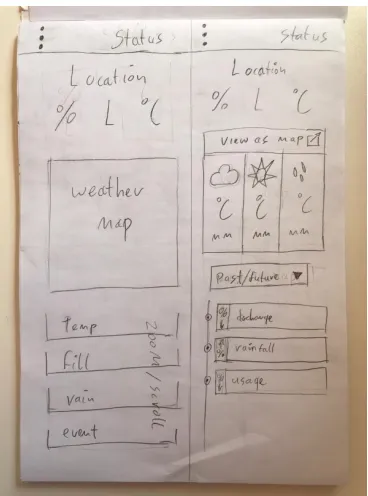
Sketches
Figure 4.4.1(left): desktop layout sketch 1
Figure 4.4.2(right): desktop layout sketch 2
Figure 4.4.3(left): desktop layout sketch 3
Figure 4.4.4(right): desktop layout sketch 4
Corporate design
The Regentoren project has developed a corporate design. The Regentoren project design style is very spacious, using a lot of white. The layout is build up of squares. For styling, elements are rounded and use drop shadows for depth. This design style is applied to everything connected to the Regentoren project, as can be seen in the concept of the project’s website shown in Figure 4.4.6. This corporate design serves as a source of inspiration for the design style of the dashboard.
[image:43.596.76.529.230.459.2]
Figure 4.4.6: the concept information website of the Regentoren project[55].
First concept iteration
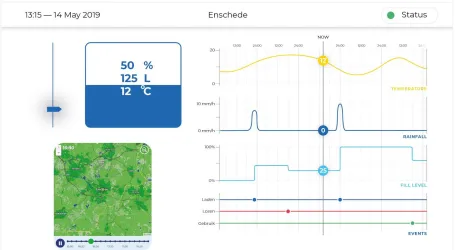
Since the mobile version should only change the layout of the dashboard, but not the functionality (NFR01), only the desktop version is made during the concept iterations. Combining the selected layout sketch (Figure 4.4.2) and the corporate design style, a first concept was created digitally, as an image (Figure 4.4.7). The layout was not altered, but each element, especially the graphs, where refined and further worked out.
graph, showing each value for the present time (FR01). The graphs are zoomed to show two more days of prediction, and two more days in the past (FR01). The shadows on the sides of the graphs signal the user that the borders are not fixed: the graph can be moved further into the past or future by dragging (FR02). By hovering the mouse over the graphs, the hair that is displayed in the middle in the image will jump to the x position of the mouse, giving a reading at that point. “NOW” will update to the selected point in time.
Since each graph is linked by x axis (time), a certain continuation should be kept between them. But since they are separate graphs with separate y axis, they should not be shown as one graph. As a middle way between totally disconnected graphs, and one graph with multiple data lines, the four graphs are put up separately while connected by every other vertical grid line. The y axis of each graph should automatically scale appropriately to the data that falls within the currently visible timespan (FR02).
Zooming the graphs (FR02) will be done by scrolling while hovering the mouse on the graphs. The fourth graph utilises the graphical “metro line” info system to display at what points in time an event happened, defined by which line such an event sits on.
[image:44.596.73.528.372.622.2]
Figure 4.4.7: the first concept iteration
First concept evaluation
This concept version of the desktop was discussed with all stakeholders, to gather feedback. Stakeholders were positive over the cleanliness of the concept, as well as how easy the graphs read.
are not shown), and there was no way to investigate further details of each event. It was discussed that it would be clearer if there would be one event line for each corresponding graph, as well as if events could be inspected to get further detail. Even though there was already an idea on how the graph should look and behave when scrolling, this was not visible in the first concept iteration. It was decided that zooming the graphs with the mouse wheel would cause problems, as the page itself should also permit scrolling on smaller screens.
The current fill level in the top left turned out to be visually too heavy for the desired look. The minimum fill level slider next to it was determined to be illogical: in the first concept iteration, every setting has to be set in the settings, except the fill level. It was also found that the intensity of the shadows can vary greatly from monitor to monitor, even completely vanishing on some.
Second concept iteration
A lot of functionality was not accounted for in the first concept iteration. The second concept, as seen in Figure 4.4.8 till 4.4.11, implements some missing features such as a menu. This menu allows the user to navigate to a settings page, where the calculation constant of the volume of the SRB and the calculation constant of the size of the collection area can be adjusted (FR10, FR11). A display for comparing your SRB’s performance to an average of other SRB’s within a search radius was also added (FR16). This element is placed such that it is always seen by the user, assuming that the user always uses the precipitation, fill level, temperature and event graphs: when on computer, the element is shown to the left (as visible in 4.4.8), while on mobile devices it is placed above the four graphs, forcing the user to scroll past it. Next to that is a small display that tells the user how much water has been buffered collectively last rainshower (FR18). The graph got a way of showing missing data, by using a dashed line. Feedback from the previous iteration was also incorporated. To improve the event graph, each graph is represented in their own line. This means that all event types that belong to one graph will be put on the same line. Each event on the line is not only marked as a dot, but will be drawn out over the affected time period to form a line. Each event is also selectable. This will open a popup that gives more detailed information about the event (FR13).
The second concept is shown in a situation where the user has scrolled into the past. This way the concept can show how the “NOW” marker is displayed when ‘now’ is off-screen. To make sure the user is able to zoom the graphs (FR02) without losing the ability to scroll the web page on a small device, a zoom in and zoom out button were added.
touches to layout, design and shadows to further enhance the design, clarity and readability (NFR02).
[image:46.596.73.527.131.370.2]
Figure 4.4.8: the second concept iteration, without overlays
[image:46.596.73.523.391.638.2]
Figure 4.4.9: the second concept iteration, with desired reserve overlay
Figure 4.4.10: the second concept iteration, with information popup
Figure 4.4.11: the second concept iteration, with menu overlay
Second concept evaluation
precipitation.
It was requested that all data in the popup that is not a conclusion, is grouped above the divider. This means the confidence of a rain shower should appear above the line, rather than below it. It was asked that the comparison display element would allow for changing the time span, just like the distance. It was found though, that the distance would most probably hardly be used. For this reason it was suggested that the search radius is moved into the settings panel. It was also suggested that the element would more resemble the current fill level element rather than the four graphs. Since the comparison display element shows simplified/similar data to the collective water gain display, it was requested that the latter is removed.
The newly available space would then be used to display a larger buienradar widget. This would require a minor layout rearrangement. Lastly, some stakeholders noted that they would like the buienradar widget to be zoomed in more.
Third concept iteration
In the third concept iteration (Figure 4.4.12 till 4.4.15), all missing functionality from the main dashboard page has been accounted for, with the inclusion of a status overlay (FR07, FR08). It was decided that messages in the status overlay should be ordered by severity, rather than date of occurence. It was also decided that these messages should not be dismissable by the user, instead making the system get rid of them when it detects that the corresponding issue is resolved. During the development it was noted that the way of using shadows in the first two concepts gave a lot more darkness than desired for the light and open corporate design style. For this reason shadows were lightened and shrunk in the third concept iteration, together with a few other minor layout and design choices (NFR02).
The feedback of the second concept iteration was also incorporated: the names of all graphs and event graph lines are synchronised, fill events are shown on the fill level event graph, missing data is not represented in the temperature graph, and all incoming data in the popup is grouped above the divider while conclusions are displayed below.
comparative display was kept with a bar graph. To make it more readable, a display for each value, as well as the difference was added below. With the search radius prompt moved to the settings, the space above the graph was used for a time span prompt.
[image:49.596.73.528.149.371.2] [image:49.596.74.526.400.633.2]
Figure 4.4.12: the third concept iteration, without overlays
Figure 4.4.13: the third concept iteration, with information popup
Figure 4.4.14: the third concept iteration, with status overlay
Figure 4.4.15: the third concept iteration, with menu overlay
Third concept evaluation
“others in 5 Km” was suggested to be shortened to “Radius: 5 Km”. Lastly, stakeholders desired a bit more information from the comparison display element, specifically: a minimum and maximum on the “others in 5 Km” line, and a visualisation of the used amount of collected water.
Final Concept Iteration
Incorporating the feedback of the third concept iteration, a final concept was created. All suggested comparison display element label changes where incorporated, and the missing guidelines behind the comparison display bars were added. To display the additional desired information without cluttering the element, it was decided to display the desired information using the little arrow tick, as used for the desired fill level on the current fill level element. A new entry in the menu was added for “Help”, though its exact functionality is undecided at this point. The changes can be seen in Figure 4.4.16.
[image:51.596.72.529.305.535.2]
Figure 4.4.16: the final concept iteration, showing the improved comparison display
element.
Conclusion
Functional Nonfunctional
FR25: Graphs must have a way to inform the user about the exact value of a certain point
NFR06: When no data is available, no data must be shown
FR26: All time bound graphs must scroll and zoom together, keeping temporal unity
NFR07: Any information that can be displayed for multiple points in time, should span over the entire range
NFR08: Messages in the status overlay
must be ordered by severity, rather than date of occurence
NFR09: Status messages should not
[image:52.596.74.530.84.330.2]be dismissable by the user, but only by the system when it detects that the corresponding issue is resolved.
![Figure 2.1.1: prototype developed by Vetter[7]](https://thumb-us.123doks.com/thumbv2/123dok_us/9640664.466417/11.596.190.405.493.710/figure-prototype-developed-by-vetter.webp)
![Figure 2.1.2: functional engineering prototype dashboard developed by Vetter[7]](https://thumb-us.123doks.com/thumbv2/123dok_us/9640664.466417/12.596.91.508.190.459/figure-functional-engineering-prototype-dashboard-developed-vetter.webp)
![Figure 2.1.3: prototype developed by Steeghs and Rindt[6]](https://thumb-us.123doks.com/thumbv2/123dok_us/9640664.466417/13.596.89.507.442.673/figure-prototype-developed-by-steeghs-and-rindt.webp)
![Figure 2.1.5: dashboard for the SRB owner developed by Rindt[6]](https://thumb-us.123doks.com/thumbv2/123dok_us/9640664.466417/14.596.89.511.148.421/figure-dashboard-srb-owner-developed-rindt.webp)
![Figure 2.2.6: Fitbit bracelet and web dashboard[14]](https://thumb-us.123doks.com/thumbv2/123dok_us/9640664.466417/22.596.76.523.192.440/figure-fitbit-bracelet-and-web-dashboard.webp)
![Figure 4.1.1: The Interest vs Power Matrix using Mendelow’s method[50]](https://thumb-us.123doks.com/thumbv2/123dok_us/9640664.466417/38.596.74.507.86.352/figure-vs-power-matrix-using-mendelow-s-method.webp)
![Figure 4.4.6: the concept information website of the Regentoren project[55].](https://thumb-us.123doks.com/thumbv2/123dok_us/9640664.466417/43.596.76.529.230.459/figure-concept-information-website-regentoren-project.webp)