ISSN: 2252-8938, DOI: 10.11591/ijai.v8.i3.pp237-243 237
An efficient method to improve the clustering performance
using hybrid robust principal component analysis-spectral
biclustering in rainfall patterns identification
Shazlyn Milleana Shaharudin1, Shuhaida Ismail 2, Siti Mariana Che Mat Nor3, Norhaiza Ahmad4
1,3Department of Mathematics, Faculty of Science and Mathematics, Universiti Pendidikan Sultan Idris, Malaysia 2Department of Mathematics and Statistics, Faculty of Applied Sciences and Technology, Universiti Tun Hussein
Onn Malaysia, Malaysia
4Department of Mathematical Sciences, Faculty of Science, Universiti Teknologi Malaysia, Malaysia
Article Info ABSTRACT
Article history: Received May 12, 2019 Revised Jul 25, 2019 Accepted Aug 10, 2019
In this study, hybrid RPCA-spectral biclustering model is proposed in identifying the Peninsular Malaysia rainfall pattern. This model is a combination between Robust Principal Component Analysis (RPCA) and bi-clustering in order to overcome the skewness problem that existed in the Peninsular Malaysia rainfall data. The ability of Robust PCA is more resilient to outlier given that it assesses every observation and downweights the ones which deviate from the data center compared to classical PCA. Meanwhile, two way-clustering able to simultaneously cluster along two variables and exhibit a high correlation compared to one-way cluster analysis. The experimental results showed that the best cumulative percentage of variation in between 65%-70% for both Robust and classical PCA. Meanwhile, the number of clusters has improved from six disjointed cluster in Robust PCA-kMeans to eight disjointed cluster for the proposed model. Further analysis shows that the proposed model has smaller variation with the values of 0.0034 compared to 0.030 in Robust PCA-kMeans model. Evident from this analysis, it is proven that the proposed RPCA-spectral biclustering model is predominantly acclimatized to the identifying rainfall patterns in Peninsular Malaysia due to the small variation of the clustering result.
Keywords: Cluster analysis
Principal component analysis Robust principal component analysis
Spectral biclustering Tukey’s biweight correlation
Copyright © 2019 Institute of Advanced Engineering and Science. All rights reserved.
Corresponding Author: Shazlyn Milleana Shaharudin, Department of Mathematics, Faculty of Science and Mathematics, Universiti Pendidikan Sultan Idris, Malaysia. Email: [email protected]
1. INTRODUCTION
Rainfall patterns identification is key to categorize hydrologic events for climatologist or hydrologist to be able to streamline hydrologic convolution. Some of the most popular methods in identifying the rainfall patterns through data mining approaches are Principal Component Analysis (PCA) and cluster analysis. These approaches have been well-known for many years and applied in a wide range of research fields such as classification of weather types, climate regionalization and circulation patterns associated to climate extremes [1-3]. PCA reduces the dimension of the data matrix which is commonly employed as a pre-processing method for the benefit of guiding the classification process. A classical approach in PCA requires the use of configuration points of entities between the rows and columns of the data based on Pearson correlation matrix. In this instance, Pearson correlation matrix is often employed in the
derivation of T-mode correlation to evaluate the similarity occurrence between daily rainfalls [4-7]. A key characteristic of Pearson correlation is it gives equal weight to each pair of the observations.
In analyzing the features of rainfall pattern in Malaysia, the focal principal is that the daily rainfall is normally inherently skewed the right. This is reflected by how the data has high tendency to be skewed towards higher and only positive values. Consequently, affected observations are distinguished as outlying. Pearson correlation progressively reduces its advantages in significantly skewed distributions [8]. It would lower the discriminatory power due to the fact that outliers undoubtedly stick out in one observation, causing the information in an observation to be weakened [9]. Therefore, Pearson correlation might not be suitably applicable since the weight for each days are unequal, seeing how it is interconnected with the clustering result in highlighting the rainfall patterns. Cluster analysis has been developed to subdivide observations of similar patterns and dissimilar patterns accordingly into different clusters. Typically, classical clustering techniques in climate data apply the algorithms to either the rows or the columns within time or space domains of the data matrix separately [10-14]. In time-clustering techniques, segments of time are detected where the values of the time series are similar to each other [15]. Also, classical clustering technique typically divides the database of rainfall patterns into clusters with the assumption that every rainfall pattern belongs to only one specific cluster. This implies that the members of each cluster are exclusive and exhaustive to one and only one cluster. However, in practice, this is rarely true.
In this paper, two statistical strategies are presented based on data mining approaches to identify the torrential rainfall patterns in Peninsular Malaysia by considering the issues mentioned above. Robust PCA-based Tukey's biweight correlation is introduced. Alternatively, this is a new optional correlation measure to Pearson correlation matrix in PCA approach [16]. Tukey's biweight correlation is based on Tukey's biweight function that relies on M-estimators used in robust correlation estimates. This approach is more resilient to outlying values given that it assesses every observation and downweights the ones which deviate from the data center. This estimator is more efficient, flexible and fairly function under diverse data distributions [17]. So as to counter the issue in clustering technique, a series of two-way clustering methods known as spectral biclustering is introduced to simultaneously cluster along two variables. The aim of concurrent clustering is to find sub-matrices, which are subgroups of rows and subgroups of columns that show a high correlation.
2. RESEARCH METHOD
2.1. Data
The daily rainfall data from the interval of 1975 to 2007 was gathered from the Department of Irrigation and Drainage, Malaysia, or Jabatan Pengairan dan Saliran (JPS). The data were collected from 75 stations in different geographical coordinates on four regions in Peninsular Malaysia which are east, southwest, west and northwest. Primarily, this study’s main interest is extreme rainfall event which is known as the torrential rainfall. Hence, it was important to select some criteria to lead and establish a threshold to find a certain distinction between what does or does not constitute a day of torrential rainfall in the Peninsular Malaysia regions. The most common and applicable threshold in a tropical climate for this was 60 mm/day [18]. The filtered days with rainfall that exceeded 60 mm in at least 2% of the stations were used [19]. The outcome was 250 days and 15 rainfall stations - an ample figure to exemplify the main torrential centers.
2.2. Principal component analysis
In climate data, the typical torrential rainfall patterns are derived using principal component analysis (PCA) method based on T-mode approach. T-mode was used with the aim of analyzing spatial fields in different times. This is practical for extracting and reproducing the types of circulation, measuring their frequency and displaying the periods of dominant weather [20]. The main purpose of using PCA is to decrease the large dimensional data into low dimensional data while concurrently retaining the significance information of the data set [21]. In addition, this method is quite popular for finding patterns in high dimensional data [22]. The main part in PCA covers standard deviation, covariance or correlation and eigenvector. The algorithm of PCA approach works as follows:
𝑿 = (
𝑥11, 𝑥12, 𝑥13 ⋯ 𝑥1𝑗 𝑥21, 𝑥22
.. .
, 𝑥23 ⋱ 𝑥2𝑗
𝑥𝑖1, 𝑥𝑖2, 𝑥𝑖3 ⋯ 𝑥𝑖𝑗
) (1)
Given matrix 𝑿 is the rainfall data in Peninsular Malaysia comprises 𝐼 observations (i.e. rainfall days) described by 𝐽 variables (i.e. rainfall stations) and it is represented by the 𝐼 × 𝐽 matrix 𝐗, whose generic element is 𝑥𝑖,𝑗. Then, the spatial T-mode matrix is defined as
𝐗′= 𝐗′T𝐗 (2)
where the transpose operation is denoted by the superscript T.
Subsequently, the matrix can be defined through the correlation matrix
𝐶𝑡𝑡= 𝐶𝑜𝑟 (𝐗′) =
∑𝑛𝑖=1(𝐗′𝑖−𝐗̅𝑖′)(𝐗𝑗′−𝐗̅𝑗′) √∑𝑛𝑖=1(𝐗𝑖′−𝐗̅𝑖′)2∑𝑛𝑖=1(𝐗𝑗′−𝐗̅𝑗′)2
(3)
According to the (3), eigenvectors and eigenvalues are calculated using this expression. The followings are the steps involved in PCA algorithm:
Step 1: Acquire the input matrix.
Step 2: Compute T-mode based Pearson correlation matrix.
Step 3: Compute the eigenvectors and eigenvalues of the correlation matrix.
Step 4: Choose the most important principal components based on cumulative percentage of total variation. Step 5: Obtain the new data set
2.3. Robust Principal Component Analysis
Tukey's biweight correlation is based on Tukey's biweight function which depends on M-estimators applied in robust correlation estimates. M-estimate has a derivative function, 𝜓 which defines the weights allotted to the observations in the data set. It has the ability to downweight observations to emulate its influence from the centre of the data [17]. The derivative function is obtained as follows:
𝜓(𝑢) = {𝑢(1 − 𝑢)
2 |𝑢| ≤ 1
0 |𝑢| > 1 (4)
Evidently, if |𝑢|is large enough, then 𝜓(𝑢) reduces to zero. An important aspect to evaluate the resistance to outlying data values of M-estimators is its breakdown point. By definition, a breakdown point means the smallest fraction of contamination which may instigate inaccurate result [23]. In this study, Tukey's biweight with breakdown points of 0.2, 0.4, 0.6 and 0.8 were compared using simulated data and breakdown point of 0.4 performed the best. According to [24], a breakdown point of 0.4 generally performs better in most circumstances in which the result is more precise and effective when compared to a lower breakdown point. The biweight estimate of correlation is established by first determining the location estimate, T ̃ and further, updating the shape estimate, S ̃. The (𝑖, 𝑗)𝑡ℎ element of S ̃, i.e. 𝑠̃𝑖𝑗 serves as a resistant estimate of the covariance between the two vectors, 𝑋𝑖 and 𝑋𝑗. The calculation of biweight correlation of both vectors is:
𝑟̃𝑖𝑗 = 𝑠̃𝑖𝑗 √𝑠̃𝑖𝑖𝑠̃𝑗𝑗
(5)
With
𝑇𝑛(𝑘+1)=
∑ 𝑋𝑖𝑤(𝑢
𝑖(𝑘))
𝑛 𝑖=1
∑𝑛𝑖=1𝑤(𝑢𝑖(𝑘)) k = 0,1,2,… (6)
𝑆𝑛 (𝑘+1)
=∑ 𝑤(𝑢𝑖(𝑘))(𝑋𝑖−𝑇
(𝑘+1))(𝑋
𝑖−𝑇(𝑘+1))𝑡
𝑛 𝑖=1
∑ 𝑤(𝑢
𝑖(𝑘))(𝑢𝑖(𝑘)
𝑛
𝑖=1 )
(7)
where 𝑇𝑛 (𝑘+1)
is a location vector and 𝑆𝑛 (𝑘+1)
is a shape matrix such that 𝑘 = 0,1,2, ….
Thus, a PCA-based Tukey’s biweight correlation for K-means cluster analysis has the tendency to establish a better cluster partition which is more resilient towards the outlying values than Pearson correlation in PCA. 2.4. k-Means
The initial step was to randomly select k objects, where each initially represents a cluster mean or center. Next, the respective data point, 𝑒𝐿 is allotted to the nearest cluster centre. Euclidean distance method was commonly applied to calculate the distance, 𝑑( 𝑒𝐿, 𝑐) between each data points, 𝑒𝐿 and centroid, 𝑐𝐿 as shown in (7).
𝑑(𝑒, 𝑐) = √∑𝑛 ( 𝑒𝐿− 𝑐𝐿)2
When all the data points were assigned to each of the clusters, the cluster centroid was recalculated. k-Means clustering algorithm functions in the following steps:
Step 1: Randomly choose 𝑘 objects from the set of data as initial cluster centroid.
Step 2: Determine the distance between each data points 𝑑 and assign each item 𝑑 to the cluster which has the closest centroid. Recalculate the cluster centroid for each cluster until convergence criteria is reached.
2.5. Spectral Biclustering
The spectral biclustering algorithm was proposed as a method to identify subsets of features and conditions with checkerboard structure which can be described as a combination of constant biclusters in a single data matrix. In this study, the spectral biclustering was applied in order to obtain the rainfall patterns. This method has efficient performance, suitable for working with large matrices [25]. A set of matrix data, matrix A was represented along two variables dimension, M and N as (𝑎𝑖𝑗)𝑚𝑥𝑛. Matrix A then supposed to be bicluster into K and L submatrices. Then, let 𝑃(𝑘,𝑙) be the sub matrix and denoted with the average of all values of the submatrix as 𝜇(𝑘.𝑙). By using 𝜇(𝑘.𝑙), the variation of the matrix could be identified which defines the error. The goal of a biclustering is to find the partition with minimum error. The problem remains as how to choose the best value for K and L. For this part, a method proposed in [11] was referred which explained that the error decreased as K and L increased. As the spectral biclustering approach was applied to the data set, the value of K ∈ {25, 26, 27} and L ∈ {4}. The algorithm was applied randomly for 50 times to obtain the optimal values of (K,L). The followings are the steps required for the proposed algorithm:
Step 1: Acquire the input matrix.
Step 2: Standardize the data with median and mean absolute deviation (MAD), i.e.
𝑥𝑖𝑗∗ =
𝑥𝑖𝑗−𝑥̅
𝑚𝑒𝑑𝑖𝑎𝑛(|𝑥𝑖𝑗−𝑚𝑒𝑑𝑖𝑎𝑛(𝑥𝑖𝑗)|) (9)
such that 𝑥𝑖𝑗 refers to elements in the input matrix. Step 3: Arrange the data to obtain a T-mode decomposition. Step 4: Set the breakdown point, 0.4 for the Robust PCA.
Step 5: Compute the robust correlation measure, PCA-Tukey's biweight correlation matrix. Step 6: Compute the eigenvectors and eigenvalues of the Robust PCA.
Step 7: Choose the significance components based on cumulative percentage of total variation. Step 8: Compute the matrix of component loadings
Step 9: Apply spectral biclustering to matrix of component loadings.
3. RESULTS AND DISCUSSION
There are two main discussions in this section: the selections of cumulative percentage to remove the amount of principal components and the sensitivity of the amount of cluster to the choice of clustering approaches. The effect on clustering result when using hybrid Robust PCA against classical PCA approaches will also be shown. As noted from Table 1, the amount of components obtained from both approaches in PCA at respective level of cumulative percentage of variations differ. Apparently, robust PCA entailed less number of components to extract to achieve at least 70% of cumulative percentage of variation, contrary to PCA. To illustrate, at 80% cumulative percentage of variation, there were 28 components retained when using Robust PCA while as for Classical PCA, there were 35 components. Excessive inclusion of principal components overstated the significance of outlier, creating poor results in distinguishing rainfall patterns. These findings are in line with those in [26]. Meanwhile, irrespective of the cumulative percentage of variation, the number of clusters as an outcome of PCA combined with two clustering approaches stabilized at only two clusters. This is indicative of some influential observations in the data. In climatology studies especially in identifying rainfall patterns, obtaining more than two clusters to describe the variations of patterns of rainfall is more pertinent. This result was supported by [27] which denoted that some amount of clusters i.e. a couple of clusters would not be adequate to determine rainfall pattern whilst it comes to conducting considerable rainfall patterns analysis. Therefore, two cluster sets are evidently unfitting since they cover the actual construct of the data.
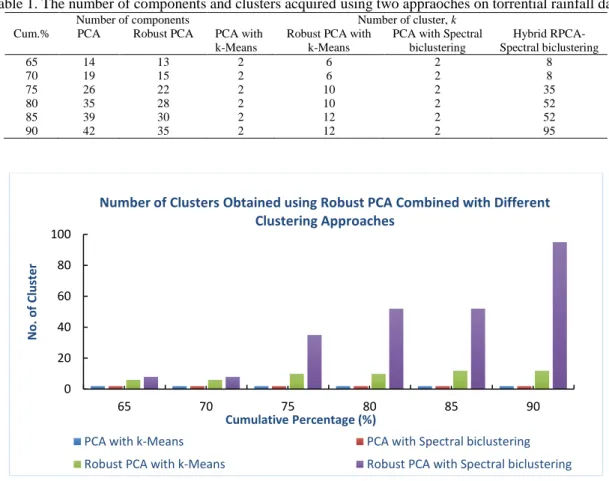
Figure 1 demonstrates the amount of clusters acquired by the means of Robust PCA combined with k-means cluster analysis and proposed model of Robust PCA combined with spectral biclustering. Evidently, relative to cluster partitions, Figure 1 displays how in comparison to PCA as shown in Table 1, Robust PCA has higher sensitivity to the sum of clusters employed, based on the cumulative percentage of variation. For an instance, in Figure 1, when the 70% cumulative percentage was selected, the total clusters to maintain
were six and eight for both approaches, respectively. When 5% additional cumulative percentage of variance was used, the sum of clusters deviated from six to ten for Robust PCA with k-Means approach while the number of cluster became 35 for hybrid RPCA-spectral biclustering. The most significant effects for Robust PCA were shown on the choice of clustering approach which was sensitive to the acquired number of cluster. However, the selection of cumulative percentage of variation above 70% for the purpose of identifying the rainfall pattern was a weak decision as a cut off for the number of principal components. In Figure 1, the resulting number of cluster for hybrid RPCA-spectral biclustering noticeably turns much bigger after retaining 70% cumulative percentage of variation. In identifying rainfall patterns, too much clusters indicated that the grouping could be disadvantageous from an impact outlook so as to describe the variation of rainfall patterns in Peninsular Malaysia [28]. In order to examine the cluster solutions, the variation between two cluster approaches were tested. As a result, the variability of the hybrid RPCA-spectral biclustering model was smaller which is 0.0034 compared to PCA coupled with k-Means cluster analysis which is 0.0300. Evidence form this was provided by [29] which indicated that higher variation in clustering represented more noise and weaker signal within discovered clustering approaches. Therefore, it showed that the proposed hybrid RPCA-spectral biclustering had a relatively better clustering result in terms of the variation when compared to PCA with k-Means approach. Conclusively, hybrid RPCA-spectral biclustering is proven to be an efficient robust method combined with a series of two-way clustering approach when dealing with hydrological data especially in rainfall data where there was a significant improvement in the cluster partition. This prevented the rainfall data from having erroneous unbalanced clusters.
Table 1. The number of components and clusters acquired using two appraoches on torrential rainfall data Cum.%
Number of components Number of cluster, k
PCA Robust PCA PCA with k-Means
Robust PCA with k-Means
PCA with Spectral biclustering Hybrid RPCA-Spectral biclustering 65 70 75 80 85 90 14 19 26 35 39 42 13 15 22 28 30 35 2 2 2 2 2 2 6 6 10 10 12 12 2 2 2 2 2 2 8 8 35 52 52 95
Figure 1. The number of clusters obtained using Robust PCA combined with different cluster analysis approaches.
4. CONCLUSION
The Robust PCA stood out as an engaging contender to the current classical PCA approach. Specifically, Robust PCA showed an extensive progress in the partition of clusters as compared to classical PCA. In climatology studies especially in identifying rainfall patterns, obtaining more than a pair of clusters to explain the variations of patterns of rainfall is more pertinent. In addition, it appeared that Robust PCA required fewer components to extract so as to achieve at least 70% of significance cumulative
0 20 40 60 80 100
65 70 75 80 85 90
N o . o f C lu ste r
Cumulative Percentage (%)
Number of Clusters Obtained using Robust PCA Combined with Different Clustering Approaches
PCA with k-Means PCA with Spectral biclustering
percentage in contract to Pearson. Too few components would affect the observations in a way that they were poorly embodied and would be clustered together because of low scores on every components. On the contrary, if more number of components to maintain or more cumulative percentage were used, there would be poor result in identifying rainfall patterns since it amplifies the significance of noise. Hence, the optimum cumulative percentage to identify rainfall patterns is between 65% until 70%. This study had shown that the proposed hybrid RPCA-spectral biclustering is particularly well adapted in identifying rainfall patterns in Peninsular Malaysia due to the small variation of the clustering result. Having mentioned this, it is renounced that all of the result is strictly allied to the cases based on rainfall data in Peninsular Malaysia where the weather and seasons differ from other zones.
ACKNOWLEDGEMENTS
The authors wish to express gratitude towards Universiti Pendidikan Sultan Idris for their support and financial funding via GPU grant Vote No. 2018-0154-101-01.
REFERENCES
[1] V. Moron, et al., “Weather Types Across the Maritime Continent: from the Diurnal Cycle to Interannual
Variations,” Frontiers in Environmental Science. 3(44), 2015.
[2] N. H. Ahmad, et al., “Hierarchical Cluster Approach for Regionalization of Peninsular Malaysia based on the
Precipitation Amount,” Journal of Physics: Conference Series. 423, pp. 1-10, 2013.
[3] G. S. Siva, et al., “Cluster Analysis Approach to Study the Rainfall Pattern in Visakhapatnam District,” Weekly Science Research Journal. 1(31), 2014.
[4] R. Romero, et al., “Daily Rainfall Patterns in the Spanish Mediterranean Area: An Objective Classification,” International Journal of Climatology.19, pp. 95-112, 1999.
[5] D. Penarrocha, “Classification of Daily Rainfall Patterns in a Mediterranean Area with Extreme Intensity Levels: The Valencia Region,” Internation Journal of Climatology.22, pp. 677-695, 2002.
[6] G. Sumner, et al., “The Impact of Surface Circulations on the Daily Rainfall over Mallorca,” International Journal of Climatology.15, pp. 673–696, 1995.
[7] P. Wickramagamage, “Seasonality and spatial pattern of rainfall of Sri Lanka: Exploratory factor analysis,”
International Journal of Climatology. 30, pp. 1235-1245, 2010.
[8] N. S. Chok, “Pearson’s Versus Sperman’s and Kendall’s Correlation Coefficients for Continuous Data”, 2008. [9] Doreswamy and C. M. Vastrad, “Identification of Outliers in Oxazolines and Oxazoles High Dimension Molecular
Descriptor Dataset using Principal Component Outlier Detection Algorithm and Comparative Numerical Study of Other Robust Estimators,” International Journal of Data Mining and Knowledge Management Process. 3(4), pp. 75-93, 2013.
[10] M. G. Sefidmazgi, et al., “Trend analysis using non-stationary time series clustering based on the finite element
method,” Nonlinear Processes in Geophysics, vol. 21, no. 3, pp. 605–615, 2014.
[11] H. Wan, et al., “Attributing northern high-latitude precipitation change over the period 1966–2005 to human
influence,” Climate Dynamics, vol. 45, no. 7, pp. 1713–1726, 2015.
[12] A. M. Rad and D. Khalil, “Appropriateness of Clustered Raingauge Stations for Spatio-Temporal Meteorological Drought Applications,” Water Resources Management, vol. 29, no. 11, pp. 4157–4171, 2015.
[13] Y. Zhang, et al., “Optimal Cluster Analysis for Objective Regionalization of Seasonal Precipitation in Regions of
High Spatial–Temporal Variability: Application to Western Ethiopia,” Journal of Climate, vol. 29, no. 10, pp. 3697–3717, 2016.
[14] X. Huang, et al., “Analysis of dynamic trend-based clustering on Central Germany precipitation,” in Fifth International Workshop on Climate Informatics, (Boulder), 2015.
[15] M. G. Sefidmazgi and C.T. Marrison, “Spatiotemporal Analysis of seasonal Precipitation over US using Co-clustering,” in 6th International Workshop on Climate Informatics, 2016. Proceedings of the 6th International
Workshop on Climate Informatics, pp. 41-44, 2016.
[16] S. M. Shaharudin, et al., “Identification of Rainfall Patterns on Hydrological Simulation using Robust Principal
Component Analysis,” Indonesian Journal of Electrical Engineering and Computer Science (IJEECS),” vol. 11,
no. 3, pp. 1162-1167, September 2018.
[17] J. Hardin, et al., “A Robust Measure of Correlation between Two Genes on a Microarray,” BMC Bioinformatics, 8(220), 2007.
[18] S. M. Shaharudin, et al., “Modified Singular Spectrum Analysis in Identifying Rainfall Trend over Peninsular
Malaysia,” Indonesian Journal of Electrical Engineering and Computer Science (IJEECS),” vol. 15, no. 1, pp. 283-293, July 2019.
[19] R. Romero, et al., “A Classification of the Atmospheric Circulation Patterns Producing Significant Daily Rainfall
in the Spanish Mediterranean Area”, Int. J. Climatol. 19, pp. 765-785, 1999.
[20] R. H. Compagnucci, et al., “Principal Sequence Pattern Analysis: A New Approach to Classifying the Evolution of
[21] S. M. Shaharudin, et al., “The Comparison of T-mode and Pearson Correlation Matrices in Classification of Daily
Rainfall Patterns in Peninsular Malaysia,” Matematika, pp. 187-194, 2013.
[22] J. Meng, and Y. Yang, “Symmetrical Two-Dimensional PCA with Image Measures in Face Recognition,” Int J Adv Robotic Sy. 9, 2012.
[23] P. Rousseeuw, and A. Leroy, “Robust Regression and Outlier Detection. New York, USA: John Wiley and Sons, Inc. 1987.
[24] M. Owen, “Tukey's Biweight Correlation and the Breakdown Thesis,” Pomona College. 2010.
[25] M. G. Sefidmazg and C. T. Morrison, “Spatiotemporal Analysis of Seasonal Precipitation over US using Co-clustering,” 6th International Workshop on Climate Informatics, pp 41-44. 2016.
[26] G. M. Mimmack, et al., “Choice of Distance Matrices in Cluster Analysis: Defining Regions,” Journal of Climate. 14, pp. 2790-2797, 2002.
[27] W.C. Chang, “On using principal components before separating a mixture of two multivariate normal populations,”
J. Appl. Stat. 32, pp. 267–275, 1983.
[28] I. Mahlstein and R. Knutti, “Regional climate change patterns identified by cluster analysis,” Clim. Dyn., vol. 35, pp. 587-600, 2010.
[29] A. Kasim, et al., Applied Biclustering Methods for Big and High-Dimensional Data Using R, Taylor & Francis Group, 2017, p. 89.
BIOGRAPHIES OF AUTHORS
Shazlyn Milleana was born in Johor Bahru, Malaysia, in 1988. She is a senior lecturer at the Department of Mathematics, Faculty of Science and Mathematics, Universiti Pendidikan Sultan Idris (UPSI). She graduated with a bachelor science degree in Industrial Mathematics from Universiti Teknologi Malaysia, in 2010. Upon graduation, she began her career as an Executive in banking institution. In the following year, she received an offer to continue her study as a fast-track PhD student at the same university. During her PhD journey, she developed an interest in multivariate analysis, specifically in finding patterns which deals with big data. Her research focuses on the area of dimension reduction methods specifically in climate informatics which involves analysis on huge climate-related datasets based on techniques in Data Mining. She had published her research in Scopus indexed journal and presented her work in various local and international conferences. She completed her PhD thesis at the end of 2016 and was conferred a doctorate degree in 2017.
Shuhaida Ismail is a lecturer at the Department of Mathematics and Staticstics, Faculty of Applied Sciences and Technology, Universiti Tun Hussein Onn Malaysia (UTHM). She obtained her first degree in Computer Sciences majoring from UTM. She also obtained a Master degree and PhD from the same university. Throughout her studies, she developed an interest in Machine Learning research area, specifically in predictive modelling, classification, and clustering. Her current research areas are in hydrological modelling, big data analytics and deep learning.
Siti Mariana is a graduate of Bachelor Degree in Education (Mathematics) from Universiti Pendidikan Sultan Idris (UPSI) in 2018. She is currently pursuing her studies in Masters of Science degree in Statistics while working on to publish papers in her scope of field. Her research focuses on the area of dimension reduction methods, specifically in climate informatics which involves analysis on huge climate-related datasets based on techniques in Data Mining.
Norhaiza is a senior lecturer at the Department of Mathematical Sciences, Faculty of Science, Universiti Teknologi Malaysia (UTM). She graduated with an honors degree in Mathematics, Statistics and Operational research from the University of Manchester, in 1996. She joined UTM in August 2000. In the following year, she continued her studies at the University of Sheffield for her master’s degree. In Sheffield, she developed an interest in multivariate analysis, specifically in finding patterns which lead her to pursue a PhD degree at the University of Kent. She completed her PhD thesis at the end of 2007 and was conferred a doctorate degree in 2008. Finding patterns in any data have always been her research interests. She started the interests in profiling data – finding statistically distinctive and significant groups and features in the object of interest whilst at Sheffield. Currently, her research interests revolve around hydroinformatics particularly in investigating the streamflow variability of the local rivers.