Cell Formation Heuristic Procedure Considering Production Data
Shailendra Kumari,* and Dr Rajiv Kumar Sharmaii
Mechanical Engineering Department, National Institute of Technology, Hamirpur, Himachal Pradesh, India-177005.
i [email protected] ii [email protected]
Abstract: Manufacturing cell formation is one of foremost, and critical aspect of any manufacturing cell design problem. A large number of cell formation methods are developed and research in this area is still in progress. In this paper an attempt has been made by authors to develop a simple, easy to understand and implement cell formation heuristic, having the capability to handle production data viz. operation sequence, production volume, and inter-cell movement cost simultaneously. The results obtained from proposed method are in tune with some highly complex methods, which validates the performance of proposed procedure. To demonstrate its ability to handle other production parameters with little modifications, a modification for consideration to part processing cost in addition to above mentioned production data is developed and explained. Towards the end the procedure to handle alternate process plans in conjugation with production data by the proposed cell formation procedure is also discussed.
Key words: Alternate process plan, cell formation heuristic, inter-cell movement cost, operation sequence, part processing cost, production volume.
1. Introduction
The present era, of increasing global competition, complexity, and high levels of customisation, turn the attention of the industry leaders to critical issues of productivity, quality, efficiency, and manufacturing cost. Cell design is critical to any cellular manufacturing problem. Cell formation (CF) is the first step of cell design. CF is to form the machine cells for the families of parts needed similar manufacturing requirements (Sarker, 1996, Boutsinas, 2013, and Mukattash et al., 2002). Identification of machine cells is most important and basic need in the design of a cellular manufacturing system (Mukattash et al., 2002, Seifoddini, 1998, Venugopal and Narendran, 1994). The purpose of any cell formation technique is to form a set of mutually independent set of machines each capable of fully processing the part families assigned to it (Venugopal and Narendran, 1994). It makes CF a complex and tedious task. The CF techniques developed so far can be categorized into number of categories (Boutsinas, 2013, Yin and Yasuda, 2006, Papaioannou and Wilson, 2010, and Yasuda
et al., 2005) (i) similarity coefficient based methods,
realistic and effective, butrarely any such similarity coefficient based simple CF technique has been developed so far. The literature reflects the need of efforts to incorporate production and manufacturing flexibility related data (realistic data) in CF procedures in a simple manner. Thus, to abridge this gap, authors in present study developed similarity coefficient / commonality score based simple cell formation heuristic, which possess the capability to handle the production data i.e. operation sequence, production volume, and inter-cell movement cost simultaneously. To demonstrate its ability to handle other production parameters with little modifications, a modification for consideration to part processing cost in addition to above mentioned production data is developed and explained. Towards the end the procedure to handle alternate process plans in conjuction with production data by the proposed cell formation procedure is also discussed.
The outline of the paper is as follows: Section 2 describes development of a commonality score based manufacturing CF procedure. Detailed procedure is explained in section 2.1. A CF problem with production data is solved with proposed CF procedure in section 2.2, followed by comparison of results in section 3. Further, the proposed approach is modified to consider part processing cost along with other production data viz. operation sequence, production volume, and inter-cell movement cost in Section 4. For better understanding of procedure again, one more CF problem is solved in section 4.1. A discussion on the procedure to handle alternate process plans along with above production data is
given in section 5. At last the conclusions from the study are drawn and scope for future work is given in Section 6.
2. Development of CF procedure
An exceptional element indicates that part needs to be processed on a machine located outside the manufacturing cell, hence adding towards the inter-cell movement, which in-turn adds to inter-inter-cell movement cost. Total inter-cell movement cost will depend on production volume, per part per move inter cell movement cost, and number of inter-cell moves generated due to exceptional element(s). From a little observation of operation sequence we can infer that a machine could add maximum one inter-cell move per part if it is either at starting or at ending position of the operation sequence of a particular part, otherwise it could add maximum two inter-cell moves (Won and Lee, 1991). Further, while clustering, if two or more machines lie outside the manufacturing cell and they are in consecutive order in operation sequence of a particular part, in this case total inter-cell moves generated by them will be much lesser than the simple sum, for all such cases. It must be taken into consideration while estimating required inter-cell moves or cost accordingly. Though all similarity coefficients are intuition based and there is no strict reasoning why one of them is better than others (Krushinsky and Goldengorin, 2012). Jaccard similarity coefficient is found the efficient and most stable one among the twentyTable 1. Summary of work observed on cell formation with consideration to flexibility and production data Author & Year Data considered
Lian et al., 2013 Multiple identical machines, processing time, set-up time, machine capacity, production volume, cell size, alternative routes
Gupta et al., 2012 Operation sequence
Ahi et al., 2009 Operational time, operation sequence Pandian and Mahapatra, 2009 Operation sequence, operation time Paydar and Sahebjamnia, 2009 Operation sequence
Susanto et al. 2009 Sequence of operations, part-Volume, alternative routes Kumar and Jain, 2008 Operation sequence, time, production volume
Masmoudi et al. 2008 Alternative routes
Kim et al., 2004 Machine sequence, alternative routes Mahesh and Srinivasan, 2002 Processing time, alternative routes
Mukattash et al., 2002 Multiple parallel machines, processing time, alternative routes Won and Lee, 2001 Operation sequence, production volume
Nair and Narendran, 1998 Operation sequence
Beaulieu et al., 1997 Intra-cell movement cost, material handling cost, machine cost (alternate machines), alternative routes
compared in a comparative study of similarity coefficients made by Yin and Yasuda (2005). For efficiency and stability of proposed CF procedure a variant of Jaccard similarity coefficient is used. Chow and Hawaleshka (1992), claimed that the common source of machine chaining problem seems to be in the implementation of each step of grouping procedure in a disjoint manner. To avoid chaining in the proposed CF procedure, the input from a grouping step is used in next grouping step similar to Chow and Hawaleshka (1992).
2.1. Proposed CF procedure
Number of minimum exceptional elements does not guarantee the minimum inter-cell moves / movement cost. The prime motive of any CF procedure is to minimize the number of inter-cell moves / inter-cell movement cost (Sivraj and Sharma, 2012, and Arkat
et al., 2012) This is also the basis of proposed CF procedure. The steps of proposed CF procedure is
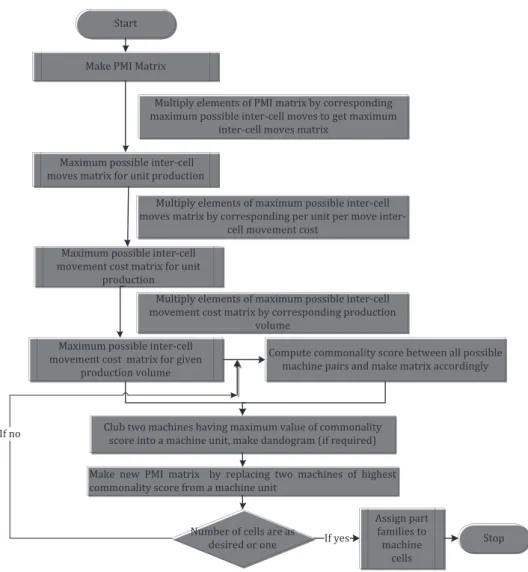
explained by a flow chart in Figure 1 and elaborated below:
Step 1: It is dedicated to convert the pertaining data into maximum possible inter-cell movement cost matrix. The elements of this matrix could be obtained as product of ‘production volume of part’, ‘sum of maximum possible moves could be generated by concerned machine for a concerned part’, and ‘per unit per move inter-cell movement cost’. The procedure of conversion is explained in four sub steps from ‘1a’ to ‘1d’ detailed below. Any step out of ‘step 1b’, ‘step 1c’, and ‘step 1d’ may be skipped if concerned parameter is not considered.
- Step 1a. Make PMI matrix of size m x n, for ‘m’ parts and ‘n’ machines under consideration - Step 1b. Convert it into a matrix indicating
maximum possible inter-cell moves for unit production of each part, by considering their respective operation sequence. By using the logic
that a machine could add maximum one inter-cell move per part if it is either at starting or at ending position of the operation sequence of a particular part, otherwise it could add maximum two inter-cell moves(Won and Lee, 1991).
- Step 1c. Convert this maximum possible inter-cell moves matrix into a matrix containing maximum possible inter-cell movement cost for unit production of each part, by multiplying each element by their respective per part per move inter-cell movement cost.
Thus obtained matrix may be referred as the maximum possible inter-cell movement cost matrix for single unit production volume.
- Step 1d. To consider production volume, multiply each element of this matrix by respective production volume. After multiplication with respective production volume this matrix is converted to the maximum possible inter-cell movement cost matrix for given production volume.
This resultant matrix is deduced from the information about operation sequence, production volume, and inter-cell movement cost in addition to the machine(s) required for processing of a particular part.
Step 2: Compute the similarity coefficient among all possible machine pairs from the matrix obtained from ‘step 1’ by using a variant of Jaccard similarity coefficient. The proposed variant of Jaccard similarity coefficient used here is represented by Eq. 1.
Commonality score = a / (a+b+c) (1)
Where, a → sum of elements common to both machines in concerned machine pair (in this case, maximum possible inter-cell movement cost for parts visiting both machines)
a=
/
kk n==1a^ hijk, a(ij)k → elements common to bothmachines Mi and Mj, for k = 1 to k = n parts
b → sum of values of elements concerned to only first machine in pair (in this case, maximum possible inter-cell movement cost for parts visiting only first machine)
b=
/
kk n==1b^ hi k, b(i)k → elements concerned tomachine Mi but not machine Mj, for k = 1 to k = n parts
c → sum of values of elements concerned to only second machine in pair (in other terms, maximum possible inter-cell movement cost parts visiting only second machine)
c=
/
kk n==1c^ hjk,c(j)k → elements concerned to machineMj but not machine Mi, for k = 1 to k = n parts Step 3: Group machine pair having highest value of commonality score, and transform this machine pair into a machine unit Mr having elements M(i,j)r
, ,
a if a a a if a a
Mi j,
i r i r j r
j r r j r r
i <
= $
^ ^ ^ ^
^ ^ ^
h h h h
h h h
*
Where, M(i, j)r → corresponding elements of machine
unit Mr, obtained after transformation of machine Mi
and machine Mj into a single machine unit
ai(r) & aj(r) → corresponding elements of machine Mi
and Mj respectively.
Step 4: Formulate the tree/ dandogram accordingly (optional)
Step 5: Replace machine Mi and Mj with machine
unit Mr in the incidence matrix
Step 6: Stop and assign parts to machine cells so as to maximise the work load inside these cells, if the number of machine cells in the new incidence matrix is either only one or desired number of machine cells or , otherwise proceed to step 2.
2.2. Numerical example solved by proposed CF procedure
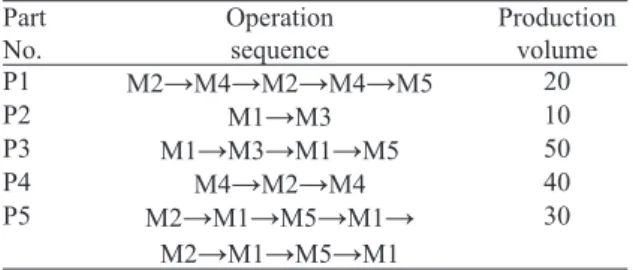
In this section for a good understanding of proposed procedure, the procedure is implemented on the problem of five machines and five parts adapted from Won and Lee (1991), and given in Table 2. ‘P1’, ‘P2’, ‘P3’, ‘P4’, ‘P5’, indicates from part number 1, to part number 5 whereas ‘M1’, ‘M2’, ‘M3’, ‘M4’, ‘M5’ indicates from machine number 1 to machine number 5 respectively in order.
Table 2. Initial data for cell formation problem. Part
No. Operation sequence Production volume
P1 M2→M4→M2→M4→M5 20
P2 M1→M3 10
P3 M1→M3→M1→M5 50
P4 M4→M2→M4 40
P5 M2→M1→M5→M1→
M2→M1→M5→M1
30
Step 1:
- Step 1a: Deduce PMI matrix from the data of problem presented by Table 2.
machine to generate maximum possible inter-cell moves, by taking care of their respective operation sequence. The resulting matrix is shown in Table 3.
Table 3. Maximum possible inter-cell moves matrix for unit production of each part.
P1 P2 P3 P4 P5
M1 0 1 3 0 7
M2 3 0 0 2 3
M3 0 1 2 0 0
M4 4 0 0 2 0
M5 1 0 1 0 4
- Step 1c: Inter-cell movement cost is not considered, this step may be skipped.
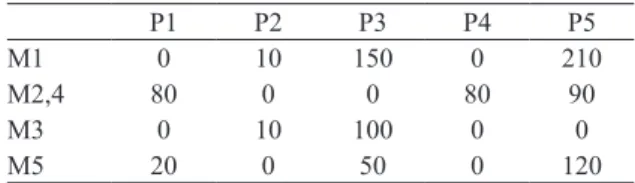
- Step 1d: Deduce matrix in Table 3 into the matrix indicating total maximum possible inter-cell moves for given production volume. For this conversion multiply each element of Table 3 by their respective production volume. For example entry corresponding to machine ‘M1’ and part ‘P3’ is calculated as 50(3) = 150 i.e. product of ‘production volume of part’ and ‘sum of maximum possible moves could be generated by concerned machine’. Matrix developed by this process is tabulated in Table 4.
Table 4. Matrix for maximum possible inter-cell moves for given production volume.
P1 P2 P3 P4 P5
M1 0 10 150 0 210
M2 60 0 0 80 90
M3 0 10 100 0 0
M4 80 0 0 80 0
M5 20 0 50 0 120
Step 2: Construct the commonality score matrix on the basis of data available in the resultant matrix from step 1. The similarity coefficient matrix is represented in Table 5.
Table 5. Commonality score matrix based on data in
Table4.
M1 M2 M3 M4 M5
M1 1 {90/(280+140+90}
= 0.176 0.297 0 0.436
M2 1 0 0.56 0.355
M3 1 0 0.2
M4 1 0.061
M5 1
Step 3: Machines ‘M2’ and ‘M4’ have the highest value of Commonality score, therefore they must be clubbed to form a machine unit.
Step 4: It is simply the construction of dendogram or tree. The step may be skipped.
Step 5: A new data matrix by clubbing machine ‘M2’ and ‘M4’ in a single machine unit is developed and represented in Table 6.
Table 6. New data matrix considering machine 2 and
machine 4 as a single machine unit.
P1 P2 P3 P4 P5
M1 0 10 150 0 210
M2,4 80 0 0 80 90
M3 0 10 100 0 0
M5 20 0 50 0 120
At this stage (Table 6) the number of machine cells are neither optimum nor one, hence, proceed to step 2.
Final clustered maximum possible movement based machine part incidence matrix is represented in Table 7 and machine cells are encircled by bold lines.
Table 7. Final clustered maximum possible movement
based machine part incidence matrix.
P3 P5 P2 P1 P4
M1 150 210 10 0 0
M5 50 120 0 20 0
M3 100 0 10 0 0
M4 0 0 0 80 80
M2 0 90 0 60 80
After clustering machines as per the scheme tabulated in Table 7, we can find the maximum number of possible inter-cell moves is 110 (i.e. 90+20). Machine ‘M5’ is only at the end of operation sequence of part ‘P1’, in this case maximum possible inter-cell moves are same as total inter-cell moves required. Machine ‘M2’ is neither at the start nor at the end of operation sequence of part ‘P5’, and machine ‘M5’ is used only once in the operation sequence of part ‘P5’, in this case also maximum possible inter-cell moves are same as total inter-cell moves required. Hence, total inter-cell moves required for given production volume will be 110. This is also an optimum solution and in the tune of Won and Lee (1991).
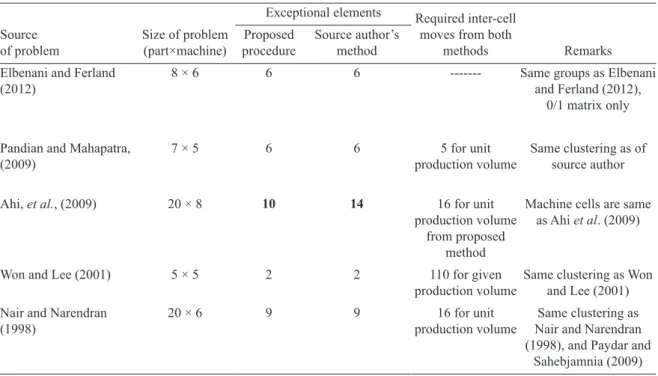
3. Comparison of results
4. Proposed CF procedure with
consideration to part processing cost
The proposed procedure is corrected for consideration to part processing cost along with operation sequence, production volume, and inter-cell material handling cost by a little modifications in deduction of cost matrix for computation of commonality score. The desired modification is limited only to step 1 of proposed procedure, and all other steps remain same. Theprocedural step of deduction of cost matrix (step 1) is explained with the help of a flow chart in Figure 2.
4.1. Numerical example with modified CF procedure
For illustration part processing, and inter-cell movement costs are introduced arbitratrly to problem adopted from Won and Lee (1991), discussed in section 2.2. The revised problem is given in Table 9. Part processing cost per operation is 10, 40, 30,
Table 8. Comparison of results.
Source
of problem Size of problem (part×machine)
Exceptional elements Required inter-cell moves from both
methods Remarks
Proposed
procedure Source author’s method Elbenani and Ferland
(2012) 8 × 6 6 6 --- Same groups as Elbenani and Ferland (2012),
0/1 matrix only
Pandian and Mahapatra,
(2009) 7 × 5 6 6 production volume5 for unit Same clustering as of source author
Ahi, et al., (2009) 20 × 8 10 14 16 for unit
production volume from proposed
method
Machine cells are same as Ahi et al. (2009)
Won and Lee (2001) 5 × 5 2 2 110 for given
production volume Same clustering as Won and Lee (2001) Nair and Narendran
(1998) 20 × 6 9 9 production volume16 for unit Nair and Narendran Same clustering as (1998), and Paydar and
Sahebjamnia (2009)
Make PMI matrix
Production volume based PMI matrix
Multiply each element of PMI with production volume of corresponding part
Matrix for processing cost for given production volume
Multiply corresponding entries by per part processing cost on related machines
Matrix for maximum possible inter-‐cell moves for given production volume
Consider operation sequence
Maximum possible inter-‐cell movement cost matrix Multiply by inter-‐cell movement cost per part
Total production cost matrix Add the corresponding elements of both matrix
25, 20 units on machine ‘M1’, ‘M2’, ‘M3’, ‘M4’, ‘M5’ respectively. In this illustration part processing cost is same for all parts processed on a particular machine but this cost may be different for different part for a particular machine. Matrix obtained at various stages of proposed procedure are given from Table 10 to Table 14.
After completing the procedure the final clustered matrix is obtained as detailed in Table 14. From final clustered matrix the followings inferences can be deduced: Exceptional elements = 2, Required Inter-cell moves = 110, Required inter-Inter-cell movement cost = 310 unit, Processing cost for parts processed outside manufacturing cells = 1490 units, and Total production cost of exceptional elements for entire lot =1910 units.
5. Handling of multiple process
plans along with production data
by proposed CF procedure
In the case, when multiple process plans are to be considered along with operation sequence, production volume, inter-cell material handling cost, and part processing cost. The CF procedure will remain similar as explained above, the only difference is first consider all process plans as process plans for different parts, form manufacturing cells by considering all process plans in the line of Mukattash et al. (2002). After cell formation, accept only one process plan for each part, which needs minimum inter-cell movement cost / processing cost for part outside manufacturing cell, and reject all other process plans for that part.
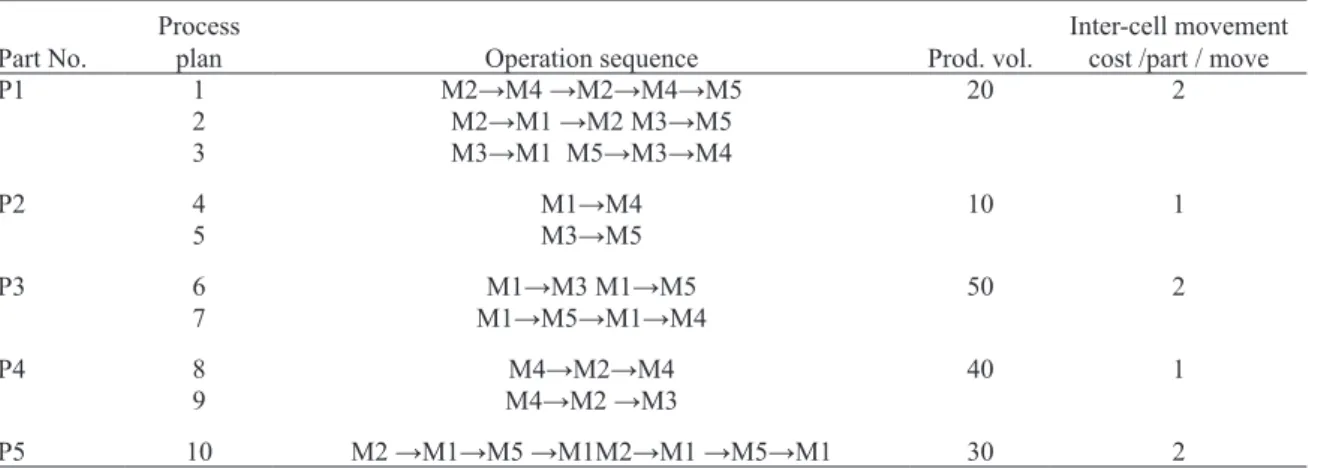
5.1. Numerical example solved by proposed modified CF procedure
For considerations of alternate process plans, the same are added to the above discussed numerical problem arbitrarily, rest of other data remains same, as detailed in Table 15. It becomes a 5 machines, 5 parts, and 10 process plan problem. Final clustered matrix obtained from proposed CF
Table 10. Matrix for processing cost for given production volume.
P1 P2 P3 P4 P5
M1 0 100 500 0 300
M2 800 0 0 1600 1200
M3 0 300 1500 0 0
M4 500 0 0 1000 0
M5 400 0 1000 0 600
Table 11. Maximum possible inter-cell movement cost
matrix.
P1 P2 P3 P4 P5
M1 0 10 300 0 630
M2 120 0 0 80 270
M3 0 10 200 0 0
M4 160 0 0 120 0
M5 40 0 100 0 360
Table 12. Combined (total production) cost matrix.
P1 P2 P3 P4 P5
M1 0 110 800 0 930
M2 920 0 0 1680 1470
M3 0 310 1700 0 0
M4 660 0 0 1120 0
M5 440 0 1100 0 960
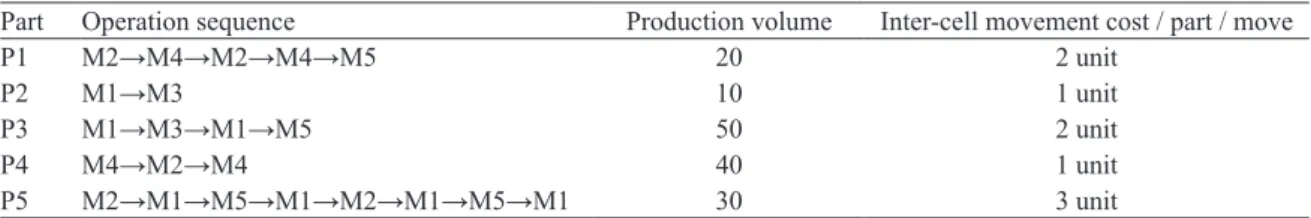
Table 9. Modified data for cell formation problem.
Part Operation sequence Production volume Inter-cell movement cost / part / move
P1 M2→M4→M2→M4→M5 20 2 unit
P2 M1→M3 10 1 unit
P3 M1→M3→M1→M5 50 2 unit
P4 M4→M2→M4 40 1 unit
P5 M2→M1→M5→M1→M2→M1→M5→M1 30 3 unit
Table 14. Final clustered combined cost matrix.
Part P3 P5 P2 P1 P1
M1 800 930 110 0 0
M3 1700 0 310 0 0
M5 1100 960 0 0 440
M2 0 1470 0 1680 920
M4 0 0 0 1120 680
Table 13. Commonality score matrix (first iteration).
M1 M2 M3 M4 M5
M1 1 0.187 0.31 0 0.663
M2 1 0 0.437 0.271
M3 1 0 0.323
M4 1 0.115
References
Ahi, A., Aryanezhad, M.B., Ashtiani, B., Makui, A. (2009). A novel approach to determine cell formation, intracellular machine layout and cell layout in the CMS problem based on TOPSIS method. Computers & Operations Research, 36(5): 1478-1496. http://dx.doi. org/10.1016/j.cor.2008.02.012
Arkat, J., Farahani, M.H., Hosseini, L. (2012). Integrating cell formation with cellular layout and operations scheduling. Int. J. Adv. Manuf. Tech., 61: 637-647. http://dx.doi.org/10.1007/s00170-011-3733-4
Beaulieu, A., Ait-Kadi, D., Gharbi, A. (1993). Heuristic for flexible machine selection problems. Journal of Decision Systems, 2: 241-253. doi:10.1080/12460125.1993.10511583
procedure is given in Table 16. Results deduced from final clustered matrix are as follows: Exceptional Elements = 2, Required total Inter-cell moves = 110, required inter-Inter-cell movement cost = 220 unit, processing cost for parts processed outside manufacturing cells = 1600 units, and total production cost of exceptional elements for entire production = 1820 units. A little consideration of results obtained without alternate process plans (Table 14), and with alternate process plans (Table 16), it is clear that procedure selects the process plan which ultimately reduces the total production cost.
Table 16. Final clustered combined cost matrix with
alternate process plan.
Part P1 P2 P3 P4 P5
Process
plan 6 10 5 1 8
M1 800 720 0 0 0
M5 1100 840 210 440 0
M3 1800 0 310 0 0
M4 0 0 0 660 1080
M2 0 1380 0 920 1680
6. Conclusion
The proposed CF heuristic procedure is simple, easy to understand, and implement. It has the ability to use the production data such as production volume, operation sequence, and inter-cell movement cost simultaneously. It produces the results which commensurate with some highly advanced and complex cell formation methods requiring very high computational power. The modifications for part processing cost, and alternate process plans demonstrates its ability to handle other production parameters too. The proposed procedure could also be implemented if part processing, and inter-cell movement costs are replaced by part processing, and inter-cell movement time respectively. The procedures would be highly beneficial for a low to mid-size flexible manufacturing system.
Future work may be carried out in the development of more realistic and efficient formulations with considerations to more realistic parameters such as setup cost, machine capacity, multiple identical machines, decisions on number of manufacturing cells & size, reliability, work imbalance, and various manufacturing flexibility related parameters, etc for large-size CF problems.
Table 15. Data for cell formation problem.
Part No. Process plan Operation sequence Prod. vol. Inter-cell movement cost /part / move
P1 1 M2→M4 →M2→M4→M5 20 2
2 M2→M1 →M2 M3→M5
3 M3→M1 M5→M3→M4
P2 4 M1→M4 10 1
5 M3→M5
P3 6 M1→M3 M1→M5 50 2
7 M1→M5→M1→M4
P4 8 M4→M2→M4 40 1
9 M4→M2 →M3
Beaulieu, A. Gharbi, A., Ait-Kadi. (1997). An algorithm for the cell formation and the machine selection problems in the design of a cellular manufacturing system. International Journal of Production Research, 35(7): 1857-1874. doi:10.1080/002075497194958
Boutsinas, B. (2013). Machine-part cell formation using biclustering. European Journal of Operational Research, 230(3): 563-572. http:// dx.doi.org/10.1016/j.ejor.2013.05.007
Chow, W.S., Hawaleshka, O. (1992). An efficient algorithm for solving the machine chaining problem in cellular manufacturing. Computers and Industrial Engineering., 22(1): 95-100. http://dx.doi.org/10.1016/0360-8352(92)90036-J
Chu, C.H., Tsai, M. (1990). A comparison of three array-based clustering techniques for manufacturing cell formation. International Journal of Production Research, 28(8): 1417-1433. http://dx.doi.org/10.1080/00207549008942802
Elbenani, B., Ferland, J.A. (2012). Cell formation problem solved exactly with the dinkelbach algorithm. https://www.cirrelt.ca/ DocumentsTravail/CIRRELT-2012-07.pdf Accessed on 25.11.2013.
Gupta, A., Jain, P.K., Kumar, D. (2012). Formation of part family in reconfigurable manufacturing system using principle component analysis and K-means algorithm. In: Annals of DAAAM for 2012 & Proceedings of the 23rd International DAAAM Symposium, Volume 23, No.1, Ed. B. Katalinic, Published by DAAAM International, Vienna, Austria.
Jayakrishnan Nair, G.J., Narendran, T.T. (1998). CASE: A algorithm for cell formation with sequence data. International Journal of Production Research, 36(1): 157-180. http://dx.doi.org/10.1080/002075498193985
Kim, C.O.,Baek, J.G., Baek, J.K. (2004). A two-phase heuristic algorithm for cell formation problems considering alternative part routes and machine sequences. International Journal of Production Research, 42(18): 3911-3927. doi:10.1080/00207540410001704078 Krushinsky, D., Goldengorin, B. (2012). An exact model for cell formation in group technology. Comput. Manag. Sci., 9: 323-338.
doi:10.1007/s10287-012-0146-2.
Kumar, L., Jain, P.K. (2008). Part-machine group formation with operation sequence, time, and production volume. Int. J. Simul. Model, 7(4): 198-209. http://dx.doi.org/10.2507/IJSIMM07(4)4.113
Lian, J., Liu, C.G., Li, W.J., Evans, S., Yin, Y. (2013). Formation of independent manufacturing cells with the consideration of multiple identical machines. International Journal of Production Research, 52(5):1363-1400. doi:10.1080/00207543.2013.843797
Lokesh, K., Jain, P.K. (2010). Concurrently part-machine groups formation with important production data. Int. J. Simul. Model, 9(1): 5-6. http://dx.doi.org/10.2507/IJSIMM09(1)1.133
Masmoudi, F., Hachicha, W., Haddar, M. (2008). A new combined framework for the cellular manufacturing systems design. In: proceedings of The 2008 international conference of manufacturing engineering and engineering management, London: United Kingdom. Miltenburg, J., Zhang, W. (1991). A comparative evaluation of nine well-known algorithms for solving the cell formation problem in group
technology. Journal of Operations Management, 10(1): 44-72. http://dx.doi.org/10.1016/0272-6963(91)90035-V
Mukattash, A.M., Adil, M.B., Tahboub, K.K. (2002). Heuristic approaches for part assignment in cell formation. Computers & Industrial Engineering, 42: 329-341. http://dx.doi.org/10.1016/S0360-8352(02)00020-7
Mahesh, O., Srinivasan, G. (2002). Incremental cell formation considering alternative machines. International Journal of Production Research, 40(14): 3291-3310. doi:10.1080/00207540210146189
Pandian, R.S., Mahapatra, S.S. (2009). Manufacturing cell formation with production data using neural networks. Computers & Industrial Engineering, 56(4): 1340-1347. http://dx.doi.org/10.1016/j.cie.2008.08.003
Papaioannou, G., Wilson, J.M. (2010). The evolution of cell formation problem methodologies based on recent studies (1997–2008): Review and directions for future research”. European Journal of Operational Research, 206(3): 509-521. http://dx.doi.org/10.1016/j. ejor.2009.10.020
Paydar, M.M., Sahebjamnia, N. (2009). Designing a mathematical model for cell formation problem using operation sequence. Journal of Applied Operational Research, 1(1): 30-38.
Sarker, B.R. (1996). The resemblance coefficients in group technology: a survey and comparative study of relational metrics. Computers Ind. Engng., 30(1): 103-116. doi:10.1016/0360-8352(95)00024-0
Seifoddini, H. (1998). Machine grouping - Expert systems: Comparison between single linkage and average linkage clustering techniques in forming machine cells. Computers & industrial engineering 15(14): 210-216. doi:10.1016/0360-8352(88)90088-5
Shafer, S.M., Meredith, J.R. (1990). A comparison of selected manufacturing cell formation techniques. International Journal of Production Research, 28(4): 661-673. http://dx.doi.org/10.1080/00207549008942747
Sivaraj, A., Sharma, R.K. (2012). Cluster analysis in cellular manufacturing by using proposed algorithm, In: Proceedings of 3rd International
Conference on Production and Industrial Engineering CPIE-2013, Dr B.R. Ambedkar NIT Jalandhar, India, 192-202.
Susanto, S., Al-Dabass, D., Bhattacharya, A. (2009). Optimised cell formation algorithm considering sequence of operations, alternative routing and part-volume, In: Proceedings of Third asia international conference on modelling & simulation, 25-29 May, 2009, Bali, India. 79-84. doi:10.1109/AMS.2009.145
Won, Y., Lee, K.C. (1991). Group technology cell formation considering operation sequences and production volumes. International Journal of Production Research, 39(13): 2755-2768. doi:10.1080/00207540010005060
Yasuda, K., Hu, L., Yin, Y. (2005). A grouping genetic algorithm for multi-objective cell formation problem. International Journal of Production Research, 43(4): 829-853. http://dx.doi.org/10.1080/00207540512331311859
Yin, Y., Yasuda K. (2005). Similarity coefficient methods applied to the cell formation problem: A comparative investigation. Computers & Industrial Engineering 48(3): 471-489. http://dx.doi.org/10.1016/j.cie.2003.01.001