A LONG SHADOW OF CHILDHOOD DISADVANTAGE ON LATE-LIFE HEALTH TRAJECTORIES IN CHINA
ZHENHUA JESSICA XU
A thesis submitted to the faculty at the University of North Carolina at Chapel Hill in partial fulfillment of the requirements for the degree of Master of Arts in the Department of Sociology
in the College of Arts and Sciences.
Chapel Hill 2015
Approved by:
Yang Claire Yang
Kathleen M. Harris
ABSTRACT
Zhenhua Jessica Xu: A Long Shadow of Childhood Disadvantage on Late-Life Health Trajectories in China
(Under the direction of Yang Claire Yang)
Childhood disadvantage casts a long shadow on health trajectories over the life course,
but little is known on how these associations vary by birth cohorts. This paper examines whether
childhood disadvantage is associated with health trajectories and how cohort effects moderate the
associations among Chinese elderly. Drawn data from the Chinese Longitudinal Healthy
Longevity Survey (CLHLS), I find inadequate access to health care, poor nutrition and no
schooling during childhood are associated with poor health in late life, while birth in rural areas
and having a father with lower occupational status are associated with better health. Cross-over
health trajectories by birth cohorts indicate that being born in rural areas and having father in low
SES are advantageous for older cohorts but disadvantageous among younger cohorts. Residential
stratified analysis suggest that China’s rapid economic growth and unprecedented social
TABLE OF CONTENTS
LIST OF TABLES ... v
LIST OF FIGURES ... vi
LIST OF ABBREVIATIONS ... vii
INTRODUCTION ... 1
Childhood Disadvantage and Health in Late Life ... 3
Cohort Effects ... 5
Frailty ... 6
Hypothesis ... 8
DATA AND METHODS ... 12
Analytic Methods ... 14
RESULTS ... 18
Childhood Disadvantage Differences within Cohorts... 20
Childhood Disadvantage Differences across Cohorts ... 24
Stratified Sample by Residential Areas and Gender ... 26
CONCLUSION AND DISCUSSION ... 33
APPENDIX ... 41
LIST OF TABLES
Table 1. Sample Descriptions CLHLS 2002 - 2011 (N= 14,617) ... 19
Table 2. Growth Curve Model Estimates of Childhood Disadvantage with Age
Trajectories of Frailty in China ... 21
Table 3. Estimates of Childhood Disadvantage with Age Trajectories of Frailty by
LIST OF FIGURES
Figure 1. Predicted age trajectories of frailty (N=14,617) ... 23
Figure 2. Cohort variations in predicted mean levels of frailty index among Chinese
elderly ... 25
Figure 3. Predicted age trajectories of frailty within cohorts by nutrition in rural and
urban subsamples ... 28
Figure 4. Predicted age trajectories of frailty for each birth cohort by nutrition in rural
areas. ... 31
Figure 5. Predicted age trajectories of frailty for each birth cohort by nutrition in urban
LIST OF ABBREVIATIONS
ADL Activities of daily living
CLHLS The Chinese Longitudinal Health Longevity Survey
FI Frailty Index
GCM Growth curve model
IADL Instrumental activities of daily living
MMSE The Mini Mental State Examination
INTRODUCTION
Childhood disadvantage casts a long shadow on late-life health (Ferraro, Shippee, &
Schafer, 2009; Haas, 2008; Herd, Goesling, & House, 2007; Smith, 2004). Disadvantageous
childhood is associated with higher morbidity, disability and mortality risks through
biopsychosocial mechanisms (Herd et al., 2007; Link & Phelan, 1995; Pollitt, Rose, & Kaufman,
2005; Poulton et al., 2002; Preston, Hill, & Drevenstedt, 1998; Pudrovska & Anikputa, 2014;
Smith, Mineau, Garibotti, & Kerber, 2009). However, few studies have examined cohort
variations in the long-term impacts of disadvantaged childhood on late-life health, particularly
for less developed countries (McEniry, 2013). Comparing to developed societies, developing
counterparts experienced distinctive causes and consequence of morality decline during the
twentieth century, which may reflect cohort specific associations between childhood
disadvantage and health trajectories in late life for these societies. Furthermore, the association
between disadvantageous childhood and health trajectories may vary by gender and residential
areas across birth cohorts. Prior studies from less developed countries suggest that life
expectancy largely improved in at ages under five or above forty in the past century. Female
gained larger life expectance than male, while urban areas gained more rapidly than rural areas
(Preston, 1980). This evidence indicates heterogeneity of life expectance that highlight the
importance of gender and residential differentials in cohort variations when examining long-term
impacts of childhood disadvantage on health trajectories in less developed countries.
In this paper, I draw data from the Chinese Longitudinal Health Longevity Survey
trajectories over the life course, and further examine how the associations vary by birth cohorts
across gender and residence areas in China. China has been undergoing rapid social, political and
economic changes during the past century, providing unique social contexts to examine how
childhood conditions exhibit a long-term influence on health trajectories in later life since
early1910s. Most previous China-based studies usually treat birth cohorts of early twentieth
century as a single birth cohort (Wen & Gu, 2011; Zeng, Gu, & Land, 2007), thus cohort
variations regarding the long term effects of dynamic societal changes are less explored. For
instance, China experienced a critical public health transition due to modern medical knowledge
spreading and accessible clean water in big cities around 1920s. Beijing and other big cities
became healthier places to live than the countryside during that period, partially due to improved
medical infrastructure, hygiene regulations, sanitation and public health such as renovated
sewage system, water supply during 1920s – 1930s that significantly increased life expectancy in
urban areas (Campbell, 1997). Medical centers funded by western countries, such as the
Rockefeller Foundation’s China Medical Board, introduced western institutional health
infrastructures, public health programs, and sanitary interventions. These medical centers
contributed to the reducing risk of infectious diseases and mortality in big cities (Campbell,
1997).
Considering the long term effects of early life conditions on late health may vary across
birth cohorts, this study aims to distinguish cohort variations in the association between
childhood disadvantage and health trajectories among Chinese population in early twentieth
century. This paper first reviews conceptual life course mechanisms that link childhood
disadvantages with later-life health outcomes. Then I discuss the importance of examining cohort
Finally, I explain measurements of health, frailty index, and advantage of using frailty to
illustrate cohort variations in the association of childhood disadvantage with late health
trajectories.
Childhood Disadvantage and Health in Late Life
Early socioeconomic status (SES) fundamentally influences health disparities in late life
(Dannefer, 2003; Merton, 1988; Phelan, Link, & Tehranifar, 2010; Willson, Shuey, & Elder,
2007). Early life disadvantage as “the first life course risk” and “initial injustice” provoke
cumulative effects on health via biological, psychological, social and ecological pathways
(Ferraro et al., 2009; Gortmaker & Wise, 1997; Herd et al., 2007; O'Rand, 2006). Extensive
evidence suggests that early socioeconomic conditions influence later health trajectories through
biopsychosocial mechanisms over the life course (Campbell & Lee, 2009; Elder, 1998; Elo &
Preston, 1992; Ferraro et al., 2009; Finch & Crimmins, 2004; Merton, 1968; O'Rand, 2006;
Smith et al., 2009). The “long arm” of disadvantaged socioeconomic conditions during
childhood are positively associated with physical, psychological impairments and mortality risks
in late life (Herd et al., 2007; Link & Phelan, 1995). For instance, low parental education is
associated with a high likelihood of physical limitations and impairments, poor mental health,
heart disease, hypertension, and increase level of allostatic load, systolic blood pressure and
inflammation in late life (Poulton et al., 2002). Childhood residential stability in family and
neighborhood is positively associated with good mental health in later life (Bures, 2003).
China-based study using the CLHLS data find low childhood SES is associated with higher risk of
functional limitations, cognitive impairments, poor self-reported health and mortality (Huang &
Hypothetical mechanisms of childhood disadvantage on health in life course
paradigm. Life course paradigm provides a framework to understand changing lives in changing
contexts. Life course as a concept refers to a sequence or temporal pattern of age-graded events
and roles revealing sociological contours of biography, emphasizing dynamics of social contexts
and their interaction with human development from birth to death (Elder, Shanahan, & Jennings,
2015). Life course paradigm emphasizes dynamics of socially constructed meaning of age, birth
and death over time and place.
Hypothetical mechanisms underlying links between early-life conditions and health
outcomes over life course include: critical period model, accumulation of risks model, pathway
model, and mobility model (Pollitt et al., 2005; Pudrovska & Anikputa, 2014). Critical period
model elaborates a window of time - biological and epidemiological origins of health outcomes
deriving from very early stage of life and even before birth – that exerts long lasting, permanent,
irreversible, and direct influence on health outcomes in late life (Barker, 1998; Ben-Shlomo &
Kuh, 2002; Braveman & Barclay, 2009; Pudrovska & Anikputa, 2014).
Accumulation of risks model emphasizes persistent, additive, overall, and synergistic
effects of risks on later health outcomes across multiple life stages (Pudrovska & Anikputa,
2014) rather than a single life stage as critical period model documents. Specifically, initial risks
during childhood make one more vulnerable to adverse situations and lasting risk exposures
throughout adulthood. At the same time, the adverse adulthood may also increase risks of poor
health outcomes in late life. Therefore, both childhood and adulthood disadvantage additively or
accumulatively increases the health disparities over the life course. A China-based study shows
that inadequate access to medical care during both childhood and late life cumulatively decreases
Pathway model posits that childhood disadvantage is associated with health in late life
through mediating factors, for instance, SES and health behaviors in adulthood, such that
early-life conditions link health outcomes indirectly. Studies have found that associations of childhood
SES with health at advanced ages are indirect and mediated by adulthood occupation, marital
status, and health behaviors such as smoking using Chinese population (Shen & Zeng, 2014;
Zeng et al., 2007).
Mobility model describes dynamics of socioeconomic positions change over life course,
indicating an upward or downward mobility moderates effects of childhood disadvantage on
health in late life. In sum, four hypothetical life course models represent potential mechanisms
on how childhood conditions are associated with health disparities in late life. I expect the
hypothetical models of life course mechanisms may vary by different birth cohorts in China,
which may attribute to the rapidly changing Chinese society and increasing social inequality
among urban and rural areas over past few decades,
Cohort Effects
From concepts to mechanisms. A cohort is defined as a group of people experiencing
life events or social changes at the same period such as a birth cohort or marriage cohort. Cohort
effects describe enduring effects of specific life events or social changes among some cohorts
that distinguish them from other cohorts. In 1960s, Ryder (1965) asserts cohort as a concept to
study social changes, for human being interact with social changes and historical contexts over
their life course and the social and historical environments shape features of certain birth cohorts,
for example, baby boom cohorts (1946-1962). During the past half-century, research on cohort
effects has developed from concepts into mechanisms that how early life experience matters over
theoretical and methodological developments of cohort analysis address two kinds of research
questions: (1) Across birth cohorts, what lead to health disparities, and (2) Within birth cohorts,
how the health disparities can happen over life course. In this study, I integrate the two research
questions aiming to uncover how early life environments link to late health trajectories within
and across birth cohorts.
Cohort mechanisms interpreting health disparities. Cohort effects elaborate formative
and cumulative impacts of both early-life conditions and lasting exposures to historical and
socioeconomic factors over the life course on subpopulation (Elo & Preston, 1992; Yang, 2009),
which may contribute to distinctive health trajectories in late life. Birth cohorts not only acquire
coherence from structured social contexts in early life, they also adapt to distinctive societal
developments that shape ecological processes of birth cohorts by time and place (Elder &
Shanahan, 2006). Research on cohort mechanisms of health disparities emerged in 1970s when
mortality was a major health measure. Investigators discovere a cohort specific mortality based
on a French urban population study in nineteenth century, suggesting hygienic improvements
increase life expectancy of younger birth cohorts rather than whole age groups of the population
(Preston & Walle, 1978). Existing literature finds that Chinese birth cohorts of the Great Famine
(1959-1962) endure worse health and earn less income than other birth cohorts in later life (Chen
& Zhou, 2007).
Frailty
Frailty is clinically defined as a failure to repair damaged cells that lead to tissue and
organ damages (Kirkwood, 2005; Rockwood & Mitnitski, 2011). Frailty describes susceptibility
to disease and death in aging process of human being. Frailty is depicted as a physiological
clinical and biological pathways (Fried, Ferrucci, Darer, Williamson, & Anderson, 2004;
Rockwood & Mitnitski, 2011). Conventionally, theoretical concept of frailty as a risk factor of
mortality is obtained from many variables using mathematical techniques to investigate patterns
of its association with mortality at the population level. The early definition of frailty is fixed at
birth and constant throughout the life course (Vaupel, Manton, & Stallard, 1979), thus the
variation of frailty as an aging process is unobserved. For the past few decades, however, frailty
has integrated clinical perspectives by involving systemic measures of symptoms, disability,
disease classification, and physiological disorder among community dwelling older people
(Rockwood & Mitnitski, 2011). The recent concept of frailty highlights an entity of health
reserves and cumulative deficits, especially the long-term effects of childhood conditions on
health outcomes over the life course.
Frailty Index. Frailty index (FI) is widely used to measure the degree of frailty by
counting total numbers of self-reported symptoms related to chronic diseases, functional
limitations, and mental impairments (Searle, Mitnitski, Gahbauer, Gill, & Rockwood, 2008). FI
is regarded as a valid and generalized composite measure of cumulative health disorders and
deficits in biological aging processes. FI integrates aging related physiological functions that
effectively track heterogeneity of aging processes across individuals and dynamic trends of
health reserves across population due to changing environments over time. FI presents a more
comprehensive understanding of aging trajectories than a signal dimension of health measure
such as self-reported health (Yang & Lee, 2010).
FI as a reliable and valid predictor of mortality risk has its advantages in measuring aging
processes. First, accumulative deficits (by summing up total numbers of symptoms related to
time. Second, FI represents environment factors relevant to both recovery rate and damage rate
of human bodies. Third, age distributions of FI are insensitive to survey design and number of
variables composing this index (Mitnitski et al., 2005). FI is widely used to measure frailty cross
different populations due to its good availability in health survey. In sum, FI provides a
standardized comprehensive geriatric assessment of impairments, disability and comorbidities
and offers a valid, reliable and sensitive clinical measure for health (Jones, Song, & Rockwood,
2004).
Age trajectories of Frailty. Age trajectories describe a temporal pattern of roles,
experiences and statuses that vary as one ages. The onset and duration exposures to risk factors
jointly shape age trajectories over the life course. Risk accumulations, available resources, social
contexts, and human agencies also influence age trajectories (Elder & Shanahan, 2006; Ferraro et
al., 2009; Hitlin & Elder, 2007). Age trajectories of frailty represent age-graded patterns of
vulnerability to cumulative deficits such as chronic diseases, functional limitations, physical
disabilities, and mental impairments which may vary across birth cohorts. Age trajectories of
frailty are embedded in peculiar historical contexts and social institutions for each birth cohort.
This paper gives special attention to integrating cohort variations into the biological aging
process in social contexts of China.
Hypothesis
Social institutions and historical contexts. The importance of social institutions is a
basic principle of life course theory. Sociologists and social epidemiologists have emphasized
that socially structured conditions are key to understand how aging processes of individuals are
related to macrostructural circumstances over time and place (Mayer, 2004; Mayer, 2009; Moen,
early life conditions of population and shape potential mechanisms on how childhood
disadvantage are associated with health trajectories over the life course. Few studies, however,
focus on the association between childhood disadvantage and health trajectories over the life
course in Chinese society. Given China’s unique social contexts, I purpose the first hypothesis:
Hypothesis 1. Childhood disadvantage increases mean level of frailty index across all ages within each cohort.
Prior longitudinal studies have found that educational differentials in health disparities
converge across successive cohorts (Chen, Yang, & Liu, 2010). Income gap in self-reported
health trajectories diverges across age for birth cohorts in 1930s, but it converges for birth cohort
in 1960s (Chen et al., 2010). For earlier birth cohorts (1900 – 1930), however, the association
between early-life conditions and health trajectories is less discussed. Birth cohorts before 1910s
experienced the republican revolution and early residential inequality from 1901 to 1911. The
economic inequality between urban and villages had increased during 1910s in China, partially
due to economic growth in newly opened treaty ports around costal, accelerated urban
developments around riverine areas, and renovated public sanitary infrastructures such as water
supply, estimations of Health Stations in big cities (Campbell, 1997; Fairbank & Goldman,
2006), whereas the self-reproductively agricultural economy in villages was left behind. Birth
cohorts after 1910s experienced establishment of the Republic of China in their childhood and
exposed to implications of economic and educational policies on individual, family, residential
regions and even entire country. Cohort variations in age trajectories of frailty may associate
with the long arm of differential social conditions during childhood. The second hypothesis
examines whether the impacts of early childhood conditions on frailty in late life vary across
Hypothesis 2. The gap in age trajectories of frailty between disadvantaged and advantaged childhood converges in recent birth cohorts.
Health inequalities in urban and rural areas. Household registration (Hukou) system
launched in 1950s is a residential permit system in China. Hukou system divides Chinese
population into agricultural and non-agricultural identity, which is still in place for nowadays.
Hukou system initially intended to limit the demographic mobility from rural to urban side since
the first Five -Year Plan (1953 – 1957) of industrialization. Rural residents have fewer
opportunities to receive formal education and public health service than urban counterparts.
Rural residents not only means spatial differentials in dwellings but also means less life chances
in upward social mobility than those in urban side (Wu & Treiman, 2004). In traditional agrarian
Chinese society, administration and market in rural areas created hierarchal social structures,
including gentries, peasants, inter-middle merchants (Skinner, 1985). In modern China society
(after 1950s), the gentry-peasant hierarchal structure has no longer existed. However, as China’s
precedential economic growth since 1978, the social inequality between rural and urban areas
increases as well. Scholars describe China as “one country but two societies” (Whyte, 2010). For
instance, education and health care resource become more privatized and fragmented, which is
unaffordable for people with rural Hukou (Blumenthal & Hsiao, 2005). Even for those birth
cohorts born before emergence of Hukou system, their life trajectories are significantly shaped by
this residential system in adulthood and late life. Being rural residents is a cumulative
disadvantage over the life course, for they have higher risk in school dropout, lower chances to
seek for higher education in early life. During the adulthood, they work on farm or nonfarm jobs
for low payment. The rural-urban income gap have widened after economic reforms since 1980s.
examines whether the association between childhood disadvantage and health trajectories vary
across residential areas and gender.
Hypothesis 3. Patterns of associations between childhood disadvantage and age trajectories of frailty are different between rural and urban areas.
DATA AND METHODS
I draw data from the Chinese Longitudinal Healthy Longevity Survey (CLHLS) from
2002 to 2011. The CLHLS is a nationally representative survey that selects half of total counties
and cities in 22 out of 31 provinces in China, which has covered 1.1 billion people and about 85
percent of total population
(http://centerforaging.duke.edu/chinese-longitudinal-healthy-longevity-survey). The goal of this survey is to determine how social, behavioral, biological and
environmental factors affect health and longevity in Chinese society. Baseline survey is in 1998,
and respondents are followed up every two or three years. Nowadays, CLHLS has collected six
waves: 1998, 2000, 2002, 2005, 2008 and 2011. In each wave, deceased or lost to follow-up
people are replaced with new participants. In first two waves (1998 and 2000), CLHLS cohort is
80 years old and above. Since 2002, younger birth cohorts aged 65 – 79 have been included, and
birth cohorts aged 45 – 64 have been included since 2008. In order to obtain a large age range
and repeated measures of health in the longitudinal survey, this study chooses wave 2002, 2005,
2008 and 2011. 16,064 Chinese elderly aged 65 years and older participated into this survey in
2002. I exclude people aged less than 65 years old or above 105 years old (n=260) and drop
individuals with missing value in frailty index (n=242), childhood disadvantage, demographic
characteristics and health behaviors (n=1020). Finally, we have 14,617 respondents in analytic
sample.
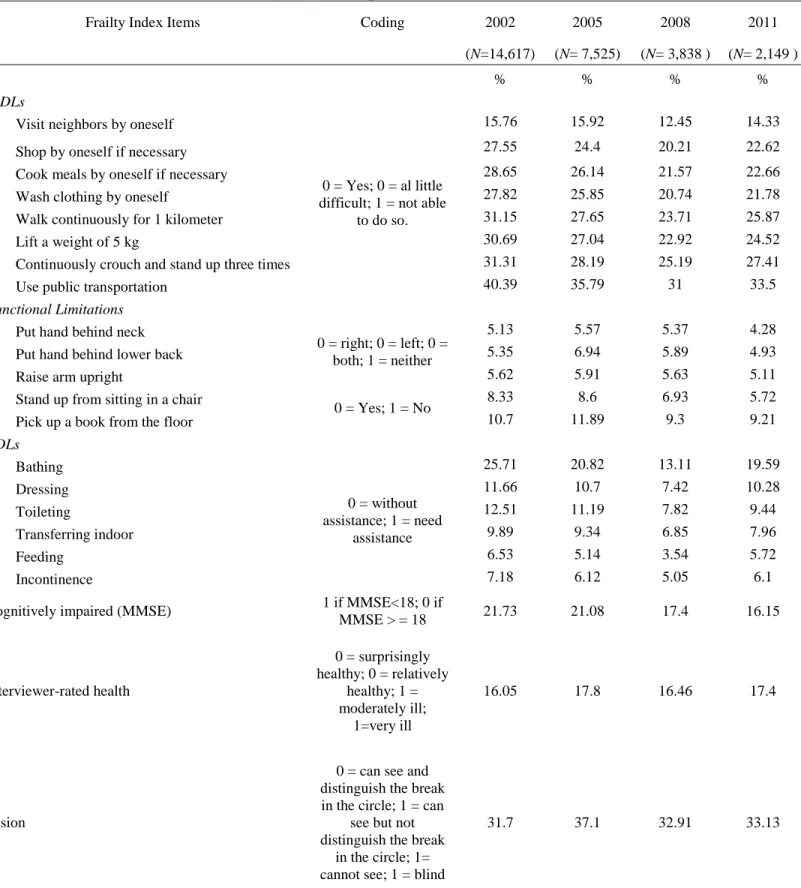
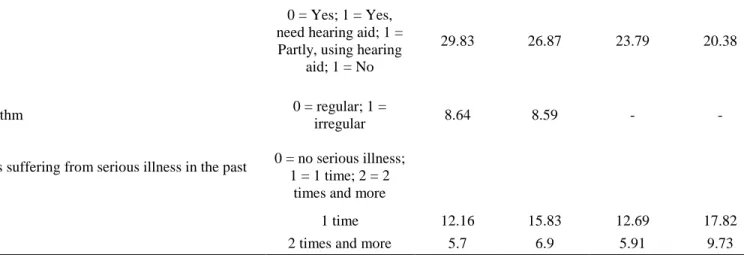
Frailty is defined based on the counts of deficits such as symptoms, signs, diseases,
disabilities or other abnormalities of health conditions. Frailty Index (FI) is calculated by
counting the number of deficits divided by the total number of potential deficits evaluated
(Rockwood et al 2010). The range of FI is from 0 to 1. For instance, if a respondent reports 6 out
Higher value of FI represents poor health conditions. FI in this paper includes instrumental
activities of daily living (IADLs), activities of daily living (ADLs), functional limitations,
cognitive impairments (measured by the Mini Mental State Examination, MMSE),
auditory/visual ability, heart rhythm, numbers of times suffering from serious illness in the past
two years, and interviewer reported health (Appendix Table A1).
Cohort variable is separated into 8 categories with 5 year interval for each group: before
1900, 1900-1904, 1905-1909, 1910-1914, 1915-1919, 1920-1924, 1925-1929 and after 1930.
Cohort coded from 1 to 8 is a continuous variable in model estimation. Childhood disadvantage
includes four retrospective questions in 2002 survey, (1) No schooling: never went to school
(yes=1, no=0), (2) Poor nutrition: arm length in the lowest quartile (yes=1, no=0), (3) Inadequate
health care: unable to get access to health care service when being sick in childhood (yes=1,
no=0), (4) Rural born: birth in rural areas and (5) Father in low SES: father in manual
occupations before sixty years old (yes=1, no=0). Previous studies shows arm length indicates
nutrition conditions in early life, which is a reliable measure of nutrition conditions in early life
for old people than other physical signs such as height (Huang & Elo, 2009; Jeong et al., 2005). I
define arm length in bottom quartile (1= arm length in bottom quartile, 0 = otherwise) as an
indicator of poor nutrition in childhood. Inadequate access to health care is measured by asking
“Were you able to get access to health care when you were sick in childhood”. I code those who
answered “Not sick in childhood” or “be able to get access to health care” as 0; those who were
unable to get access to health care when sick as 1. Father’s occupation in (1) professional and
technical personnel, (2) governmental, institutional or managerial personnel is coded as 0; I code
husbandry, (5) housework, (6) military personnel, (7) unemployed and (8) others before sixty
years old as 1, representing father in low SES.
Demographic characteristics include age, gender, marital status, occupation, and
residential areas. Age (65-105 years old), gender (female=1, male=0), marital status
(devoiced/widowed/never married=1; currently married=0), residential areas (rural=1, urban=0)
and occupation (manual=1, otherwise = 0) were collected in 2002. I create dummy variables to
adjust for attrition issue: death (died=1, survival=0) and lost to follow up (yes=1, no=0). Health
behaviors include: (1) did you smoke in the past (Yes=1, No=0), (2) did you drink alcohol often
in the past (Yes=1, No=0), and (3) did you take exercise often in the past (Yes=1, No=0).
Analytic Methods
This paper uses growth curve model (GCM) to examine the association of childhood
disadvantage with age trajectories of frailty in late life. Level 1 model (equation 1) estimates
frailty index trajectories with age, named age trajectories of frailty, within each person. Level 2
model (equation 2) examines whether variations of childhood disadvantage (𝐶𝐻𝑖𝑗) and cohort
(𝐶𝑜ℎ𝑜𝑟𝑡𝑖) are associated with the changes of intercept (𝛽0𝑖 ) and slope (𝛽1𝑖 ) of age trajectories of
frailty between persons. Dependent variables in level 2 model are parameters of level 1 model,
which calculates to what extent the variance of mean and slope for age trajectories of frailty
within each person can be explained by variance of childhood disadvantage and cohort variables.
Interaction terms between childhood disadvantage and cohorts (𝐶𝐻𝑖𝑗 × 𝐶𝑜ℎ𝑜𝑟𝑡𝑖) examine whether
the association of age trajectories of frailty with childhood disadvantage varies by birth cohorts,
as hypothesis 2 states.
In level 1 model, 𝐹𝐼𝑡𝑖 represents repeated measures of individual 𝑖’s frailty index at time
2011. 𝐴𝑔𝑒𝑡𝑖 is age of the respondent 𝑖 at time 𝑡. For an easier interpretation of intercept (𝛽0𝑖 ), I use centered age, for it allows us to interpret the intercept (𝛽0𝑖 ) as mean levels of frailty index
when a person is at median age rather than at age of 0. In addition, centered age has two merits
in term of robustness of statistical estimates: (1) centered age eliminates confounding effects of
age and cohort variables; (2) centered age minimizes the correlation between age and quadratic
age and gains a robust estimation (Chen et al., 2010). 𝐴𝑔𝑒𝑡𝑖 is centered by median age of each birth cohort by subtracting a median age - 𝑚(𝐴𝑔𝑒) within each birth cohort at time t. For instance,
there are 894 respondents in birth cohort before 1900 with a median age of 103 years old. For
each person in this birth cohort, their centered age equals to their actual age in survey year of
2002 subtracting 103. Therefore, for those older than median age, their centered ages are
positive, whereas, for those younger than median age, they centered ages are negative. For other
notations in level 1 model, 𝛽1𝑖 is the linear growth rate of age trajectories of frailty; 𝛽2𝑖 is the quadratic growth rate of age trajectories of frailty. 𝑒𝑡𝑖 represents residual of each individual in age trajectories of frailty at time 𝑡. In sum, 𝐹𝐼𝑡𝑖and 𝐴𝑔𝑒𝑡𝑖− 𝑚(𝐴𝑔𝑒) and 𝑒𝑡𝑖are time-variant sections in growth curve model.
Level 1 Model
𝐹𝐼𝑡𝑖= 𝛽0𝑖+ 𝛽1𝑖[𝐴𝑔𝑒𝑡𝑖− 𝑚(𝐴𝑔𝑒)]+𝛽2𝑖[𝐴𝑔𝑒𝑡𝑖− 𝑚(𝐴𝑔𝑒)]2+ 𝑒𝑡𝑖 (1)
Level 2 Model
for the intercept:
𝛽0𝑖= 𝛾00+ ∑5𝑗=1 𝛾01𝑗𝐶𝐻𝑖𝑗+ 𝛾02𝐶𝑜ℎ𝑜𝑟𝑡𝑖+ ∑5𝑗=1 𝛾03𝑗𝐶𝐻𝑖𝑗× 𝐶𝑜ℎ𝑜𝑟𝑡𝑖+ ∑5𝑗=1 𝛾04𝑗𝑍𝑖𝑗+ 𝑢0𝑖 (2) for the linear growth rate:
𝛽1𝑖= 𝛾10+ ∑5𝑗=1 𝛾11𝑗𝐶𝐻𝑖𝑗+ 𝛾12𝐶𝑜ℎ𝑜𝑟𝑡𝑖+ ∑𝑗=15 𝛾13𝑗𝐶𝐻𝑖𝑗× 𝐶𝑜ℎ𝑜𝑟𝑡𝑖+ ∑5𝑗=1 𝛾14𝑗𝑍𝑖𝑗+ 𝑢1𝑖 (3)
no schooling, rural born and father in low SES) on intercept of age trajectories of frailty across
individuals; 𝛾02 is the main effects of birth cohort on the mean of frailty; 𝛾03𝑗 is the coefficient
of interactions between childhood disadvantage and cohorts, indicating how much mean effects
of childhood disadvantage on frailty trajectories vary across birth cohorts. 𝛾04𝑗 is the coefficient
for time invariant covariates 𝑍𝑖𝑗 on mean level of frailty trajectories, such as sex, residential
areas, marital status, occupation, health behaviors and attrition. For the linear growth rate of age
trajectories of frailty, 𝛾11𝑗 is coefficient of interaction term between age and childhood
disadvantage - 𝐶𝐻𝑖𝑗× 𝐴𝑔𝑒𝑡𝑖 (substitute 𝛽1𝑖 using equation 3), which indicates whether the effect of
childhood disadvantage on frailty vary by age. 𝛾12 is coefficient of interaction term between age and cohort - 𝐶𝑜ℎ𝑜𝑟𝑡𝑖× 𝐴𝑔𝑒𝑡𝑖 𝛾13𝑗is coefficient of three-way interaction term between age, cohort
and childhood disadvantage - 𝐶𝐻𝑖𝑗× 𝐶𝑜ℎ𝑜𝑟𝑡𝑖× 𝐴𝑔𝑒𝑡𝑖, which indicates whether the growth rate of
age trajectories of frailty in childhood disadvantage varies across birth cohorts. 𝛾14𝑗is the
coefficient of interaction term between age and covariates - 𝑍𝑖𝑗× 𝐴𝑔𝑒𝑡𝑖.
The CLHLS dataset span 9 years from 2002 to 2011. The number of observations
declined from 14,617 in 2002 to 2,347 in 2011 due to the increasing numbers of the deceased
and nonresponses (see Figure S1). The length of observation time for each respondent is
unbalanced across four waves. For instance, about 35 percent of respondents from 2002 survey
deceased and about 13 percent from 2002 survey were lost to follow up in 2005 survey,
suggesting about 48 percent of total respondents have only 1 time point observed value that
contributes to the changes of age trajectories of frailty over the 9 year observation period.
Unbalanced observation period across persons may be associated with the respondents’ health
conditions, such as it is highly possible that those with higher frailty index are more likely to
cases due to the deceased and nonresponses are not randomly distributed, which may result into
biased estimates if ignoring attrition issue in datasets. In our analysis, unbalanced data raise two
questions: (1) whether growth curve model (GCM) can obtained unbiased estimates from
incomplete or unbalanced number of repeated measures in longitudinal data and (2) if assuming
repeated measures are not missing at random, what strategies can diminish influence of
nonrandom missing due to attrition on coefficient estimates effectively. For question (1), the
advantage of GCM allows for incomplete and unbalanced data, in other words, the number of
𝐹𝐼𝑡𝑖 can vary over subjects. GCM can obtain consistent and asymptotically normal resulting
estimates without estimating the missing values, particularly in large sample and under normality
assumptions of fixed covariates, such as 𝐶𝐻𝑖𝑗, 𝐶𝑜ℎ𝑜𝑟𝑡𝑖and𝑍𝑖𝑗in our analysis (Raudenbush & Bryk,
2002; Vonesh & Carter, 1987, 1992). For question (2) on nonrandom missing issue, we create a
dummy variable for attrition in level 2 modeling to distinguish subjects deceased and
nonresponse from survival ones. We account for attrition as a dummy variable in second level
modeling, assuming health conditions of the deceased and nonrespondents are different from
other survival individuals, which is a simple but effective way to control attrition issue in
RESULTS
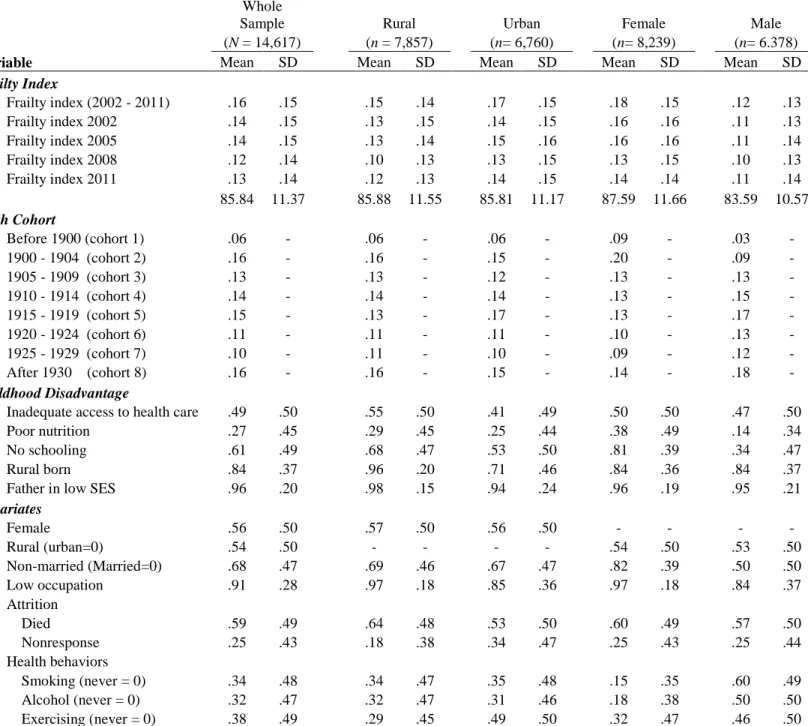
Table 1 describes characteristics of whole sample and stratified subsamples by residential
areas and gender. Average frailty index of total sample is 0.16 (s.d.= 0.15). Urban elderly have
higher frailty than rural elderly; female have higher frailty than male. Average frailty level
declines in recent survey years, partially because of early birth cohorts with high frailty index
deceased in the observational time period from 2002 to 2011. Average age of whole sample is
around 86 (s.d.= 11.37) years old. About 6 percent respondents were born before 1900, about 58
percent were born between 1900 and 1919; and 37 percent were born after 1920. About 30
percent of female were born before 1904, while about 12 percent of male were born before 1904.
About half of respondents didn’t get adequate access to health care in childhood. The percentage
of inadequate access to health care is 14 percent higher for people in rural areas than those in
urban areas; is 3 (=50-47) percent higher for female than male. About 27 percent people had
poor nutrition during childhood. Living in rural areas is more likely to have poor nutrition in
childhood than living in urban areas; female have poor nutrition than male. Education in
childhood follows the same pattern of difference between residential areas and gender. About 81
percent of female had never went to school, whereas male had 34 percent. People living in rural
areas has 15 percent higher in no schooling than those living in urban areas. 71 percent of urban
elderly were born in rural areas, where 96 percent of rural elderly were rural born. There are
about 96 percent of respondents whose father worked in manual occupations before sixty years
Table 1. Sample Descriptions CLHLS 2002 - 2011 (N= 14,617)
Whole
Sample Rural Urban Female Male
(N = 14,617) (n = 7,857) (n= 6,760) (n= 8,239) (n= 6.378)
Variable Mean SD Mean SD Mean SD Mean SD Mean SD
Frailty Index
Frailty index (2002 - 2011) .16 .15 .15 .14 .17 .15 .18 .15 .12 .13
Frailty index 2002 .14 .15 .13 .15 .14 .15 .16 .16 .11 .13
Frailty index 2005 .14 .15 .13 .14 .15 .16 .16 .16 .11 .14
Frailty index 2008 .12 .14 .10 .13 .13 .15 .13 .15 .10 .13
Frailty index 2011 .13 .14 .12 .13 .14 .15 .14 .14 .11 .14
Age 85.84 11.37 85.88 11.55 85.81 11.17 87.59 11.66 83.59 10.57
Birth Cohort
Before 1900 (cohort 1) .06 - .06 - .06 - .09 - .03 -
1900 - 1904 (cohort 2) .16 - .16 - .15 - .20 - .09 -
1905 - 1909 (cohort 3) .13 - .13 - .12 - .13 - .13 -
1910 - 1914 (cohort 4) .14 - .14 - .14 - .13 - .15 -
1915 - 1919 (cohort 5) .15 - .13 - .17 - .13 - .17 -
1920 - 1924 (cohort 6) .11 - .11 - .11 - .10 - .13 -
1925 - 1929 (cohort 7) .10 - .11 - .10 - .09 - .12 -
After 1930 (cohort 8) .16 - .16 - .15 - .14 - .18 -
Childhood Disadvantage
Inadequate access to health care .49 .50 .55 .50 .41 .49 .50 .50 .47 .50
Poor nutrition .27 .45 .29 .45 .25 .44 .38 .49 .14 .34
No schooling .61 .49 .68 .47 .53 .50 .81 .39 .34 .47
Rural born .84 .37 .96 .20 .71 .46 .84 .36 .84 .37
Father in low SES .96 .20 .98 .15 .94 .24 .96 .19 .95 .21
Covariates
Female .56 .50 .57 .50 .56 .50 - - - -
Rural (urban=0) .54 .50 - - - - .54 .50 .53 .50
Non-married (Married=0) .68 .47 .69 .46 .67 .47 .82 .39 .50 .50
Low occupation .91 .28 .97 .18 .85 .36 .97 .18 .84 .37
Attrition
Died .59 .49 .64 .48 .53 .50 .60 .49 .57 .50
Nonresponse .25 .43 .18 .38 .34 .47 .25 .43 .25 .44
Health behaviors
Smoking (never = 0) .34 .48 .34 .47 .35 .48 .15 .35 .60 .49
Alcohol (never = 0) .32 .47 .32 .47 .31 .46 .18 .38 .50 .50
Table A2 shows descriptive statistics by each birth cohort. Average frailty level is lower
in recent birth cohorts than early birth cohorts. Within each birth cohort (column), frailty index
increases from 2002 to 2008. Recent birth cohorts are more likely to report inadequate access to
health care in childhood than early birth cohorts. Early birth cohorts were mostly rural born,
more vulnerable to poor nutrition, and had no schooling in childhood (see Table A2). As
covariates, recent birth cohorts are more likely to smoke, drink alcohol; less likely to take
exercise than early birth cohorts.
Childhood Disadvantage Differences within Cohorts
Table 2 shows the growth curve model estimates of age trajectories of frailty. Model 1 to
Model 4 partially support hypothesis 1 that three indicators (inadequate health care, poor
nutrition, and no schooling) of childhood disadvantage increase the mean level of age trajectories
of frailty within birth cohorts, however, being born in rural areas decreases the mean level of age
trajectories of frailty within birth cohorts. Model 1 shows that overall mean of age trajectories of
frailty is 0.216 (p<0.001) with a growth rate of 0.127 (p<0.001) and a quadratic growth rate of
-0.720 (p<0.001), indicating frailty trajectories follow a nonlinear trend over ages (see Figure 1
based on the estimation of Model 7). Indicators of childhood disadvantage are added in Model 2,
suggesting that poor nutrition and no schooling are positively associated with age trajectories of
frailty, whereas inadequate health care and rural born are negatively associated with frailty
trajectories. Model 3, after adjusting covariates, shows the significant effects of poor nutrition
and no schooling on frailty still remain, but being rural born and inadequate health care are not
Table 2. Growth Curve Model Estimates of Childhood Disadvantage with Age Trajectories of Frailty in China
Whole Sample
(N=14,617)
Fixed Effects (1) (2) (3) (4) (5) (6) (7)
For Intercept
Intercept 0.216*** 0.183*** 0.074*** 0.420*** 0.457*** 0.467*** 0.466***
(0.002) (0.009) (0.010) (0.010) (0.020) (0.021) (0.021)
Childhood disadvantage
Inadequate access to health care -0.019*** -0.005 0.009*** 0.020** 0.021** 0.020**
(0.003) (0.003) (0.003) (0.007) (0.007) (0.007)
Poor nutrition 0.042*** 0.026*** 0.016*** 0.050*** 0.049*** 0.049***
(0.004) (0.004) (0.003) (0.007) (0.008) (0.008)
No schooling 0.084*** 0.034*** 0.009** 0.048*** 0.044*** 0.043***
(0.004) (0.004) (0.003) (0.008) (0.008) (0.008)
Rural born -0.013** -0.004 -0.009* -0.052*** -0.054*** -0.055***
(0.005) (0.005) (0.004) (0.010) (0.011) (0.011)
Father in low SES -0.012 -0.008 -0.001 -0.048** -0.051** -0.050*
(0.008) (0.008) (0.007) (0.018) (0.019) (0.019)
Cohort -0.048*** -0.056*** -0.058*** -0.058***
(0.001) (0.003) (0.004) (0.004)
Cohort × Childhood disadvantage
Cohort × Inadequate access to health care -0.002 -0.002 -0.002
(0.001) (0.001) (0.001)
Cohort × Poor nutrition -0.007*** -0.007*** -0.007***
(0.001) (0.002) (0.002)
Cohort × No schooling -0.007*** -0.007*** -0.007***
(0.001) (0.001) (0.001)
Cohort × Rural born 0.009*** 0.009*** 0.009***
(0.002) (0.002) (0.002)
Cohort × Father in low SES 0.009** 0.009** 0.009**
(0.003) (0.004) (0.004)
For Linear Growth Rate
Intercept 0.127*** 0.115*** 0.082*** 0.104*** 0.104*** 0.148** 0.242***
(0.010) (0.010) (0.009) (0.008) (0.008) (0.051) (0.058)
Childhood disadvantage
Inadequate access to health care -0.020 -0.007
(0.020) (0.021)
Poor nutrition -0.013 -0.017
(0.023) (0.023)
No schooling 0.034 0.017
(0.021) (0.022)
Rural born -0.036 -0.038
(0.028) (0.028)
Father in low SES -0.008 -0.007
(0.050) (0.050)
For Quadratic Growth Rate
Intercept -0.720*** -0.646*** -0.361*** 0.076 0.073 0.073 0.099
(0.051) (0.050) (0.047) (0.043) (0.043) (0.053) (0.053)
Covariates
Female 0.027*** 0.036*** 0.035*** 0.036*** 0.036***
(0.004) (0.004) (0.004) (0.004) (0.004)
Rural -0.030*** -0.022*** -0.022*** -0.022*** -0.022***
(0.003) (0.003) (0.003) (0.003) (0.003)
Non-married (Married = 0) 0.078*** -0.000 0.001 0.000 0.001
(0.004) (0.003) (0.003) (0.004) (0.004)
Low occupations -0.002 -0.010 -0.007 -0.008 -0.008
(0.006) (0.005) (0.005) (0.006) (0.006)
Attrition
Died 0.133*** 0.032*** 0.033*** 0.035*** 0.035***
(0.004) (0.004) (0.004) (0.004) (0.004)
Nonresponse 0.050*** -0.003 -0.002 -0.001 -0.000
(0.005) (0.004) (0.004) (0.005) (0.005)
Smoking -0.007 0.005 0.004 0.005 0.005
(0.004) (0.003) (0.003) (0.004) (0.004)
Alcohol -0.003 -0.008** -0.009** -0.010** -0.010**
(0.004) (0.003) (0.003) (0.003) (0.003)
Exercising -0.028*** -0.030*** -0.029*** -0.031*** -0.031***
(0.003) (0.003) (0.003) (0.003) (0.003)
Random Effects - Variance Components
Level 1: Within person 0.161** 0.161** 0.162** 0.164** 0.164** 0.152** 0.152**
Level 2: In intercept 0.161** 0.154** 0.130** 0.100** 0.100** 0.107** 0.107**
In Growth Rate 0.052* 0.055* 0.071* 0.053* 0.054* 0.507* 0.506*
Goodness of Fit
BIC -7874.0 -8560.6 -10728.7 -13866.0 -13849.7 -13118.5 -13113.0
Standard errors in parentheses
23
lower frailty than those living in urban areas. Female and unmarried old people are positively
associated with greater mean level of frailty trajectories than men and non-married old people. It
is noted that died and nonresponse individuals are likely to report higher frailty than survival
counterparts.
Model 4 controls for cohorts. The negative coefficient of cohort (-0.048, p<0.001)
indicates the mean level of frailty trajectories decreases in younger birth cohorts. The estimates
of childhood disadvantage in Model 4 suggest that, within each birth cohort, inadequate access to
health care, poor nutrition and no schooling are associated with greater mean level of age
trajectories of frailty. Being born in rural areas, however, exhibits protective effects against
elevated frailty trajectories with age.
Childhood Disadvantage Differences across Cohorts
(Figure 2 is about here)
Model 5 to Model 7 examine hypothesis 2 that whether the gap in the long-term effects of
childhood disadvantage on frailty trajectories vary across birth cohorts. The gap of age
trajectories of frailty in nutrition and education converge in successive birth cohorts, which is as
we expected and supports hypothesis 2. However, the gap of age trajectories of frailty birth place
and father’s SES diverge in successive cohorts, which does not support hypothesis 2. Model 5
includes interaction terms between cohort and each indicator of childhood disadvantage to
examine whether the associations between childhood disadvantage and age trajectories of frailty
vary by birth cohorts. Negative coefficients of poor nutrition and no schooling (-0.007, p<0.001)
indicate the gap of frailty trajectories in these two domains declines in younger birth cohorts,
whereas positive coefficients (0.009, p<0.001) of rural born and father in low SES indicate the
25
age trajectories of frailty by each indicator of childhood disadvantage are not uniform across
cohorts. Gaps of frailty trajectories in education and nutrition decrease in successive birth
cohorts. Gaps of frailty trajectories in birth place and father’s SES have a crossover effect over
birth cohorts. The predicted frailty index by birth place shows that older people born in urban
areas before 1920s have a greater frailty index than those born in rural areas before 1920s in later
life, however, those born in urban areas after 1920s have a lower frailty index than those born in
rural areas after 1920s. The crossover effects of birth places suggest that urban born origin was
disadvantageous for cohorts born before 1920s, however, it was advantageous for cohorts born
after 1920s. People having father in high SES have greater frailty for those born before 1910s,
whereas they have lower frailty for those born after 1910s. Figure 2 shows that impacts of
childhood disadvantage on frailty trajectories differ across birth cohorts and differ among each
domain of childhood disadvantage. Model 6 and 7 control for interaction terms of 𝑎𝑔𝑒 × 𝑐ℎ𝑖𝑙𝑑ℎ𝑜𝑜𝑑 𝑑𝑖𝑠𝑎𝑑𝑣𝑎𝑛𝑡𝑎𝑔𝑒 and 𝑎𝑔𝑒 × 𝑐𝑜ℎ𝑜𝑟𝑡. The coefficients of interactions terms between
childhood and cohorts have little changes after controlling them.
Stratified Sample by Residential Areas and Gender
The estimates of Table 3 support hypothesis 3 and 4 that the association of childhood
disadvantage with frailty trajectories vary by residential areas and gender. Results of rural
subsample show that inadequate health care is positively associated with higher mean of frailty,
whereas there are no significant associations between inadequate health care and frailty in urban
subsample. In urban subsample, rural born people are likely to have lower mean level of frailty
index than urban born elderly, however, being rural born is not significantly associated with
mean level of frailty in rural subsample. In urban areas, differences of mean level of frailty
associations are insignificant in rural areas. The direction of coefficients (𝛾11𝑗 ) in interaction age
× poor nutrition are positive for rural areas and negative for urban areas, suggesting that the
effects of poor nutrition on frailty trajectories increase as ages in rural areas, but decrease as age
in urban areas. A three-way interaction term 𝐴𝑔𝑒 × 𝑃𝑜𝑜𝑟 𝑁𝑢𝑡𝑟𝑖𝑡𝑖𝑜𝑛 × 𝐶𝑜ℎ𝑜𝑟𝑡 is considered in rural and urban subsample analysis. 𝛾14𝑗 is the coefficient for this item. 𝛾14𝑗 = −0.027
(p<0.001) in rural subsample suggests the rate of poor nutrition gap diverging with ages lessened
in successive birth cohorts in rural areas (Figure 4). Figure 4 depicts poor nutrition gap with ages
by each birth cohort in rural areas. The poor nutrition gap diverges in early birth cohorts (cohort
before 1900, 1900-1904, 1905-1909 and 1910-1904), and converges in later recent birth cohorts
(after 1930) in rural areas. Such trend of age trajectories of frailty in rural areas suggests that the
effect of poor nutrition weakens in more recent birth cohorts. By contrast, 𝛾14𝑗= 0.047
(p<0.001) in urban subsample suggests the rate of poor nutrition gap converging (-0.036,
p<0.001) with age strengthened in successive birth cohorts in urban areas (see Figure 5). Figure
5 shows that gaps of age trajectories of frailty in nutrition decrease as ages among early birth
cohorts: before 1900, 1900-1904, 1905-1909 and 1910-1914; however, the gaps increase in
recent birth cohorts: after 1930 in urban areas. Growth rate of convergence of poor nutrition gap
with age increase in successive birth cohorts in urban areas, suggesting the effects of poor
nutrition on frailty trajectories strengthen in recent birth cohorts for urban areas.
Table 3 also shows the effects of childhood disadvantage on mean levels of frailty
trajectories differ by female and male, which supports hypothesis 4. Inadequate access to health
care increases the mean level of frailty for female, however there exists no significant effects on
male. No schooling increases the mean level of frailty for male, but not for female. Being born in
level of frailty trajectories in birth place diverges in successive birth cohorts for female only and
no significant difference exists for male.
Table 3. Estimates of Childhood Disadvantage with Age Trajectories of Frailty by Residential Areas and Sex
Rural Urban Female Male
n=7,857 n=6,760 n=8,239 n=6,378
Fixed Effects
For Intercept
Intercept 0.362*** 0.464*** 0.532*** 0.401***
(0.039) (0.025) (0.028) (0.029)
Childhood disadvantage
Inadequate access to health care 0.021* 0.020 0.022* 0.012
(0.009) (0.011) (0.009) (0.011)
Poor nutrition 0.037*** 0.068*** 0.037*** 0.046**
(0.009) (0.012) (0.009) (0.015)
No schooling 0.044*** 0.056*** 0.009 0.027*
(0.011) (0.012) (0.013) (0.011)
Rural born 0.006 -0.057*** -0.057*** -0.033*
(0.023) (0.012) (0.013) (0.016)
Father in low SES -0.049 -0.041 -0.044 -0.025
(0.031) (0.023) (0.025) (0.027)
Cohort -0.042*** -0.059*** -0.064*** -0.047***
(0.007) (0.004) (0.005) (0.005)
Cohort × Childhood disadvantage
Cohort × Inadequate access to health care -0.002 -0.002 -0.002 -0.001
(0.002) (0.002) (0.002) (0.002)
Cohort × Poor nutrition -0.005** -0.010*** -0.005** -0.006*
(0.002) (0.002) (0.002) (0.003)
Cohort × No schooling -0.006*** -0.009*** -0.001 -0.002
(0.002) (0.002) (0.002) (0.002)
Cohort × Rural born -0.003 0.009*** 0.010*** 0.004
(0.004) (0.002) (0.003) (0.003)
Cohort × Father in low SES 0.007 0.009* 0.006 0.007
(0.005) (0.004) (0.005) (0.005)
For Linear Growth Rate
Intercept 0.092 0.372*** 0.186** 0.285***
(0.090) (0.066) (0.071) (0.064)
Childhood disadvantage
Inadequate access to health care -0.004 -0.003 0.008 -0.025
(0.021) (0.026) (0.024) (0.023)
Poor nutrition 0.193** -0.360*** -0.022 -0.013
(0.063) (0.078) (0.024) (0.033)
No schooling 0.037 0.008 0.034 0.020
(0.023) (0.027) (0.030) (0.025)
Rural born -0.044 -0.014 -0.057 0.006
(0.055) (0.028) (0.033) (0.031)
Father in low SES 0.042 -0.016 0.011 -0.025
(0.006) (0.007) (0.005) (0.006)
Cohort × Poor nutrition -0.027** 0.047*** - -
(0.011) (0.014) - -
For Quadratic Growth Rate
Intercept 0.021 0.219** 0.173** 0.044
(0.057) (0.068) (0.062) (0.059)
Covariates
Female 0.037*** 0.032*** - -
(0.005) (0.006) - -
Rural - - -0.023*** -0.020***
- - (0.004) (0.004)
Non-married (Married = 0) 0.006 -0.005 0.003 0.000
(0.004) (0.005) (0.005) (0.004)
Low occupations -0.003 -0.009 -0.001 -0.007
(0.010) (0.006) (0.011) (0.006)
Attrition
Died 0.034*** 0.036*** 0.037*** 0.031***
(0.005) (0.006) (0.006) (0.005)
Nonresponse 0.000 -0.000 0.001 -0.001
(0.006) (0.006) (0.006) (0.006)
Smoking 0.009* 0.000 0.010 -0.001
(0.004) (0.005) (0.006) (0.004)
Alcohol -0.008* -0.009 -0.013* -0.007
(0.004) (0.005) (0.005) (0.004)
Exercising -0.030*** -0.026*** -0.032*** -0.022***
(0.004) (0.004) (0.004) (0.004)
Random Effects - Variance Components
Level 1: Within person 0.157** 0.173** 0.154** 0.172**
Level 2: In intercept 0.098** 0.100** 0.091** 0.104**
In Growth Rate 0.043* 0.075* 0.053* 0.059*
Goodness of Fit
BIC -8702.8 -4750.1 -7677.6 -5934.9
Standard errors in parentheses
CONCLUSION AND DISCUSSION
This study investigates long-term effects of childhood disadvantage on late health
trajectories among children who were born in the turn of the twentieth century, and examines
whether these associations vary across birth cohorts. Using CLHLS 2002 to 2011, we find
childhood disadvantage is associated with elevated mean levels of frailty trajectories in late life.
Inadequate access to health care, no schooling and poor nutrition during childhood increase mean
levels of frailty trajectories, whereas being rural born and having father in low SES decrease
mean levels of frailty trajectories in late life. Frailty differentials in education and nutrition
converge in successive birth cohorts, but frailty differentials in birth place and father’s SES
reverse in successive birth cohorts. A crossover effect of birth place on frailty trajectories occurs
near 1920s. Being born in rural areas before 1920s is advantageous for late health outcomes,
being born in rural areas after 1920s is disadvantageous for later health, however. Similarly, a
cross-over trend also exists in the association between father’s SES and frailty trajectories across
birth cohorts. Having father in low SES is with lower mean levels of frailty trajectories for those
born before 1910s, whereas it increases mean levels of frailty trajectories for those born after
1910s. Rural subsample suggests that for early birth cohorts before 1920s, gap of age trajectories
of frailty in poor nutrition widens as ages, but the gap diminishes as ages for birth cohorts after
1930s. In contrast, urban subsample tells a different story that for early birth cohorts before 1925,
the gap of age trajectories of frailty diminished with ages, however, slightly widens as people
trajectories of frailty supports both cumulative (dis)advantage process and age-as-leveler
hypothesis in a cohort and institutional-dependent way for Chinese older population.
People of poor nutrition, inadequate health care and illiterate in childhood experience
increased levels of frailty index in late life, which is consistent with previous findings (Gu et al.,
2009; Huang & Elo, 2009). Being born in rural areas and having father in low SES decrease the
meaning levels of frailty in later life, which is inconsistent with most studies on birth cohorts.
Evidence from U.S. population, however, to some extent, supports the negative associations
among birth cohorts in the early twentieth century. Data from U.S. Census of 1900 and 1910
show that living on farm and having father working on farm had a greater postchildhood survival
chances (Preston et al., 1998). One may argue that farmers in U.S. was different from those in
China in early twentieth century considering their distinctive social status in different societies.
For instance, Chinese peasants were on the bottom of social ladders and hired as labors works for
landlord. Though our sample don’t allow us to distinguish peasants from landlord based on the
self-reported occupational status in analysis, it is noted that rural born children were less likely to
expose to polluted water, infectious diseases, shorter life expectancy than urban born
counterparts in early twentieth century in China (Campbell, 1997). This may explain that rural
born and having father in low SES tend to have healthier later life than others, particular for
earlier birth cohorts before 1920s. Results from urban subsample also support that being rural
born has a lower mean level of frailty trajectories than those born in urban areas in early
twentieth century.
Other studies using the same datasets have similar results and explain the differentials
due to selective mortality, arguing that rural born people can survive to old ages partially because
outcomes and survival probability over their whole life compared to urban counterparts (Shen &
Zeng, 2014). For the mortality selection, I argue the selection issue cannot fully interpret the
health disparities in birth place, because both rural and urban born people expose mortality
selection over their life. If life expectancy is a reliable indicator that reflects the sanitary
conditions in urban and rural areas in early twentieth century, urban born people are more likely
to be healthy elites than those rural born in their childhood. Whereas, considering the social
segregation occurred in their middle life, rural residence are more likely to be heathy elites than
urban residence. Selection trends are time-department across their life course. Without sufficient
evidence, we are unable to argue the mortality selection can fully interpret the health inequality
in later life.
We also find differentials of frailty trajectories in education and nutrition converge in
successive birth cohorts in the twentieth century. CLHLS data show that about 80 percent of
Chinese born before 1905 were illiterate. Among recent birth cohorts, percentage of people who
had schooling increased from 20 to 50 percent during 1910s to 1930s. The overall educational
level of Chinese was very low during that period. Only social elites and higher class people had
chances to go to school in early twentieth century of China. Health disparities between schooling
and no schooling were high in early birth cohorts, but decreased in successive birth cohorts. Two
reasons may contribute to the convergence: the history of public health before 1937 of China and
policy implication in 1950s. In the early twentieth century, China didn’t accept Western
medicine and Western public health concepts until very late around 1910s when the devastating
epidemic of pneumonic plague took 60,000 lives in China (Bowers, 1973). During the turn of the
twentieth century, prevalence of most infectious diseases and deaths were due to unclean water
To control the increasing prevalence of serious infectious diseases, construction of public health
programs was a major interest of the League of Nations since 1910s in China. During that period,
peasants, about ninety percentage of total population, cannot read in early twentieth century, it
was difficult for public health programs to research major percentage of people during that
period (Stampar, 1936). Therefore, education gaps made a great difference in accessing to public
health programs before 1937 (Bowers, 1973), which may explain the larger gap in health
disparities among early birth cohorts before 1920s. China experienced a phrase of hostilities and
civil war from 1937 to 1949. The initial public health program in 1910s was replaced by health
programs of Communist party in 1950s. The Chinese Communist Party (CCP)’s health policy
“Prevention first; serve workers, farmers, and soldiers; combine traditional and Western
medicine; mobilize the masses” effectively increased the life expectancy and improved public
health conditions and finally leveled the health disparities in 1950s. These two aspects may
interpret the gap of frailty trajectories in education and nutrition converge in successive birth
cohorts.
To interpret crossover effects of birth place on differentials in age trajectories of frailty
across birth cohorts, disparities in life expectancy and public health development in 1920s of
urban and rural China should be considered. In early twentieth century, densely populated cities
of China had greater prevalence of infectious diseases than rural areas, resulting into higher
mortality risk in cities than the countryside, as the cases of Europe in nineteenth century.
Cross-country comparisons show that life chances measured by average life expectancy at birth were
about 1.5 times better in countryside than that in larger towns in nineteen century (Woods, 2003).
In 1900s, Chinese people born in big cities have shorter life expectancy than those born in the
were limited. Studies using household registration records of a northern village in China have
estimated life expectancy at Age 6-10 was 37.2 for female and 43.8 for male in Daoyi village,
rural areas in Liaoning (North China) in late nineteenth century (Lee & Campbell, 2007). Cities
of high population density, such as Beijing, did not appear to be healthier places to live than the
countryside until improved water infrastructure, public health programs, and sanitation system
emerged in urban areas around 1920s (Campbell, 1997). Urban health care facilities and medical
training institutions, such as missionary hospitals, care agencies, Peking Union Medical College
(PUMC), developed dramatically through central, provincial and municipal authorities during the
decade from 1928 to 1937. However, rural areas received little attention in establishing modern
medicine and public health (Chen, 1989). During 1920s, the public health improvements in
urban areas of China increased the life expectancy, provided better living and housing
conditions, and decreased the risks of infectious diseases that benefited health conditions of
urban born population over the life course.
China’s rapid economic growth has increased total resource of a society and overall
Chinese people has gained better nutrition and health conditions than decades ago, however,
health disparities increase between rural and urban areas, which is partly due to resources that
determine health trajectories are not evenly distributed across social class, regions and birth
cohorts. Stratified sample by residential areas shows differentials in growth rate for age
trajectories of frailty in nutrition vary by birth cohorts for rural and urban areas. In rural areas,
gaps of age trajectories of frailty in nutrition diverge as ages among early birth cohorts (born
before 1914), whereas gaps of age trajectories of frailty in nutrition converge as age among
recent birth cohorts (born after 1930). However, in urban areas, these trends are opposite. We
in light of China’s historical and institutional contexts such as household registration (Hukou)
system, considerably distinct institutional arrangements and distributional channels in rural and
urban areas, increased socioeconomic inequality and changing social stratification during the
Chinese reform era. Post Mao’s reform started in rural areas in 1978 provided peasant household
opportunities to free from their land and increase household income from nonagricultural
business activities (Bian, 2002; Nee, 1989). Recent birth cohorts (born after 1930) benefit more
in social and medical source from market reform of 1970s than early birth cohorts (born before
1914), because the timing of economic reform occurred at 40 to 50 years old of recent birth
cohorts, which allow them more involved and benefit from this economic transitions around
1980s. In addition, the universal health care system in late 1970s may level the health disparities
related to early childhood conditions. Our findings, converging effects of childhood poor
nutrition on late health trajectories, can support that, during late 1970s and early 1980s, the
growth household income and universal health care system buffered the long-term adverse
effects of poor nutrition on later health outcomes among younger birth cohorts within rural areas
(Nee, 1989), whereas the childhood nutrition attainments still matters the late health trajectories
for early birth cohorts and the effect cumulate as ages in rural China. The findings from early
birth cohorts in rural areas support the cumulative disadvantage hypothesis that the effects of
childhood disadvantage on health increase with age. For urban areas, however, differentials of
health trajectories in nutrition tell a different story.
Studies show that income inequality declines slightly at the first decade of economic
reform era but dramatically increases in subsequent years in major cities of China (Bian &
Logan, 1996). Political control in term of Communist party and work units have significant
medical insurance during early stage of economic transition, which may contribute to converging
health disparity in late life. As market oriented reform became dominant in late 1990s, the
significance of work units and the rank of state ownership declined (Bian & Logan, 1996).
Previous public medical service paid by work units and state ownership gradually became
difficult to maintain during 1990s. Younger birth cohorts (born after 1930s) are more vulnerable to “out of pocket” medical care than early birth cohorts, which leads to increasing health
disparities in later life for urban elderly (Liu, Hsiao, & Eggleston, 1999). The diverging gap of
age trajectories of frailty in nutrition for younger birth cohorts reflects the impact of social
changes in late 1990s on the health outcomes of urban elderly. Overall, in urban areas,
converging health gaps among early birth cohorts support “age-as-leveler” hypothesis that long
term effects of childhood disadvantage (poor nutrition) on health disparities decline as ages in
late life. For younger birth cohorts, the impacts of economic transitions exert addictive gains or
losses on health outcomes for urban elderly in their late lives, which supports cumulative
(dis)advantage hypothesis.
Our study has limitations. Less than 10 percent of respondents survive throughout the 10
year observation period (see Figure S1). The cumulative impacts of childhood conditions on
health are influenced by premature mortality that people in low SES and/or in poor health are
more likely to die early than others. The heterogeneity of mortality decreases as ages, for people
who survive tend to have higher SES and good health. Potential mortality selection, on the other
hand, underestimates effects of childhood disadvantage on late life health trajectories. Second,
since adult SES may influence the trajectories of frailty in old age as much or even more than
childhood conditions, limited information about adulthood don’t allow us to sufficiently examine