THE ROLE OF OCCUPATIONAL EXPOSURE TO ANIMAL PRODUCTION IN CHRONIC OBSTRUCTIVE PULMONARY DISEASE AMONG FARMERS
IN IOWA AND NORTH CAROLINA
Jessica L. Rinsky
A dissertation submitted to the faculty of the University of North Carolina at Chapel Hill in partial fulfillment of the requirements for the degree of Doctor of Philosophy in the Department
of Epidemiology.
Chapel Hill 2015
Approved by: Steve Wing David Richardson Jane Hoppin Kathleen Kreiss
iii
ABSTRACT
Jessica L. Rinsky: The role of occupational exposure to animal production in chronic obstructive pulmonary disease among farmers in Iowa and North Carolina
(Under the direction of Steve Wing)
Individuals who work in animal production may be exposed to respiratory hazards including high concentrations of organic dust, gases, and chemicals. Long-term, chronic inhalation of these agents may contribute to risk of chronic obstructive pulmonary disease (COPD). I examined the association between work in animal production, including the use of insecticides, and the prevalence of COPD diagnosis and chronic bronchitis symptoms among 22,721 farmers who enrolled in the Agricultural Health Study (AHS) (1993-1997) and participated in the 2005-2010 interview. I also assessed the impact of restricting analysis to participants of the 2005-2010 interview.
To assess the impact of restriction, predictors of participation in the 2005-2010 interview were identified, example exposure-outcome associations estimated in the enrollment and 2005-2010 cohorts were compared, and the utility of inverse probability of selection weights (IPSW) to correct for selection bias was considered. Participation was related to age, state, race/ethnicity, education, marital status, smoking, and alcohol consumption. In example analyses, when case participation was differential with respect to exposure, estimates were biased; IPSW conditional on exposure and covariates failed to fully correct estimates. When participation was
iv
Using log binomial regression and inverse probability of exposure weights to address confounding, I estimated the association between animal production, insecticide use and COPD diagnosis and symptoms. Raising beef cattle, hogs, or poultry was associated with greater prevalence of chronic bronchitis symptoms. Farmers with medium/large animal operations had 1.51 (95% CI: 1.21, 1.89) times the prevalence of chronic bronchitis symptoms than those raising no animals. Applying insecticides to livestock and use of coumaphos, diazinon, dichlorvos, malathion, parathion, carbaryl, and permethrin were also associated with greater prevalence of chronic bronchitis. Personal use of diazinon and trichlorfon were associated with a greater prevalence of COPD diagnosis.
v
ACKNOWLEDGEMENTS
I am grateful for the support, guidance, and direction that I received during the
dissertation process. First, I would like to thank Dr. Steve Wing for his patience, compassion, unwavering commitment to public health, and his dedication to students. During my time at UNC he has reminded me of the importance of critical thinking, clear writing, and standing up for what is right. I would also like to thank Dr. David Richardson who has given me countless hours of advice about epidemiologic research and teaching. I am grateful to Dr. Jane Hoppin who has been a supportive collaborator on this project and others. I greatly appreciate the encouragement and advice provided by Drs. Leena Nylander-French and Kathleen Kreiss throughout this process.
When I began this process Ghassan Hamra, Leah Schinasi, and Jessie Buckley were my teachers; through collaborations and many coffee breaks they taught me about epidemiology, provided unending support, and elevated me to colleague. Laurel Harduar Morano, John Beard, Alan Kinlaw, Nadya Belenky, Jill Lebov, Chris Gray, Cathy Panozzo, Jonathan Todd, and Sabrina Zadrozny, provided invaluable feedback on this dissertation and always encouraged me to keep going. I would not have made it to UNC without Anna Barry Cope and so, without her, this document would not exist. I would also like to thank the members of the Rural
vi
vii
TABLE OF CONTENTS
LIST OF TABLES ... x
LIST OF FIGURES ... xii
LIST OF ABBREVIATIONS ... xiii
CHAPTER 1. SPECIFIC AIMS ... 1
CHAPTER 2. BACKGROUND ... 4
History of animal production ... 4
Occupational exposures in animal production ... 4
Regulation of exposures relevant to human respiratory health ... 6
Respiratory health effects from occupational exposure to animal production ... 6
Chronic obstructive pulmonary disease ... 7
Challenges in Diagnosing COPD for Research Purposes ... 8
Epidemiology of COPD ... 10
Occupational exposures and COPD ... 11
Occupational exposure to animal production and COPD ... 12
Strengths and limitations of previous work ... 14
viii
Selective participation: A methodological challenge ... 14
Tables ... 17
CHAPTER 3. NON-PARTICIPATION IN A STUDY FOLLOW-UP INTERVIEW AND SELECTION BIAS: AN EXAMPLE FROM THE AGRICULTURAL HEALTH STUDY ... 19
Introduction ... 19
Methods ... 20
Results ... 26
Discussion ... 29
Figures and Tables ... 36
CHAPTER 4. ANIMAL PRODUCTION AND CHRONIC OBSTRUCTIVE PULMONARY DISEASE AMONG PRIVATE PESTICIDE APPLICATORS ... 50
Introduction ... 50
Methods ... 51
Results ... 60
Discussion ... 62
Figures and Tables ... 71
CHAPTER 5. DISCUSSION ... 83
Background ... 83
ix
Impact of findings ... 85
Animal production & COPD ... 87
Impact of findings ... 89
Conclusions ... 93
x
LIST OF TABLES
Table
2.1 Organophosphate, carbamate, and pyrethroid insecticides and the
year first registered for use in the United States………17 2.2 Regulatory limits and recommendations for workplace exposure to
dust, endotoxin, and gases………. 18 3.1 Associations between demographic and lifestyle variables reported
at enrollment (1993-1997) and participation in the 2005-2010
interview among 52,394 farmers, Agricultural Health Study……… 40 3.2 Associations between diagnosed medical conditions measured at
enrollment (1993-1997) and participation in the 2005-2010 interview
among 52,394 farmers, Agricultural Health Study……… 41 3.3 Associations between pesticide use variables reported at enrollment
(1993-1997) and participation in the 2005-2010 interview among
52,394 farmers, Agricultural Health Study……… 43 3.4 Associations between farming characteristics measured at enrollment
(1993-1997) and participation in the 2005-2010 interview among
52,394 farmers, Agricultural Health Study……… 44 3.5 Associations between ever smoking (E) reported at enrollment
(1993-1997); incident lung, bladder, and prostate cancer (D) obtained from state cancer registries and participation (S) in the 2005-2010
interview among 52,394 farmers, Agricultural Health Study………... 46 3.6 Joint distribution of ever smoking and 1) incident lung cancer;
2) incident bladder cancer; and, 3) incident prostate cancer among the full cohort (N = 52,394) and the sub-cohort of farmers participating in
the 2005-2010 interview (N = 24,171)……….. 48 3.7 Distribution of stabilized inverse probability of exposure and selection
weights applied to analyses of the association between ever smoking and 1) incident lung cancer; 2) incident bladder cancer; and, 3) incident
prostate cancer………... 49 4.1 Insecticides of chemical classes registered for use on or around animals………... 73 4.2 Associations between selected characteristics and COPD diagnosis and
chronic bronchitis symptoms among 22,721 farmers participating in the
xi
4.3 Associations between raising animals and COPD diagnosis and chronic bronchitis symptoms among 22,721 farmers participating in the 2005-2010
interview, Agricultural Health Study………... 76 4.4 Associations between ever use of selected insecticides and COPD
diagnosis and chronic bronchitis symptoms among 22,721 farmers
participating in the 2005-2010 interview, Agricultural Health Study……….. 77 4.5 Associations between categories of lifetime days of use of selected
insecticides and COPD diagnosis and chronic bronchitis symptoms among 22,721 farmers participating in the 2005-2010 interview,
Agricultural Health Study……….…. 79 S4.1 Distribution of stabilized IPEW used to estimate associations between
specific animal production activities and COPD diagnoses and chronic
xii
LIST OF FIGURES
Figure
3.1 Directed acyclic graphs illustrating the associations between ever smoking (E), the cancer outcome of interest (D), a vector of covariates (Z), and selection (S) among 24,171 farmers who participated in the 2005-2010 interview. The three associations depicted are ever
smoking and A) incident lung cancer; B) incident bladder cancer; and, C) incident prostate cancer. Dotted lines indicated associations induced by conditioning on selection (a collider). + signs indicate the strength of
the association between E, D, and Z.……….……… 36 3.2 Description of participation and non-participation in the 2005-2010
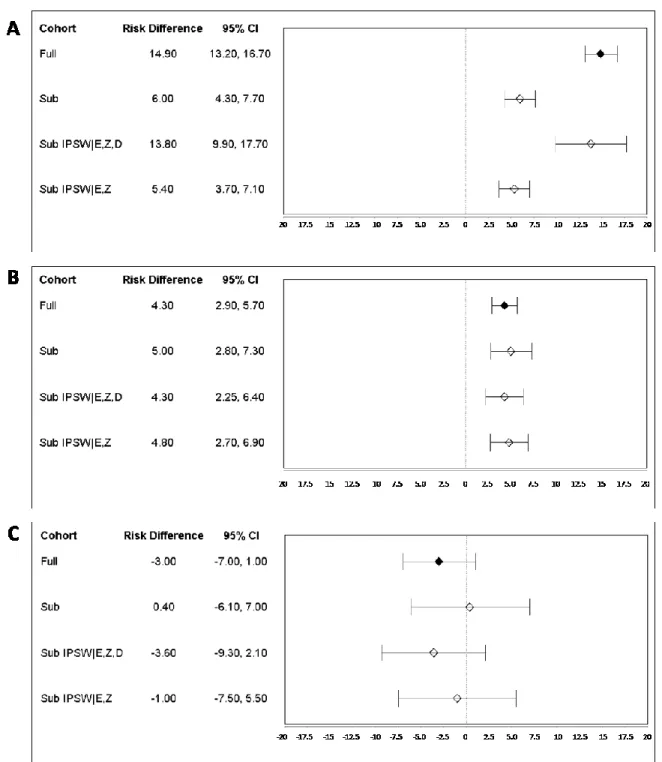
interview, Agricultural Health Study……… 37 3.3 Standardized risk ratios (95% CI) indicating associations between ever
smoking and A) incident lung cancer; B) incident bladder cancer; and, C) incident prostate cancer among 52,394 farmers present at enrollment
and the sub-cohort of 24,171 farmers participating in the 2005-2010 interview………...38 3.4 Standardized risk differences/1,000 persons (95% CI) indicating
associations between ever smoking and A) incident lung cancer; B) incident bladder cancer; and, C) incident prostate cancer among 52,394 farmers present at enrollment and among the sub-cohort of
24,171 farmers participating in the 2005-2010 interview………..39 4.1 Illustration of the collection of exposure data and the timing of
exposure information recorded at each interview. Lifetime ever use of all organophosphate insecticides, carbaryl, and permethrin was assessed on the enrollment questionnaire. Years and days of use of the following insecticides were assessed on the enrollment questionnaire: chlorpyrifos, coumaphos, dichlorvos, phorate, fonofos, terbufos, trichlorfon, and permethrin; and, on the take-home questionnaire: diazinon, malathion, parathion, and carbaryl. Ever use and years and days of use for all insecticides were reported in as part of the 1999-2003 and 2005-2010
interviews………... 71 4.2 Distribution of diagnosis of COPD (including chronic bronchitis,
emphysema, and COPD) and report of symptoms meeting the clinical definition of chronic bronchitis (cough and phlegm for at least three month over two consecutive years) among farmers participating in the
xiii
LIST OF ABBREVIATIONS
ACGIH American Conference of Industrial Hygienists AFO Animal feeding operation
AHS Agricultural Health Study ATS American Thoracic Society
CAFO Confined animal feeding operation CATI Computer assisted telephone interview CI Confidence interval
COPD Chronic obstructive pulmonary disease DAG Directed acyclic graph
EPA Environmental Protection Agency
EU Endotoxin unit
FEV1 Forced expiratory volume in 1 second FVC Forced vital capacity
GOLD Global Initiative for Chronic Obstructive Lung Disease IPEW Inverse probability of exposure weights
IPSW Inverse probability of selection weights IRB Institutional Review Board
NHANES National Health and Nutrition Examination Survey NIOSH National Institute of Occupational Safety and Health
OR Odds ratio
xiv PR Prevalence ratio
RD Risk difference
REL Recommended exposure limit
RR Risk ratio
RUP Restricted use pesticide
SE Standard error
1
CHAPTER 1. SPECIFIC AIMS
Food animal production has become increasingly industrialized during the past several decades [1]. Industrial animal production facilities rely on confinement and heavy inputs to produce large numbers of animals on limited land [2]. As a result, individuals working in or around animal production facilities may be exposed to high concentrations of particulates, gases, and chemicals [2-13]. Chronic inhalation of these agents has been linked with short-term decline in respiratory function [3, 5, 14-20], symptoms of respiratory irritation [4, 5, 8, 16, 19, 21-23], and increased risk of certain respiratory conditions [14, 19].
Chronic obstructive pulmonary disease (COPD) is a disease process caused by an
inflammatory response to inhalation of noxious particles [24]. Globally and domestically, COPD (ICD-10 codes J40-J44) [25], is a major cause of morbidity and mortality [24, 26-29]. Although a large proportion of COPD is attributable to smoking [24], occupational exposures may play an important role in disease pathogenesis [9, 10, 12, 13, 24, 30-33]. Studies of agricultural workers have noted similar or increased prevalence of COPD-related conditions and symptoms (i.e. chronic bronchitis, chronic cough and phlegm) as compared to the general public [3, 4, 8-10, 12, 13, 15, 32, 34-36], despite lower rates of smoking [37, 38]. Among agricultural workers, those working in industrial animal production appear to experience some of the highest burdens of COPD-related symptoms [13, 21, 32, 39].
2
from the United States has relied on large administrative databases lacking detailed exposure and covariate information, or small samples of farmers and farmworkers, which lack the ability to examine potentially important modifying factors [9, 13-15].
The Agricultural Health Study (AHS) [41, 42] provides a unique opportunity to examine the association between animal production work and the prevalence of COPD among a large population of farmers. Farmers enrolled in the AHS produce animals on small and large operations allowing for consideration of exposure to the full spectrum of animal production. Although the AHS provides this opportunity, approximately 54% of farmers did not participate in a follow-up interview conducted between 2005 and 2010, approximately 12-years after study enrollment. Only those who participated in the 2005-2010 interview were able to report
information about the onset of COPD-related symptoms and diagnoses.
To examine the association between work in animal production and COPD among the farmers in the AHS, I addressed the following aims:
Aim 1: Evaluate the potential for attrition to bias effect estimates estimated from farmers participating in the 2005-2010 interview of the Agricultural Health Study.
1a: Identify a set of enrollment characteristics predictive of and strongly associated with participation
1b: Quantify the range of bias affecting effect estimates due to selective participation in a follow-up interview under conditions relevant to analysis of the association between work in animal production and COPD.
3
Hypothesis: Demographic, behavioral, medical history, and agricultural characteristics
reported at enrollment will be predictive of participation in the 2005-2010 interview. Some bias due to selective participation may be present in analyses restricted to farmers who participated in the 2005-2010 interview. However, because selective participation will be predicted by measured enrollment variables, inverse probability of selection weights will reduce the magnitude of bias.
Aim 2: Quantify the association between work in animal production and the prevalence of COPD among AHS farmers.
2a. Quantify the association between type and number of animals raised and COPD.
2b. Quantify the association between personal use of chemical classes of insecticides registered for use on or around animals and COPD.
4
CHAPTER 2. BACKGROUND History of animal production
Traditionally, food animals were raised outdoors on diversified farms. Since the mid-20th century, methods of animal production have undergone substantial changes. The number of small farms with diverse production of many animal species has decreased while operations which specialize in the production of large numbers of one species of animal have increased [43]. The term industrial animal production (North American Industrial Classification System code: 112 [44] ) is used to describe these large-scale operations that often rely on the confinement of animals in factory-like buildings and increased use of inputs including chemicals (e.g., pesticides and cleaning agents), antibiotics, food, and water to produce large numbers of animals on limited land [1, 2, 9, 39, 45-47]. In the United States, these industrial operations, referred to as animal feeding operations (AFOs), produce a large proportion of livestock and poultry used for meat, dairy products and eggs [45, 48]. There are currently an estimated 450,000 AFOs in the United States. Iowa and North Carolina are two of the top producing states for swine and poultry [49].
Occupational exposures in animal production
5
particles of animal feed, dander, urine, and feces. One component of organic dust particularly important to respiratory disease is endotoxins, or lipopolysaccharide complexes from the cell walls of gram-negative bacteria [50]. Many gases are found in the animal production
environment including ammonia, hydrogen sulfide, methane, carbon dioxide, and carbon
monoxide along with other odorants and volatile organic compounds [51-57]. Chemicals present in the animal production environment include pesticides (mainly insecticides) and cleaning agents. Insecticides are used to control insects including cockroaches, flies, and external parasites on animals (e.g., mites, lice) [58, 59]. Historically, organophosphate,
pyrethroid/pyrethrin, and carbamate insecticides [58, 60] have been the most common types used in animal production. Table 1 provides a list of insecticides belonging to these chemical classes along with the year each was first registered for use in the United States. Recently use of
pyrethroids/pyrethrins has increased to compensate for a decline in use of organophosphates, which are more acutely toxic to birds and mammals [60]. Insecticides used in animal production come in different forms including sprays, dusts, dips, granules, tags, and pours [61, 62]. Each of these formulations has different implications for human respiratory and skin exposure. In
addition to insecticides, disinfectants containing chloramine-T or quaternary ammonium compounds alone or in combination with aldehydes [13, 52] are also used.
6
Regulation of exposures relevant to human respiratory health
Some of the agents present in the animal production environment are regulated in workplaces by the Occupational Safety and Health Administration (OSHA), and agencies including the National Institute of Occupational Safety and Health (NIOSH), and the American Conference of Industrial Hygienists (ACGIH) have set recommendations on exposure limits (Table 2). However, OSHA enforcement does not apply to family farmers. In addition, animal production facilities often have a small number of employees, and employers with 10 employees or fewer during a calendar year are not typically required to keep OSHA injury or illness records [64]. Many of the insecticides used in industrial animal production are designated restricted use pesticides (RUP) and therefore their sale is regulated by the US Environmental Protection Agency [65]. This classification requires that the substance only be used by, or under the supervision of, a certified pesticide applicator.
Previous work has documented concentrations of dust, gases, and endotoxin in industrial swine [5, 16-18, 23, 57, 66-77], poultry [66, 69, 78, 79], and dairy operations [56, 69].
Concentrations vary widely and, at times, exceed recommended exposure levels.
Respiratory health effects from occupational exposure to animal production
Inhalation of the agents present in the animal production environment is known to result in an inflammatory response in the airways and lungs [39, 80, 81]. Personal exposure to
insecticides outside of the animal production environment has also been linked with
7
phlegm, chronic bronchitis, asthma, wheeze, and organic dust toxic syndrome [10, 13, 85]. Long-term, chronic inhalation of the agents present in the animal production environment has the potential to result in a chronic inflammatory response in the airways and lungs manifesting as COPD. However, the association between work in animal production and COPD remains largely unexplored.
Chronic obstructive pulmonary disease
COPD is a broad term that refers to a collection of conditions responsible for irreversible airflow limitation [24, 86]. The Global Initiative for Chronic Obstructive Lung Disease (GOLD) defines COPD as a disease state “characterized by persistent airflow limitation that is usually progressive and associated with an enhanced chronic inflammatory response in the airways and the lung to noxious particles or gases” [87, 88]. Chronic bronchitis and emphysema are two conditions included under the term COPD. Chronic bronchitis is defined on the basis of clinical presentation of the presence of cough and sputum production for at least three months in each of two consecutive years [88]. This clinical presentation is due to hypersecretion of mucus in the large airways [24]. Emphysema is defined morphologically as “an abnormal permanent enlargement of air spaces distal to terminal bronchioles, accompanied by destruction of their walls without obvious fibrosis” [89]. The term COPD may also be used to refer to other
conditions such as constrictive bronchiolitis (a fibrotic disease of the small airways) [24, 90], and other causes of non-reversible airway obstruction.
8
and the innate immune system [92]. However, when the defense system is overwhelmed or fails, a disease process may begin. Because of the strong defense mechanism of the respiratory system, long-term exposure to agents is usually required for the development of COPD [88, 93] although high peak exposures may play a role in hastening the onset of symptoms or exacerbating the condition [88].
The inflammatory response to the presence of inhaled particles causes direct destruction of lung tissues and impairment of the defense mechanisms, which usually repair damaged tissue, leading to inflammation and manifestation of COPD symptoms [94]. A range of inflammatory cells are involved with neutrophils, macrophages, and CD8+ T cells predominating [94]. Neutrophils and macrophages release proteases, disrupting the balance of proteases and antiproteases in the lung leading to increased proteolysis. Oxidative stress and inflammatory mediators also play a role in the pathogenesis of COPD [88]. This inflammatory response leads to destruction in the lung parenchyma, characteristic of emphysema, and mucus hypersecretion and cilliary disfunction, characteristic of chronic bronchitis. Destruction of air spaces and mucus hypersecretion lead to airflow limitation and air trapping, gas-exchange abnormalities, and changes in the pulmonary vasculature [88]. These occurrences in the lungs have both local and systemic manifestations [89]. Genetic or host factors must also play a role as not all individuals exposed to respiratory irritants develop disease [94].
Challenges in Diagnosing COPD for Research Purposes
9
populations, especially studies spread over a wide geographic area or reliant on mail or telephone contact with participants in order to reduce burden of participation [95]. Consequently,
alternatives for identifying cases of COPD are necessary for research. Spirometry has been recommended to provide an objective, standardized and simplified approach to ascertaining cases of airway obstruction, and some studies have relied solely on this diagnostic approach [96, 97]. However, spirometry still requires in-person assessment of study participants by trained staff. Spirometric results also lead to wide variation in disease estimates depending on the population and how disease definitions are applied. For example, in a study of National Health and Nutrition Examination Survey (NHANES) participants (2007-2010), the prevalence of COPD ranged from 10-21% depending on the criteria applied to spirometric results [97].
10
Ascertainment of COPD cases in epidemiologic studies is imperfect whether spirometric measures of obstruction or self-report of diagnoses are used. Self-reported doctor diagnosis may lead to some false-positive reports of diagnoses due to attribution of symptoms to a diagnosis by the participant themselves or misdiagnosis. However, when relying on self-report,
under-reporting of COPD may be more likely [95, 98]. Incorporation of self-reported information on symptoms used to define chronic bronchitis in a physician’s office (e.g., chronic cough and phlegm for more than 3 months over two consecutive years) may aid in reducing the number of false-negatives.
Epidemiology of COPD
The domestic and global burden of COPD is large and is continuing to grow [87, 88]. COPD is the third leading cause of death in the United States and is expected to be the third leading cause of death globally by 2030 [86, 88]. The impact of COPD-related morbidity is also large. In the United States during 2010, approximately 10.3 million physician office visits, 1.5 million emergency room visits, and 699,000 hospital discharges were attributed to COPD or its complications [26]. In 2008, the direct costs attributed to COPD were more than $50 billion [26]. In addition, disability and impaired quality of life resulting from COPD add to the high social costs of the condition [27].
The prevalence of COPD is difficult to determine as it varies greatly based on disease definition, method of measurement, and population under study. In the United States, estimates range between 5-7% of the general population reporting a physician diagnosis of COPD [26, 29, 99]. Estimates based on spirometry range between 10-20% [97].
11
or were smokers [86]. Many of the other risk factors for COPD influence disease risk through smoking. Older age, male gender, white race, low education and socio-economic status, and poor diet and obesity are associated with increased risk of COPD [26, 28, 29, 86, 87, 97, 100, 101]. In addition, specific genetic mutations, asthma and other airway disease, and perinatal events and childhood respiratory illness are also positively associated with risk of COPD [86]. Recently, more attention has been paid to environmental pollution and occupational exposures as risk factors [24, 31, 86, 98, 102-113].
Occupational exposures have been identified as important in the etiology of many of the underlying conditions and symptoms of COPD since the 19th century [98, 112]. However, occupational exposures remain somewhat unexplored due to an emphasis on smoking as the most influential risk factor. In addition, the dominance of more traditional occupational respiratory diseases such as pneumoconiosis has also led to little focus of research on occupational risk factors for COPD [108, 111].
Occupational exposures and COPD
In 2003, the American Thoracic Society (ATS) released a statement and review of the literature on the association between occupational exposures and COPD [108, 109]. The statement and several studies published since indicate that among US adults the attributable fraction of COPD due to occupational exposures is 15-20% [31, 98, 106, 108, 109]. This
estimate may also be as high as 30% for never smokers [31]. Agriculture is one of the industries that is recognized as having a high burden of COPD [31, 108, 109, 114]. And, within the
12
Occupational exposure to animal production and COPD
In 2004, Monso et al. reported the prevalence of COPD among a sample of 105 non-smoking animal confinement workers from Denmark, Germany, Switzerland, and Spain [14]. Using spirometry and the GOLD criteria, COPD was identified in 18 workers (17%). The prevalence of COPD was associated with increasing levels of dust exposure. This study was small and could not stratify results by the type of animal produced. To my knowledge, no other studies have explicitly examined the burden of COPD among animal production facility
owner/operators or workers.
Previous work has examined the burden of COPD-related symptoms and chronic bronchitis among animal production facility owner/operators and workers. Most research has focused on work in industrial swine or poultry production and industrial and non-industrial dairies. The prevalence of chronic bronchitis reported in these studies ranges between 8 and 46% depending on the animal produced (swine, poultry, dairy) and whether study participants were farm owner/operators or workers. Prevalence of chronic cough (10-57%), chronic phlegm (5-58%), and shortness of breath (9-32%) varied similarly [5, 8, 19, 20, 23, 73, 115-127].
13
observed increased prevalence of respiratory symptoms (cough, dyspnea), chronic bronchitis, and COPD among Indian farmers using organophosphate and carbamate insecticides as compared to controls [130]. Although the population was fairly young (median age: 40 years; range: 25-53), COPD was diagnosed (using GOLD criteria) in 18% of the agricultural workers compared with 7% of the comparison group.
Most of the research examining the association between use of specific insecticides and COPD-related symptoms and conditions among farming populations has been completed within the AHS [131-134]. Researchers have reported statistically significant associations between ever use of insecticides (carbaryl, carbofuran, DDT, heptachlor, diazinon, malathion, and permethrin for crops), lifetime days of use (carbaryl, DDT, dichlorvos, malathion, and permethrin used on crops), and increased odds of a self-reported doctor diagnosis of chronic bronchitis [133].
A limited number of studies have explicitly considered the effect of joint exposure to animals and insecticides. Using information from the Iowa Farm Family Health Study, Sprince et al. reported that persons who apply pesticides to livestock had significantly increased odds of phlegm (1.9; 95% CI: 1.02, 3.57) as compared to those who did not apply pesticides to livestock after adjusting for smoking [135]. In the AHS, Hoppin et al. (2007) found that pesticide
14
Strengths and limitations of previous work
Previous work has provided firm evidence that work in animal production may contribute to the global burden of COPD. However, only one previous investigation has been focused on the association between work in animal production and COPD specifically. Research examining the prevalence of respiratory symptoms or airway obstruction has mainly been conducted in Europe and therefore may not reflect the methods of animal production used or the distribution of COPD in the United States. Most of these studies have been cross-sectional and consequently may not include farmers that have left work due to respiratory illness. Finally, previous work conducted in the United States has been conducted using either large, administrative databases with little information on personal exposures and covariates or small samples with detailed personal exposure or disease information. Both of these designs prohibit consideration of joint exposure effects and modification by smoking and other potentially important contributing factors.
The Agricultural Health Study: A Unique Opportunity
The AHS provides a unique opportunity to examine the role of work in animal production in the etiology of COPD among a large cohort of farmers followed over a median 12 years. AHS participants come from two major animal producing states and include small, traditional farms as well as large, industrial farms.
Selective participation: A methodological challenge
15
had poorer health behaviors but fewer diagnosed medical conditions than participants [136]. Non-participants also had lower reported pesticide use overall but some variation existed between farmers in North Carolina and Iowa. As part of this analysis, investigators estimated odds ratios using the full cohort and the cohort of farmers who participated in the 1999-2003 interview for 1) use of chlorpyrifos and depression reported at enrollment; 2) smoking and chronic lung disease reported at enrollment; and, 3) smoking and incident cancer [136]. Odds ratios estimated from interview participants for each exposure-outcome association were similar to those from the cohort present at enrollment.
The next interview (2005-2010) occurred roughly 12 years (range: 8-16 years) after study enrollment. This interview included questions about respiratory diagnoses and symptoms that were not included on questionnaires used at enrollment or during the previous interview.
Approximately 46% of enrolled farmers participated in the 2005-2010 interview [137]. Farmers who did not participate are missing information about COPD.
Loss to follow-up has become a frequently discussed problem for large cohort studies, especially those following older populations over a lengthy period [138, 139]. The most common approach to handle loss is to restrict analyses to those with complete information. The effects of restriction on estimates of disease occurrence and exposure-disease associations has been
16
Characterizing attrition by identifying how study variables relate to participation can help conceptualize the extent of bias and precision loss that may result from restricting analysis to those who remain under study [144]. As previously demonstrated through simulation studies [140, 141, 149] and the application of DAG theory [144, 145, 150], bias can occur if attrition is related to the exposure and outcome under study, or to factors related to both the exposure and outcome. As approximately 54% of the original cohort of farmers was not able to report
17
Tables
Table 2.1. Organophosphate, pyrethroid, and carbamate insecticides and the year first registered for use in the United States [151-153]. Partially reproduced from Hoppin et al. (2012) [151].
Organophosphates Registration Pyrethroids Registration
Chlorpyrifos 1965 Allethrin 1981
Coumaphos 1958 Bifenthrin 1985
Diazinon 1948 Cyfluthrin 1987
Dichlorvos 1948 Cyhalothrin 1988
Fonofos 1967 Cypermethrin 1984
Malathion 1955 Deltamethrin 1994
Parathion 1954 Esfenvalerate 1973
Phorate 1959 Fenpropathrin 1989
Terbufos 1974 Fluvalinate 1988
Permethrin 1977
Carbamates Registration Resmethrin 1967
Carbaryl 1947 Tefluthrin 1989
Tetramethrin 1968
18
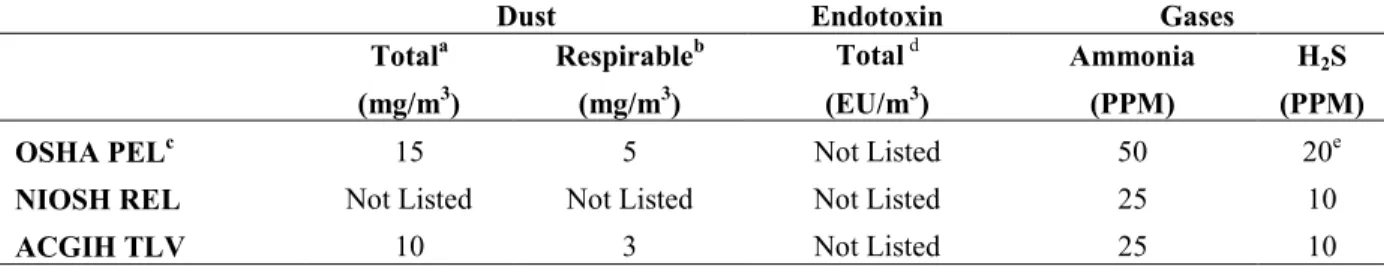
Table 2.2. Regulatory limits and recommendations for workplace exposure to dust, endotoxin, and gases.
Dust Endotoxin Gases
Totala Respirableb Total d Ammonia H2S
(mg/m3) (mg/m3) (EU/m3) (PPM) (PPM)
OSHA PELc 15 5 Not Listed 50 20e
NIOSH REL Not Listed Not Listed Not Listed 25 10
ACGIH TLV 10 3 Not Listed 25 10
OSHA = Occupational Safety and Health Administration PEL = permissible exposure limit
NIOSH = National Institute for Occupational Safety and Health REL = recommended exposure limit
ACGIH = American Conference of Industrial Hygienists TLV = threshold limit value
a Total dust includes all airborne particles, regardless of their size or composition [154].
b Respirable dust refers to dust particles that are small enough to penetrate the nose and upper respiratory system
and deep into the lungs (< 10 µm) [154].
c Based on an 8-hour time weighted average (TWA) exposure
d Although no OSHA PEL or NIOSH REL is listed, other countries have suggested limits. The Netherlands
recommends a health-based exposure limit of 50 Endotoxin units (EU)/m3. Researchers in the United States
have recommended a human-health based limit of 100 EU/m3 [155].
e Exposures shall not exceed 20 ppm (ceiling) with the following exception: if no other measurable exposure
19
CHAPTER 3.
NON-PARTICIPATION IN A STUDY FOLLOW-UP INTERVIEW AND SELECTION BIAS: AN EXAMPLE FROM THE AGRICULTURAL HEALTH STUDY
Introduction
Prospective cohort studies are important tools for identifying preventable causes of disease [157-159]. However, studies that follow participants over time are susceptible to attrition, including loss to follow-up and death [140, 141, 159-161]. If analyses are limited to participants who remain under study, attrition may result in biased measures of disease occurrence or exposure-disease associations [140, 150, 159]. As previously demonstrated through simulation studies [140, 141, 149] and the application of DAG theory [144, 145, 150], bias can occur if attrition is related to both the exposure and outcome under study, or to factors related to both the exposure and outcome. Therefore, identification of factors related to attrition can help evaluate the potential for bias in studies using data collected only through study visits or interviews.
20
The AHS is a longitudinal cohort study that enrolled 52,394 private pesticide applicators, hereafter “farmers,” who applied for restricted use pesticide licenses in Iowa and North Carolina between 1993 and 1997 [41, 42]. The AHS was designed to evaluate the potential health effects of farming-related exposures among pesticide applicators and their spouses [41]. Cancer
incidence, mortality, and end-stage renal disease are obtained through linkage with state and federal sources [41, 164] and, therefore, analyses of exposures measured at enrollment and these outcomes are unaffected by attrition. Since enrollment, information on specific farming activities and other health outcomes is collected at interviews occurring approximately every five years. In the second interview, occurring between 2005 and 2010, information about lifestyle, specific farming activities, and incident disease was collected. Approximately 46% of farmers enrolled in the AHS responded to this interview (60% of those contacted) presenting a potential challenge for evaluating exposures or incident disease self-reported at this interview. Here, I identify characteristics associated with participation in the 2005-2010 interview, evaluate the extent to which attrition may influence results from analyses restricted to interview participants, and consider the utility of inverse probability of selection weights to correct for selection bias in studies of incident outcomes reported by participants during follow-up interviews.
Methods
21
Another interview was conducted between 2005 and 2010. At this time, farmers were asked to provide updated information on lifestyle and farming activities, and to report a range of incident medical conditions. Reasons for non-participation in this interview have been described previously [137]. Briefly, three groups of farmers were not contacted for this interview: 1) farmers who refused further contact prior to the interview; 2) farmers who died prior to interview identified through linkage with state mortality records and the National Death Index [41]; and, 3) farmers who were administratively excluded because of non-participation in study activities since enrollment, pilot testing of materials, and other reasons explained previously [137]. Farmers contacted for the 2005-2010 interview either completed the CATI or a reason for non-response was noted. Reasons for non-non-response included: 1) refusal; 2) inability to reach the person by phone; and, 3) illness prohibiting participation. For the present analysis, farmers who were not contacted or who did not respond to the 2005-2010 interview are referred to as non-participants, whereas, those who completed the interview are referred to as participants.
The AHS was approved by the Institutional Review Boards (IRBs) of the National Institutes of Health and its contractors. The current analysis was also approved by the IRB of the University of North Carolina at Chapel Hill. Participants indicated initial informed consent by completing the enrollment questionnaire. Copies of all questionnaires are available on the study Web site (http://www.aghealth.nih.gov/collaboration/questionnaires.html).
Basline predictors of participation
22
disease, asthma, other chronic lung disease, kidney disease, diabetes, Parkinson’s disease, depression, tuberculosis, and pneumonia), personal use of pesticides (ever use, percent of time using, lifetime years of use, days per year of use, and ever use of functional groups and chemical classes), and other farm work/farm characteristics (farm size, work in hog or poultry
confinement, number of livestock and poultry, and major income producing animals). I examined the distribution of each variable by participation status (participants vs.
non-participants) and by reason for non-participation (death vs. refusal/exclusion). I estimated crude associations between variables and participation and categorized variables to preserve the shape of the association between each factor and participation.
23 Assessing selection bias
Cancer incidence for members of the AHS was ascertained by linkage of the enrollment cohort with state (Iowa, North Carolina) cancer registries through December 31, 2010.
Consequently, the association between enrollment information and cancer incidence over the period from enrollment through 2010 is not affected by attrition (except for the small proportion of farmers who leave the state) and can be estimated for the full cohort. In contrast, most other health outcomes are self-reported by participants during follow-up interviews and therefore case status is unavailable for non-participants. The present analysis is meant to serve as an example of the potential impact of attrition on analyses of associations between agricultural exposures and self-reported health outcomes when estimated using information ascertained from farmers participating in the 2005-2010 interview. Because complete-case ascertainment for cancer is available, I used cancer outcomes to illustrate conditions under which restricting analyses to 2005-2010 participants may result in biased effect estimates.
24
illustrates the relationships between ever smoking (E), each incident cancer outcome (D), a vector of covariates (Z) and selection (S) for each association.
I estimated the association between ever smoking and each incident cancer outcome in the full cohort and in the sub-cohort. For each smoking-cancer association, I used inverse probability of exposure weights (IPEW) to address confounding. The application of IPEW is a form of direct standardization that creates a “pseudo-population” in which the distributions of confounding variables are similar across exposure groups [169-171]. Confounders and risk factors for each cancer outcome were identified by previous literature [172], and included age at censoring, state, gender, education, race/ethnicity, and marital status. Alcohol consumption was also included in the model to estimate weights for the ever smoking-bladder cancer association. The association for ever smoking and prostate cancer was restricted to male farmers. First, I used logistic regression models to estimate the predicted probability of ever smoking (i.e., propensity scores for smoking for each individual), conditional on confounders or non-confounding risk factors for each cancer outcome. Next, I assigned each individual a weight equal to the inverse of the predicted probability that the individual had his/her observed smoking status. To stabilize each individual’s weight, I multiplied each weight by the marginal probability of their observed smoking status.
25
These robust estimates are equivalent to generalized estimating equation estimates using an independent working covariance matrix [173]. I considered the estimated association for the full cohort as the target parameter of interest.
In this example, I examine incidence proportions so results will apply to the outcomes reported as part of the 2005-2010 interview with limited information on timing of onset and diagnosis (e.g., COPD). Because timing of cancer diagnosis is available, I repeated analyses using a time-to-event approach and conclusions remained the same (results not shown).
Inverse probability weighting for selection bias
26
Among the sub-cohort, using log-binomial and linear-binomial models I estimated cumulative incidence, RRs, RDs for the three ever smoking-cancer associations after applying IPSW|E,Z,D and IPSW|E,Z.
For each analysis, adjustment for confounding and selection was achieved by applying a product of the IPEW and IPSW [169, 171, 174]. The distribution of all weights used in these analyses are provided in Table 3.1. Weights were well-behaved with means close to one and no extreme values (<0.05 or >20). All analyses were performed using SAS, version 9.3 (SAS Institute, Inc., Cary, North Carolina).
Results
A total of 28,223 farmers did not participate in the 2005-2010 interview (Figure 3.2). Thirteen percent of non-participants died prior to interview. Other reasons for non-participation included refusal at the current interview or a previous point, exclusion, an inability to be
contacted, and illness.
Baseline predictors of participation
The set of enrollment variables that were identified as predictive of and strongly associated with participation included age, state, race/ethnicity, education, marital status, smoking status, and alcohol consumption (Table 3.2). Age less than 40 or older than 70 years was associated with a decrease in log odds of participation compared to 40-49 year olds. As age at enrollment increased death explained an increasing portion of non-participation. Enrollment in North Carolina, race/ethnicity other than non-Hispanic white, having less than a high school degree, not being married or living as married, and heavy drinking were associated with a
27
pack-years, was associated with a decrease in log-odds of participation compared to never
smokers. As the number of pack years increased for former and current smokers, death explained a greater proportion of non-participation. Males also had a lower log-odds of participation than females.
Medical conditions, pesticide use, and farm characteristics reported at enrollment were not included in the set of variables predictive of and associated with participation (Tables 3.3-3.5). Self-report of a doctor diagnosis of heart disease, diabetes, and Parkinson’s disease at enrollment was associated with a decrease in log-odds of participation. Generally, variables indicating personal pesticide use or raising animals were associated with small increases in log-odds of participation. Several of these variables were significant predictors but were not strongly associated with participation or the characteristic was rare. Size of farm was predictive of
participation but was missing for 11% of the cohort.
Assessing selection bias
Ever smoking was weakly associated with participation – a greater proportion of ever smokers were non-participants compared with never smokers (Table 3.6). Overall, incident lung cancer had a strong, inverse association with participation, incident bladder cancer was not associated with participation, and incident prostate cancer had a weak, positive association with participation. The proportion of non-participation due to mortality was greatest for lung cancer, followed by bladder cancer, and then prostate cancer.
The number and proportion of participants by smoking and cancer outcome is shown in
28
cases was also differential with respect to smoking – a smaller proportion of ever-smoking lung cancer cases participated than never-smoking lung cancer cases. Similar proportions of bladder cancer cases and non-cases participated in the 2005-2010 interview leading to similar cumulative incidence estimates from the full and sub-cohorts. A greater proportion of prostate cancer cases participated compared with non-cases. This led to an overestimate of the cumulative incidence of prostate cancer in the sub-cohort compared to the full cohort. Participation for bladder and prostate cancer cases and non-cases was non-differential with respect to smoking.
Standardized estimates of the RR (95% CI) and RD (95% CI) for smoking in the full and sub-cohorts are shown in Figures 3.3 and 3.4. Because of differential participation of lung cancer cases with respect to smoking, the sub-cohort RR and RD were underestimates of the effect of ever smoking on lung cancer estimated in the full cohort. Precision was reduced for the sub-cohort RR and its 95% CI contained the full-cohort estimate. Non-differential participation of bladder and prostate cancer cases by smoking status led to sub-cohort RR estimates similar to full cohort estimates. The sub-cohort RD for ever smoking and bladder cancer was also similar to the full cohort RD. For ever smoking and prostate cancer, the sub-cohort RD was on the opposite side of the null and less precise but was not significantly different than the full cohort RD.
Illustrating bias reduction through IPSW
29
similar to full-cohort estimates, application of IPSW|E,Z shifted estimates to the same side of the null as full-cohort estimates.
Discussion
Forty-six percent of farmers enrolled in the AHS participated in the 2005-2010 interview occurring a median 12 years after enrollment. Both loss (through non-response or exclusion) and mortality contributed to attrition within the cohort. The enrollment variables age, state,
education, race/ethnicity, marital status, smoking, and alcohol consumption were predictors of participation in the 2005-2010 interview; prevalent disease, personal use of pesticides and raising animals, variables often considered as exposures in AHS analyses, generally were not strongly associated with participation. Using outcomes with complete-case ascertainment (incident cancers) as examples, I identified conditions under which restricting analyses to participants of the 2005-2010 interview may introduce bias. In the absence of the exposure and outcome being strongly predictive of participation, sub-cohort results were similar to full-cohort estimates. Further, when the exposure and outcome were weakly associated with participation but were not associated with each other, little bias was observed. The identification of predictors of
participation from enrollment data and conditions under which analyses that must be restricted to sub-cohort participants may produce results similar to those from the full cohort can be used to inform analyses of associations involving incident disease reported only as part of the 2005-2010 interview.
30
one of several chronic medical conditions at enrollment; although residual confounding by age may partially explain these associations. A greater proportion of deaths also occurred among farmers with less than a high school education, reporting more than 20 years of pesticide use, or living or working on smaller properties. Although death accounted for greater proportions of non-participants within specific sub-groups, a majority of non-participants were either excluded (28%), could not be reached (35%), or refused to participate (23%).
Observed associations between enrollment factors and non-participation were similar to those found within other cohort studies. Other researchers have observed non-participation in study follow-up activities associated with younger and older age [175-179], male gender [177, 178, 180], minority race/ethnicity [178], lower levels of education [161, 175, 178, 179], and marital status other than married [175, 179-181]. Although mortality was a major contributor to non-participation among older farmers, younger farmers may have less time to participate in study activities or be unwilling to participate for other reasons. Smoking [175, 178, 179, 181, 182] and heavy alcohol consumption [179, 182] have also been consistently associated with attrition in previous work; as has abstention from alcohol [179], which was not observed here. Finally, as observed here for farmers reporting a diagnosis of heart disease, diabetes or
31
diagnoses that were associated with participation compared with the ones that were not, consistent with this hypothesis.
Relationships between enrollment characteristics and participation were consistent with factors associated with participation in the 1999-2003 interview with a few notable exceptions [136]. In the previous investigation, odds of participation increased with increasing age;
however, that investigation excluded those who died prior to interview. This exclusion, coupled with the aging of the cohort since the previous interview may partially account for the difference. Individuals reporting illness at enrollment were more likely to participate in the 1999-2003 interview, which the authors suggested could be explained by the “worried ill” phenomenon [136]. I did not observe this phenomenon in the present investigation. It is possible that with more time, the “worried ill” phenomenon has faded. Farmers reporting a diagnosed medical condition at enrollment have had more time to experience complications that may lead to non-participation. Elevated mortality rates for farmers reporting a diagnosed medical condition compared with those who did not, provides evidence supporting this explanation. Although the “worried ill” phenomenon was not observed for medical conditions reported at enrollment, a greater proportion of incident prostate cancer cases than non-cases participated in the 2005-2010 interview. This could indicate that disease-related interest in participation may be operating along with disease-related reasons for non-participation.
32
a stronger interest in participating in a study of the health effects of such exposures.
Alternatively, it is possible that farmers who reported infrequent pesticide use at enrollment or who were not involved in other activities, were less healthy than other farmers and therefore were unable to participate in study interviews.
Researchers have previously used simulation studies and DAG theory to investigate the potential impacts of attrition in cohort studies [140-142, 145, 183]. However, few studies include investigations of potential impacts of attrition in a real-world setting [143]. Using three
examples, I identified conditions under which analyses that must be restricted to interview participants produced similar effect estimates to those from the full cohort. I illustrated that effect estimates estimated from those who remain under study may be biased when exposure and outcome are associated and, participation is associated with the exposure and outcome under study leading to differential participation of cases or non-cases by exposure status. This could occur when the outcome under study is associated with rapid mortality or disability rates precluding participation soon after diagnosis. Under the conditions examined here, the RR estimated from 2005-2010 interview participants was much less precise than the full-cohort RR, leading it to contain the full cohort estimate within its bounds. This was not the case for the RD. Alternatively, when the outcome under study was not strongly associated with participation resulting in non-differential participation of cases and non-cases by exposure, sub-cohort RD and RR estimates were similar to, although less precise than, estimates from the full cohort.
33
estimates to the same side of the null but did not substantially alter conclusions. Finally, when the outcome was not associated with participation, IPSW were unnecessary. Collectively, these observations align with findings from simulation studies and theoretical examples [141, 142, 144, 145].
34
Although I was able to evaluate associations between many enrollment characteristics and participation, it is possible that other unmeasured characteristics were important predictors of participation. Specifically, I was not able to examine associations between many of the
35
36
Figures and Tables
37
38
39
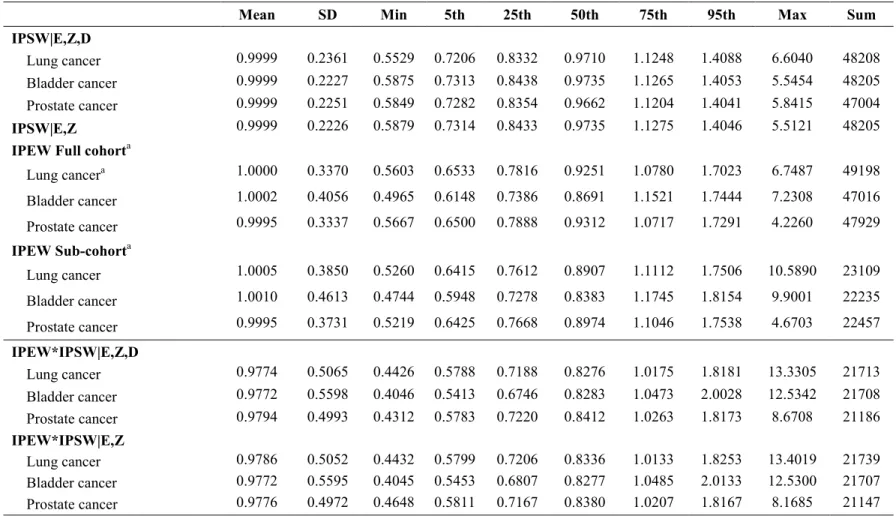
Table 3.1. Distribution of stabilized inverse probability of exposure and selection weights applied to analyses of the
association between ever smoking and 1) incident lung cancer; 2) incident bladder cancer; and, 3) incident prostate cancer.
Mean SD Min 5th 25th 50th 75th 95th Max Sum
IPSW|E,Z,D
Lung cancer 0.9999 0.2361 0.5529 0.7206 0.8332 0.9710 1.1248 1.4088 6.6040 48208 Bladder cancer 0.9999 0.2227 0.5875 0.7313 0.8438 0.9735 1.1265 1.4053 5.5454 48205 Prostate cancer 0.9999 0.2251 0.5849 0.7282 0.8354 0.9662 1.1204 1.4041 5.8415 47004
IPSW|E,Z 0.9999 0.2226 0.5879 0.7314 0.8433 0.9735 1.1275 1.4046 5.5121 48205
IPEW Full cohorta
Lung cancera 1.0000 0.3370 0.5603 0.6533 0.7816 0.9251 1.0780 1.7023 6.7487 49198
Bladder cancer 1.0002 0.4056 0.4965 0.6148 0.7386 0.8691 1.1521 1.7444 7.2308 47016 Prostate cancer 0.9995 0.3337 0.5667 0.6500 0.7888 0.9312 1.0717 1.7291 4.2260 47929
IPEW Sub-cohorta
Lung cancer 1.0005 0.3850 0.5260 0.6415 0.7612 0.8907 1.1112 1.7506 10.5890 23109 Bladder cancer 1.0010 0.4613 0.4744 0.5948 0.7278 0.8383 1.1745 1.8154 9.9001 22235 Prostate cancer 0.9995 0.3731 0.5219 0.6425 0.7668 0.8974 1.1046 1.7538 4.6703 22457 IPEW*IPSW|E,Z,D
Lung cancer 0.9774 0.5065 0.4426 0.5788 0.7188 0.8276 1.0175 1.8181 13.3305 21713 Bladder cancer 0.9772 0.5598 0.4046 0.5413 0.6746 0.8283 1.0473 2.0028 12.5342 21708 Prostate cancer 0.9794 0.4993 0.4312 0.5783 0.7220 0.8412 1.0263 1.8173 8.6708 21186 IPEW*IPSW|E,Z
Lung cancer 0.9786 0.5052 0.4432 0.5799 0.7206 0.8336 1.0133 1.8253 13.4019 21739 Bladder cancer 0.9772 0.5595 0.4045 0.5453 0.6807 0.8277 1.0485 2.0133 12.5300 21707 Prostate cancer 0.9776 0.4972 0.4648 0.5811 0.7167 0.8380 1.0207 1.8167 8.1685 21147 SD = Standard deviation
IPSW|E,Z = inverse probably of selection weights conditional on ever smoking (E) and (Z) which includes age, state, race/ethnicity, education, marital status, and alcohol consumption.
IPSW|E,Z,D = inverse probably of selection weights conditional on ever smoking (E), (Z), and the specified cancer outcome (D).
a Estimated using indicator variables for age at censoring, state, gender, race/ethnicity, education, and marital status. Alcohol consumption was
included for the ever smoking-bladder cancer association. The ever smoking-prostate cancer analysis was restricted to male farmers.
40
Table 3.2. Associations between demographic and lifestyle variables reported at enrollment (1993-1997) and participation in the 2005-2010 interview among 52,394 farmers, Agricultural Health Study.
Enrollment
Enrolled Participants Non-participants
Refusals/Exclusions Deaths Wald
characteristics N =52394 N = 24171 %a N = 24682 %a N = 3541 %a βb SE χ2
Age
<30 years 4493 1443 32 3019 67 31 1 -0.65 0.04 221.61 30-39 years 12141 5205 43 6788 56 148 1 -0.23 0.03 67.66 40-49 years 14108 7012 50 6749 48 347 2 Ref
50-59 years 11155 5913 53 4491 40 751 7 0.21 0.03 51.84 60-69 years 7768 3781 49 2723 35 1264 16 0.11 0.03 10.72 70-79 years 2487 784 32 836 34 867 35 -0.54 0.06 84.98 80 + years 242 33 14 76 31 133 55 -1.84 0.29 40.73
State
Iowa 31876 15760 49 14572 46 1544 5 Ref
North Carolina 20518 8411 41 10110 49 1997 10 -0.23 0.02 93.91
Gender
Female 1362 674 49 616 45 72 5 0.23 0.07 10.36 Male 51031 23496 46 24066 47 3469 7 Ref
Race/Ethnicity
White 49345 23202 47 22891 46 3252 7 Ref
Black 1172 336 29 705 60 131 11 -0.55 0.10 32.29 Hispanic 523 206 39 285 54 32 6 -0.48 0.19 6.69 Other 288 93 32 153 53 42 15 -0.25 0.11 5.55
Missing 1066
Education
< High school degree 5224 1840 35 2580 49 804 15 -0.32 0.04 57.56 High school grad/GED 24061 10739 45 11720 49 1602 7 Ref
Some college 12119 5988 49 5608 46 523 4 0.23 0.02 83.31 ≥ College grad 8589 4740 55 3490 41 359 4 0.44 0.03 239.30
Enrollment
Enrolled Participants Non-participants
Refusals/Exclusions Deaths Wald
characteristics N =52394 N = 24171 %a N = 24682 %a N = 3541 %a βb SE χ2
Missing 2401
Marital Status
Married/Living as 43692 21114 48 19468 45 3110 7 Ref
Divorced/Separated 2299 756 33 1437 63 106 5 -0.57 0.05 116.81 Widowed/Never married 6143 2228 36 3617 59 298 5 -0.24 0.03 48.51
Missing 260 260
Smoking status (pack years)
Never 26690 13031 49 12476 47 1183 4 Ref
Former, <5 5635 2907 52 2448 43 280 5 0.07 0.03 4.54 Former, 5-29 6168 2974 48 2654 43 540 9 -0.06 0.03 3.63 Former, ≥ 30 2831 1275 45 1060 37 496 18 -0.12 0.05 6.80 Current, <15 2980 1027 34 1825 61 128 4 -0.35 0.05 57.49 Current, 15-44 3618 1405 39 1912 53 301 8 -0.37 0.04 79.66 Current, ≥45 1263 503 40 550 44 210 17 -0.36 0.07 26.94
Missing 3209
Alcohol consumptionc
None 16837 7936 47 7255 43 1646 10 Ref
Light drinker 30521 14481 47 14603 48 1437 5 -0.10 0.02 17.95 Heavy drinker 1113 375 34 708 64 30 3 -0.42 0.07 32.80
Missing 3923 3923
a The % shown is the proportion of participation, or non-participation (by death and refusals/exclusions), by the specified level of each
enrollment characteristic.
b β coefficient is the change in log odds of participation comparing the specified level of each characteristic to the referent.
c Heavy drinkers reported consuming five or more drinks on the same occasion on each of five or more days in the past 30 days, light
drinkers reported consuming at least one drink on at least one day during the past 12 months but did not qualify as a heavy drinker [187].
Table 3.3. Associations between diagnosed medical conditions measured at enrollment (1993-1997) and participation in the 2005-2010 interview among 52,394 farmers, Agricultural Health Study.
Enrolled Participants Non-participants
Medical diagnosesa Refusals/Exclusions Deaths
reported at enrollment N =52394 N = 24171 %b N = 24682 %b N = 3541 %b Βc SE Wald χ2
Heart disease 2637 1122 43 933 35 582 22 -0.22 0.04 26.26 Asthma 2599 1245 48 1169 45 185 7 0.03 0.04 0.60 Other chronic lung
disease 1808 850 47 707 39 251 14 0.03 0.05 0.33 Kidney disease 481 226 47 164 34 91 19 0.02 0.10 0.03 Diabetes 1471 578 39 586 40 307 21 -0.36 0.06 41.48 Parkinson's 75 25 33 27 36 23 31 -0.59 0.26 5.00 Depression 1828 886 48 772 42 170 9 0.03 0.05 0.36 Tuberculosis 113 52 46 51 45 10 9 0.01 0.20 <0.01 Pneumonia 7137 3550 50 2992 42 595 8 0.07 0.03 7.70
a Data were missing for 1-8% of medical diagnoses.
b The % shown is the proportion of participation, or non-participation (by death and refusals/exclusions), by the specified level of each
enrollment characteristic.
c β coefficient is the change in log odds of participation comparing the specified level of each characteristic to the referent adjusted for
age, state, race/ethnicity, education, smoking, and alcohol consumption.
Table 3.4. Associations between pesticide use variables reported at enrollment (1993-1997) and participation in the 2005-2010 interview among 52,394 farmers, Agricultural Health Study.
Enrolled Participants Non-participants
Pesticide use at Refusals/Exclusions Deaths
enrollment N =52394 N = 24171 %a N = 24682 %a N = 3541 %a βb SE Wald χ2
Ever mixed/applied pesticides
Never 450 120 27 305 68 25 6 Ref
Ever 50620 23643 47 23613 47 3364 7 0.58 0.12 23.8
Missing 1324
Personally apply pesticides
Never 2253 855 38 1227 54 171 8 Ref
< half the time 11330 4962 44 5575 49 793 7 0.18 0.04 24.81 ≥ half the time 34728 16951 49 15641 45 2136 6 0.35 0.03 111.09
Missing 4083
Lifetime years of mixing/applying
None 498 143 29 326 65 29 6 Ref
≤ 1 year 1116 409 37 644 58 63 6 0.11 0.08 2.05 2-5 years 5571 2247 40 3060 55 264 5 0.23 0.05 20.48 6-10 years 7469 3175 43 3892 52 402 5 0.22 0.05 20.63 11-20 years 15987 7644 48 7611 48 732 5 0.32 0.05 48.05 21-30 years 11672 5978 51 4888 42 806 7 0.34 0.05 52.76 >30 years 6494 3339 51 2298 35 857 13 0.41 0.05 64.80
Missing 3587
Days/year mixing/applying
None 498 143 29 326 65 29 6 Ref
< 5 days 8691 4132 48 3811 44 748 9 0.39 0.05 72.75 5-9 days 11330 5498 49 5028 44 804 7 0.36 0.05 65.50 10-19 days 14349 7156 50 6388 45 805 6 0.42 0.04 89.58 20-39 days 9240 4206 46 4541 49 493 5 0.28 0.05 37.37
Enrolled Participants Non-participants
Pesticide use at Refusals/Exclusions Deaths
enrollment N =52394 N = 24171 %a N = 24682 %a N = 3541 %a βb SE Wald χ2
40-59 days 2408 984 41 1300 54 124 5 0.18 0.06 9.60 60-150 days 1572 589 37 893 57 90 6 0.11 0.07 2.66 > 150 days 349 120 34 205 59 24 7 -0.01 0.13 <0.01
Missing 3957
Ever usec
Fungicides 19094 8944 47 8735 46 1415 7 0.15 0.02 47.34 Fumigants 12168 5890 48 5241 43 1037 9 0.21 0.02 72.35 Herbicides 49678 23327 47 23068 46 3283 7 0.28 0.06 24.97 Insecticides 47312 22487 48 21692 46 3133 7 0.29 0.04 52.66 Organochlorines 25465 13190 52 10016 39 2259 9 0.26 0.02 150.40 Organophosphates 44796 21443 48 20476 46 2877 6 0.19 0.03 38.01 Carbamates 33222 16260 49 14563 44 2399 7 0.25 0.02 137.94 Pyrethroids 11006 5604 51 4947 45 455 4 0.14 0.02 34.82 Triazines 39260 18834 48 17967 46 2459 6 0.04 0.02 3.42 Phenoxy 38852 18855 49 17452 45 2545 7 0.12 0.02 27.79
Use of chemically resistant gloves
No 16021 6697 42 8412 53 1710 11 Ref
Yes 34112 16618 49 16264 48 1830 5 0.10 0.02 20.48
Missing 8
a The % shown is the proportion of participation, or non-participation (by death and refusals/exclusions), by the specified level of each
enrollment characteristic.
b β coefficient is the change in log odds of participation comparing the specified level of each characteristic to the referent adjusted for
age, state, race/ethnicity, education, smoking, and alcohol consumption.
c Derived from reported use of individual pesticides. Fungicides include benomyl, captan, chlorothalonil, maneb/mancozeb, metalaxyl,
and ziram. Fumigants include aluminum phosphide, carbontetrachloride/carbon disulfide (80/20 mix), ethylene dibromide, and methyl bromide. Herbicides include alachlor, butylate, chlorimuron-ethyl, dicamba, EPTC, glyphosate, imazethepyr, metolachlor, paraquat, pendimethalin, petroleum oil, trifluralin, phenoxy (2,4-D, 2,4,5-T, 2,4,5-TP), triazines (atrazine, cyanazine, metribuzin). Insecticides include carbamates (aldicarb, carbaryl, carbofuran), organochlorines (aldrin, chlordane, DDT, dieldrin, heptachlor, lindane, toxaphene), organophosphates (chlorpyrifos, coumaphos, diazinon, dichlorvos, fonofos, malathion, parathion, phorate, terbufos, trichlorfon, and pyrethroids (permethrin for animals, permethrin for crops). Data were missing for 1-12% of pesticide use variables.
![Table 2.1. Organophosphate, pyrethroid, and carbamate insecticides and the year first registered for use in the United States [151-153]](https://thumb-us.123doks.com/thumbv2/123dok_us/8251941.2186436/31.918.122.797.211.502/table-organophosphate-pyrethroid-carbamate-insecticides-registered-united-states.webp)