Disk Regrowth in E/S0 Galaxies and its Environmental Dependence
Amanda J. Moffett
A dissertation submitted to the faculty of the University of North Carolina at Chapel Hill in partial fulfillment of the requirements for the degree of Doctor of Philosophy in the Department of
Physics and Astronomy.
Chapel Hill 2014
Approved by:
Sheila Kannappan
Bruce Carney
Gerald Cecil
Andreas Berlind
John Wilkerson
c
O2014
ABSTRACT
Amanda J. Moffett: Disk Regrowth in E/S0 Galaxies and its Environmental Dependence (Under the direction of Sheila Kannappan)
This work is focused on the investigation of observational evidence for the predicted “disk
regrowth” process, which may allow spheroid-dominated E/S0 galaxies to rebuild spiral disks
re-sembling that of the Milky Way Galaxy. By combining analysis of several complementary galaxy
samples, we derive new observational constraints on the frequency, significance, and conditions of
E/S0 disk regrowth.
We find that UV-detected disks, which represent recent star formation activity, are exceptionally
common in low-mass E/S0 galaxies, and we define a new class of UV-Bright (UV-B) disk E/S0s that
is associated with significant (&10% by mass) recent disk growth, blue optical outer-disk colors,
and enhanced atomic gas content. These UV-B disks are closely linked to a particular class of
low-mass, optically blue E/S0s that were previously hypothesized to host active disk regrowth. The
detection of UV-B disks around nearly all low-mass, blue E/S0s supports this picture and reinforces
the potential importance of mass scales in the disk regrowth process. We also find that another
type of mass scale, involving the mass of the group halo in which a galaxy resides, appears to
play an important role in disk regrowth. Below a group halo mass of ∼ 1011.5M
⊙, blue E/S0s,
gas-dominated galaxies, and UV-B disks all become more common, which may imply that such low
group halo mass environments are important for allowing disk regrowth to proceed. This picture is
consistent with both the variations of E/S0 and spiral galaxy frequency as a function of environment,
with spiral galaxy frequencies rising at low group halo mass, and the observed similarity between
typical environments of E/S0 and spiral galaxies at low baryonic mass (. 1010M⊙). Finally, we
find direct evidence for secondary stellar disks in the kinematics of 6 out of 24 S0 galaxies for
which we can confidently assess the presence or absence of secondary disks, but due to the small
number of identifications, we cannot yet draw firm conclusions about any preference for specific
ACKNOWLEDGEMENTS
I thank my advisor, Sheila Kannappan, for her steadfast guidance and encouragement.
Through Sheila’s example, I have learned more than I could have imagined about conducting research
and leading an ambitious project. I have also become an experienced observer under her watch,
learning how to write a compelling case for my science and deal with the ups and downs of weather,
instruments, and data reduction. Sheila’s investment in the education of students and passion for
bringing astronomy research to audiences outside of UNC is inspiring, and I hope to always follow
her example in striving to ignite the scientific curiosity of potential young astronomers and members
of the public.
I would like to thank the rest of my committee (Bruce Carney, Gerald Cecil, Andreas Berlind,
John Wilkerson, and Fabian Heitsch) for their time spent considering and offering helpful feedback
on this research as well. I acknowledge the assistance of a number of collaborators with specific
parts of this work in the individual chapters, but more generally I would like to thank my long-term
collaborators Andrew Baker and Andreas Berlind for their advice and support. I would also like to
thank all of my office mates and allies in observing for their influence throughout the years (Kathleen
Eckert, David Stark, Erik Hoversten, Mark Norris, Amy Gonzalez, and Jo Ellen McBride). You have
all helped me make it to this point, if only by lending a sympathetic ear to voiced frustrations or
providing much-needed entertainment on long observing nights spent peering at clouds. I have
learned a great deal from our discussions. I thank Lisa Wei for sharing her experience with me as
well.
I would also like to thank everyone at UNC involved with SOAR and its instruments for their
efforts to develop and maintain the capabilities that benefit us all, particularly Chris Clemens and
his group for their work on the Goodman Spectrograph. I thank Gerald Cecil, Sheila Kannappan,
and Kurtis Keller for teaching me about instrument design through our efforts to build an ADC for
Goodman. I thank the SOAR telescope operators for their hard work and long hours that make it
possible for us to access our SOAR resources remotely.
I acknowledge funding support from several sources during the completion of this thesis: GALEX
Research, the NASA Harriett G. Jenkins Pre-doctoral Fellowship, a North Carolina Space Grant,
and the UNC Royster Society of Fellows Dissertation Completion Fellowship (specifically funded by
Ed and Carol Smithwick).
On a more personal level, I want to thank my first astronomy teacher and research advisor,
Beverly Smith, for encouraging my passion for astronomy and helping me realize that I can pursue
this passion as a career. To my SO, Matt Brown, I thank you for the partnership and support that
has extended throughout the majority of my time in graduate school. You can consider this an IOU
for many turns at washing the dishes.
Most of all, I would like to thank my parents. I quite literally could not have made it here without
you. You made me who I am, with both the curiosity to pursue this path and the stubbornness to
stick to it. Your love, support, and encouragement have been with me every step of the way, and I
PREFACE
Our own home galaxy, the Milky Way, is the galaxy astronomers are capable of studying in
the most detail and the one galaxy we might expect to understand the best. However, there are
crucial aspects of the histories of the Milky Way Galaxy and other similar galaxies that we still do
not understand well. Galaxies that physically resemble the Milky Way appear to be common in the
universe, but their very abundance presents a puzzle for galaxy evolution models in which
Milky-Way-like galaxy disks are frequently destroyed by violent mergers between galaxies. One way out of
this apparent paradox is that while galaxy disks may frequently be destroyed by mergers they may
also regrow at later times in a potentially repeating cycle of disk growth and destruction. In this
thesis, we search for observational evidence of the predicted disk regrowth process in a population
of galaxies that are thought to result from disk-destroying mergers.
The first project that forms part of this thesis (Chapter 2) was previously published as an article
in The Astrophysical Journal with the title “Extended UV Disks and UV-Bright Disks in
Low-Mass E/S0 Galaxies.” My coauthors on this work are Sheila J. Kannappan, Andrew J. Baker, and
Seppo Laine. Earlier version of this work have also been published in conference proceedings of the
Astronomical Society of the Pacific and European Astronomical Society. The second project that
forms part of this thesis (Chapter 3) is not yet published but will soon be submitted for publication.
My coauthors on this work are Sheila J. Kannappan, Andreas A. Berlind, Kathleen D. Eckert, David
V. Stark, David Hendel, Mark A. Norris, and Norman A. Grogin. The final project that forms part
of this thesis (Chapter 4) is at an advanced stage, with results available for about half the sample.
My coauthors on this work are Sheila J. Kannappan, Mark A. Norris, Erik A. Hoversten, Andreas
TABLE OF CONTENTS
LIST OF FIGURES ... xii
LIST OF TABLES...xiii
LIST OF ABBREVIATIONS AND SYMBOLS ...xiv
CHAPTER 1: INTRODUCTION ...1
1.1 Background ... 1
1.2 Galaxy Samples ... 3
1.3 Research Approaches ... 5
1.4 Results Summary ... 6
CHAPTER 2: EXTENDED UV DISKS AND UV-BRIGHT DISKS IN LOW-MASS E/S0 GALAXIES ...7
2.1 Introduction... 7
2.2 Sample and Data Reduction ... 9
2.3 Identifying Extended Star Formation ... 12
2.3.1 Prior Definitions... 13
2.3.2 A New Purely Quantitative XUV Disk Definition... 14
2.3.3 UV-Bright (UV-B) Disk Definition ... 16
2.4 XUV Disk Properties and Demographics... 19
2.4.1 Extents and Ages ... 19
2.4.2 Demographics ... 20
2.4.3 Star Formation ... 23
2.5 UV-B Disk Properties and Demographics ... 23
2.5.1 Extents and Ages ... 23
2.5.2 Demographics ... 24
2.5.3 Star Formation ... 24
2.6.1 High Frequencies of XUV and UV-B Disks ... 26
2.6.2 Ubiquity of XUVs Compared to UV-Bs... 28
2.6.3 Relationship to Star Formation and HI Content... 29
2.7 Conclusions... 29
CHAPTER 3: ECO AND RESOLVE: GALAXY DISK GROWTH IN ENVIRONMENTAL CONTEXT ...34
3.1 Introduction... 34
3.2 Samples ... 38
3.2.1 ECO catalog... 38
3.2.2 RESOLVE-B ... 42
3.3 Methods ... 42
3.3.1 Imaging/Photometry ... 44
3.3.2 Color and Stellar Mass Estimation ... 45
3.3.3 The Red and Blue Sequences ... 45
3.3.4 Morphology Classification ... 46
3.3.5 Identification of UV Disks ... 48
3.3.6 Environment Metrics ... 49
3.3.7 Atomic Gas Mass Estimates ... 52
3.3.8 Completeness Corrections... 56
3.4 Results... 58
3.4.1 Traditional Morphology-Environment Relation - P(M|E) ... 59
3.4.2 Alternative Morphology-Environment Relation - P(E|M) ... 61
3.4.3 Extreme Gas Richness and Environment ... 66
3.4.4 UV Disk Growth and Environment ... 73
3.5 Discussion ... 73
3.5.1 Morphology-Environment Relations... 73
3.5.2 The Regime of Extreme Gas Richness and Recent Disk Growth ... 76
3.6 Conclusions... 77
4.1 Introduction... 81
4.2 Data and Methods ... 82
4.2.1 Sample ... 82
4.2.2 Observations and Data Reduction ... 84
4.2.3 Identification of Stellar-Stellar Counterrotation... 87
4.3 Results and Discussion ... 88
4.4 Conclusions... 106
CHAPTER 5: CONCLUSIONS AND FUTURE WORK ...109
APPENDIX A: RESOLVE MORPHOLOGY CLASSIFICATION ...112
LIST OF FIGURES
2.1 GALEX GI and archival E/S0 sample in color-stellar mass space... 10
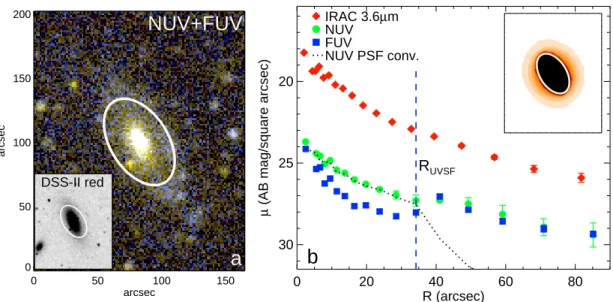
2.2 Images and surface brightness profiles of NGC 4117, one of several XUV-disk galaxies identified on the red sequence. ... 11
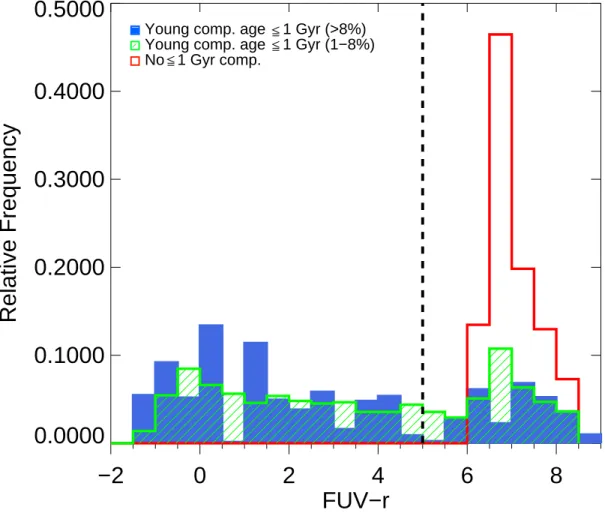
2.3 FUV−rcolor for selected composite stellar population models, illustrating issues with using this color as a clean young/old population divider. ... 17
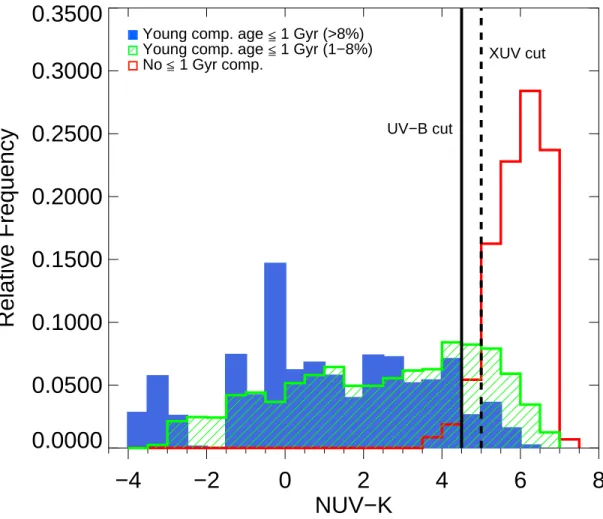
2.4 NUV−Kcolor for selected composite stellar population models, illustrating NUV−K
cuts chosen for our analysis. ... 18
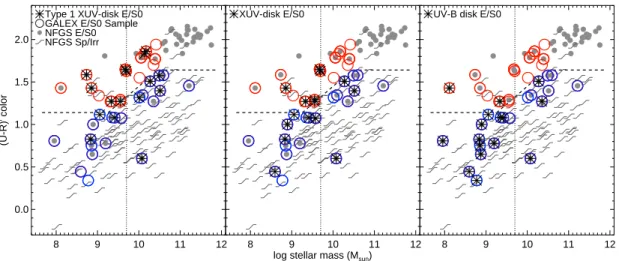
2.5 GALEX GI and archival E/S0 sample in color-stellar mass space showing UV disks identified according to three different classifications. ... 19
2.6 Optical outer-disk colors for sample E/S0s. ... 21
2.7 HI content versus NUV−K color measured within the detected galaxy extent in the NUV... 22
2.8 Smoothed NUV contours overlaid on DSS-II red images of XUV-disk E/S0s... 25
2.9 Smoothed NUV contours overlaid on DSS-II red images of UV-B disk E/S0s that are not also XUV-disk E/S0s. ... 26
2.10 Smoothed NUV contours overlaid on DSS-II red images of E/S0s in our sample with-out XUV or UV-B disks. ... 27
3.1 The ECO catalog region in sky coordinates, with color coding according to group halo masses. ... 38
3.2 The ECO catalog region in RA vs. line-of-sight distance coordinates... 39
3.3 Illustration of the completeness and selection of the ECO catalog... 40
3.4 The distribution of galaxies by halo mass in the ECO, ECO+G, and RESOLVE-B
samples. ... 43
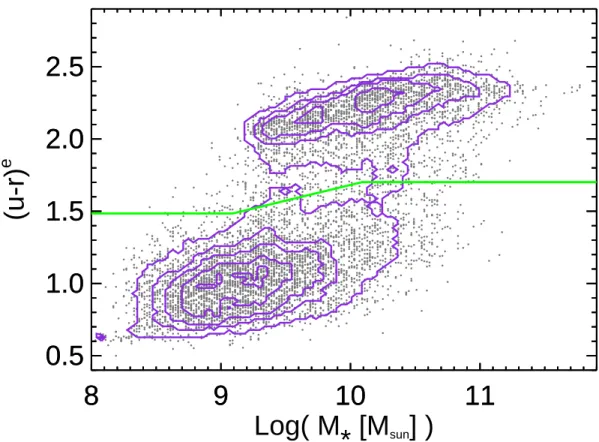
3.5 Color vs. stellar mass for the ECO catalog sample. ... 46
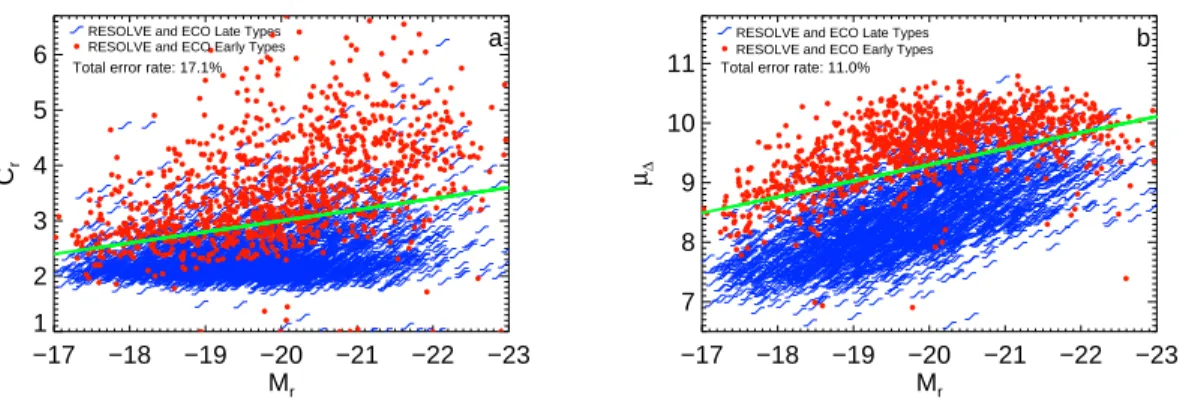
3.6 Quantitative morphology metrics applied to by-eye classified galaxies in the RE-SOLVE and ECO samples. ... 47
3.7 Illustration of the recovery of real-space mock galaxy catalog group velocity disper-sions after finger-of-God collapse. ... 53
3.8 Illustration of the finger-of-God collapse procedure applied to the ECO catalog. ... 54
3.9 Multiplicative completeness correction factors for each ECO galaxy. ... 56
3.10 Illustration of ECO catalog galaxy distributions in the group halo mass and galaxy baryonic mass space... 58
3.12 Illustration of morphology-environment relations in the ECO sample for separate
high-and low-mass samples. ... 60
3.13 Halo mass distribution for early and late type galaxies in the ECO sample... 61
3.14 Variation in blue early type galaxy frequency as a function of stellar mass in the ECO sample. ... 62
3.15 Characteristic distribution of halo mass as a function of stellar mass for different galaxy types. ... 64
3.16 Characteristic distribution of halo mass as a function of baryonic mass for different galaxy types. ... 65
3.17 Characteristic distribution of environmental density (∼1.43 Mpc smoothing kernel) as a function of baryonic mass for different galaxy types... 67
3.18 The environment-dependent frequency of HI gas-to-stellar mass ratios greater and less than one for ECO+A galaxies. ... 68
3.19 The frequency of HI gas-to-stellar mass ratios greater and less than one as a function of group halo mass for central and satellite galaxies... 69
3.20 Characteristic distribution of HI gas-to-stellar mass ratio as a function of group halo mass for different galaxy types. ... 70
3.21 Halo mass distribution for blue early type galaxies in the ECO sample with different levels of HI gas. ... 71
3.22 Frequency and gas content of early-type UV-B disk hosts in the ECO+G sample. ... 72
4.1 RESOLVE deep S0 spectroscopy sample in the parameter spaces of model color vs. stellar mass and group halo mass vs. stellar mass. ... 83
4.2 Stellar cross-correlation profiles plus rotation and velocity dispersion measurements for observed targets in the RESOLVE deep S0 spectroscopy sample... 89
4.3 Cross-correlation profiles plus rotation/velocity dispersion measurements (cont.). ... 90
4.4 Cross-correlation profiles plus rotation/velocity dispersion measurements (cont.). ... 91
4.5 Cross-correlation profiles plus rotation/velocity dispersion measurements (cont.). ... 92
4.6 Cross-correlation profiles plus rotation/velocity dispersion measurements (cont.). ... 93
4.7 Cross-correlation profiles plus rotation/velocity dispersion measurements (cont.). ... 94
4.8 Cross-correlation profiles plus rotation/velocity dispersion measurements (cont.). ... 95
4.9 Cross-correlation profiles plus rotation/velocity dispersion measurements (cont.). ... 96
4.10 Cross-correlation profiles plus rotation/velocity dispersion measurements (cont.). ... 97
4.11 Cross-correlation profiles plus rotation/velocity dispersion measurements (cont.). ... 98
4.13 Cross-correlation profiles plus rotation/velocity dispersion measurements (cont.). ... 100
4.14 Cross-correlation profiles plus rotation/velocity dispersion measurements (cont.). ... 101
4.15 Cross-correlation profiles plus rotation/velocity dispersion measurements (cont.). ... 102
4.16 Cross-correlation profiles plus rotation/velocity dispersion measurements (cont.). ... 103
4.17 Cross-correlation profiles plus rotation/velocity dispersion measurements (cont.). ... 104
4.18 Stellar and group halo mass distribution of counterrotating and non-counterrotating RESOLVE S0s. ... 104
4.19 Color distribution of counterrotating and non-counterrotating RESOLVE S0s... 105
A.1 Morphology training set classification comparison. ... 114
LIST OF TABLES
2.1 Summary of Relevant UV-disk Definitions ... 12
2.2 Summary ofGALEX GI and Archival E/S0 Sample Properties ... 32
2.2 Summary ofGALEX GI and Archival E/S0 Sample Properties ... 33
3.1 ECO Sample Properties ... 80
LIST OF ABBREVIATIONS AND SYMBOLS
Cr concentration index morphology metric
E Elliptical galaxy
ECO Environmental COntext catalog
FWHM full width at half maximum
H0 Hubble constant
KDC kinematically decoupled core
KGB Kannappan et al. 2009
K-S Kolmogorov-Smirnov
Mb galaxy bimodality mass
Mbary galaxy stellar plus atomic gas mass
Mhalo group halo mass
MHI galaxy atomic gas mass
M∗ galaxy stellar mass
M⊙ solar mass
Mr absolute magnitude inrband
Mt gas-richness threshold mass
µ∆ surface mass density contrast morphology metric
NFGS Nearby Field Galaxy Survey
RESOLVE REsolved Spectroscopy Of a Local VolumE survey
Rvir group virial radius
Rx% galaxy radius at x% total light isophote (rband)
SDSS Sloan Digital Sky Survey
SSP simple stellar population
T07 Thilker et al. 2007
UV-B UV-Bright disk
XUV extended ultraviolet disk
CHAPTER 1: INTRODUCTION
The field of galaxy evolution is relatively young, dating only as far back as the mid-twentieth
century when a variety of galaxy formation/evolution models were first proposed (e.g., Eggen et al.
1962; Larson 1969; Toomre 1977). A great deal of progress has been made in the intervening
years, but some fundamental aspects of galaxy evolution remain uncertain. We still lack a complete
understanding of the physical processes that shape the evolution of galaxies in the real universe, since
many processes that are predicted in galaxy formation/evolution models are difficult (or impossible)
to observe in action. In this work, our goal is examine observational signatures of the existence
of one such predicted process, known as galaxy disk regrowth. Building on the prior observational
evidence of Kannappan et al. (2009, hereafter KGB) for disk regrowth, we seek new constraints on
the observed frequency, significance, and conditions of this process.
In the next section, we provide further background on aspects of galaxy evolution that are
relevant to our consideration of disk regrowth. In§1.2 and 1.3, we provide an overview of the galaxy
samples and approaches used in this research. In §1.4, we provide a brief summary of the major
results of this thesis.
1.1 Background
In the prevailing hierarchical, cold dark matter model of galaxy formation (e.g., Lacey & Cole
1993), galaxies are thought to build up over time in a successive series of mergers and acquisitions.
Each merger or significant acquisition of material has the potential to alter a galaxy’s morphology. In
general, spheroidal galaxy components result from mergers dominated by stellar dynamics in which
pre-existing disk components are typically destroyed (e.g., Toomre & Toomre 1972; Steinmetz &
Navarro 2002). In the case of mergers that involve either galaxies with significant gas or later external
gas accretion onto the merger remnant, stellar disks may potentially be retained or regenerated at
later times (e.g., Steinmetz & Navarro 2002; Barnes 2002; Governato et al. 2007; Hopkins et al.
2009).
Spiral galaxy morphology is characterized by both a central spheroidal bulge and an extended,
or spheroid plus smooth outer disk configurations, are often thought to result from galaxy-galaxy
mergers, although the E/S0 galaxy population is potentially a heterogeneous one with a variety of
proposed formation channels that also include gas stripping and/or disturbance of spirals in a
larger-scale potential (e.g., Gunn & Gott 1972; Moore et al. 1998). Through hierarchical merging processes,
spiral galaxies are predicted to transform into spheroid-dominated E/S0s but also subsequently
regrow new disks if sufficient gas to fuel this process is available (e.g., Baugh et al. 1996; Steinmetz
& Navarro 2002; Governato et al. 2007).
A number of observational clues pointing to the occurrence of this process have recently emerged,
primarily centered on the population of “blue-sequence” E/S0 galaxies, which inhabit the
star-forming sequence in color vs. stellar mass space alongside spirals (KGB). The existence of such
E/S0s contradicts the traditional idea that E/S0s are “red and dead” systems, devoid of recent star
formation activity. KGB find that the blue-sequence E/S0 population becomes most common at
low stellar masses, below the so-called “gas-richness threshold” mass Mt ∼ 5×10⁹M⊙. Further
work has corroborated that such galaxies are associated with large gas reservoirs, which are typically
sufficient to fuel significant stellar mass growth on several Gyr timescales (Wei et al. 2010). Stark
et al. (2013) also find evidence for the growth of both gas and stellar disks in blue-sequence E/S0s.
The link between this blue-sequence E/S0 population and a particular mass scale associated with
gas richness raises the intriguing possibility that the existence of blue-sequence E/S0s is tied to a gas
acquisition channel that depends on mass, such as the theorized “cold mode” gas accretion process
(e.g., Birnboim & Dekel 2003; Kereˇs et al. 2005). Recent simulation results have challenged the
theory of cold mode gas accretion, inferring that most gas accreted onto galaxies actually arrives in
a heated form (e.g., Nelson et al. 2013). However, such results have retained an important aspect of
the cold-mode accretion theory: that gas accretion is most effective in group halos with low masses
(e.g., Nelson et al. 2013; Birnboim & Dekel 2003; Kereˇs et al. 2005). Such halos also tend to host
central galaxies with low stellar masses, similar to those typical of blue-sequence E/S0s.
In this thesis, we consider the blue-sequence E/S0 population to be a significant population
of interest as we work towards observational determinations of the frequency, significance, and
conditions of E/S0 disk regrowth. This work provides new constraints on the processes related to
the morphological transformation of galaxies and, more generally, on the prevalence of galaxy growth
1.2 Galaxy Samples
We analyze three primary galaxy samples in this work, which are largely subsets of the Nearby
Field Galaxy Survey (NFGS; Jansen et al. 2000a,b), the Environmental COntext (ECO; Moffett et
al., in prep., Chapter 3) catalog, and the REsolved Spectroscopy Of a Local VolumE (RESOLVE;
Kannappan et al., in prep.) survey.
In Chapter 2, we consider a broad E/S0 sample drawn largely from the NFGS. The NFGS is a
sample of 196 galaxies subselected from the first CfA Redshift Survey sample (Huchra et al. 1983),
which carries a B-band apparent magnitude selection. The NFGS sample was chosen to reflect both the morphology and luminosity distributions of its parent sample but was also selected with
an effective apparent size limit to allow spectroscopic observations on an instrument with fixed slit
length by including the brightest, physically largest objects only at the greatest distances sampled
(Jansen et al. 2000b). The NFGS includes a variety of low and high density environments, although
explicit environment selections were not made other than the omission of Virgo Cluster galaxies to
guard against cluster dominance of the sample.
The analysis of Chapter 2 primarily employs ultraviolet and near-infrared imaging obtained
for GALEX observing program GI3-0046 and Spitzer observing program GO-30406 (both PI S.
Kannappan). NFGS E/S0 galaxies with stellar masses below∼4×10¹⁰M
⊙, where blue-sequence
E/S0s are observed in the largest numbers (KGB), were targeted for these observing programs. In
addition to the NFGS galaxies, we incorporate E/S0s from the “HyperLeda+” sample of KGB, a
cross matched catalog data compilation that includes HyperLEDA, Sloan Digital Sky Survey (SDSS)
data release 4, and Two Micron All Sky Survey sources (Paturel et al. 2003; Adelman-McCarthy
et al. 2006; Jarrett et al. 2000). We use only E/S0s that are consistent with the NFGS selection
criteria and have available archivalGALEX and Spitzer images of similarly high quality to those
from our program observations. Our combined sample then consists of 38 E/S0 galaxies, with 25
drawn from the NFGS and 13 drawn from the “HyperLeda+” compilation.
For the analysis of Chapter 3, we expand to much larger statistical samples, with a primary
focus on the newly created ECO catalog (Moffett et al., in prep.). While large galaxy samples like
those now available from the SDSS database represent a powerful tool for studying galaxy
proper-ties statistically, such samples can also mask important details through failures of automated data
large catalog samples are its high, well-calibrated level of completeness and its high-quality
photo-metric measurements, which have incorporated human inspection/interaction to improve estimates
of photometric properties when fully automated methods fail.
The ECO catalog incorporates galaxy identifications and redshifts from multiple existing galaxy
catalogs, including the RESOLVE (Kannappan et al., in prep.), Updated Zwicky Catalog (Falco et al.
1999), SDSS data release 6, 7, and 8 (Adelman-McCarthy et al. 2008; Abazajian et al. 2009; Aihara
et al. 2011), HyperLEDA (Paturel et al. 2003), GAMA (Driver et al. 2011), 2dF (Colless et al. 2001),
and 6dF (Jones et al. 2009) databases. ECO encompasses a volume of over 500,000 Mpc3, including the “A-semester” region of RESOLVE. Over 15,000 galaxies are considered for membership in the
final ECO sample, which is defined based on membership in groups whose centers lie within the
ECO volume and on estimates of galaxy baryonic mass (stars plus gas) that can be made only after
our custom photometric measurements have been carried out. The final ECO catalog sample with
an approximate baryonic mass limit of 109.3M
⊙ consists of just under 7,000 galaxies and traces the
wide natural variety of galaxy environments contained within the large contiguous volume selection.
Subsets of the RESOLVE survey catalog are also used in both Chapter 3 and 4. In Chapter 3,
we primarily use the RESOLVE “B-semester” volume as a comparison sample that is even more
complete than ECO, forming the basis of completeness correction factors applied to the ECO
mem-bership. RESOLVE was designed to be a baryonic-mass-limited sample with extraordinarily high
completeness, enabled in large part by our ongoing redshift completion efforts (Kannappan et al., in
prep.). RESOLVE sample galaxies have been morphologically classified by RESOLVE team
mem-bers, an effort that I have led (see Appendix A). RESOLVE encompasses both “A-semester” and
“B-semester” volumes, which add to a total volume of approximately 50,000 Mpc3 and include
di-verse galaxy environments. A major goal of RESOLVE is to obtain galaxy kinematic measurements
for all survey galaxies inside these regions.
For the analysis of Chapter 4, we target a subsample of RESOLVE S0 galaxies for special
extra-deep spectroscopic observations, which were carried out with UNC SOAR guaranteed time and
NOAO programs 2010A-0110 (PI M. Norris), 2010B-0594, and 2011A-0164 (both PI A. Moffett).
Within the pool of RESOLVE S0s for which we can expect to reliably measure kinematics and
resolve potential velocity substructure, we have targeted 59 galaxies that sample the RESOLVE
ranges of environments, stellar masses, and colors. As a sample intended for the identification of
secondary stellar disks in S0s, this sample is unique in its selection from a single diverse,
less biased estimation of secondary disk frequencies in various parameter-space regimes than has
been possible with previous studies using samples focused only on bright galaxies, with inconsistent
literature selections, and/or with poorly quantified environment distributions (e.g., Kuijken et al.
1996; Bettoni et al. 2001; KGB). As this project is a work in progress, we analyze only those targets
for which final data reduction has been completed in Chapter 4.
1.3 Research Approaches
In this thesis, we take multiple approaches to the problem of determining the frequency,
signif-icance, and conditions of E/S0 disk regrowth. In Chapter 2, we explore this problem by examining
the frequency and characteristics of UV-detected disks representing recent star formation in E/S0
galaxies. Following the original work on by-eye identifications of extended UV (XUV) disks (Thilker
et al. 2005; Gil de Paz et al. 2005; Thilker et al. 2007), we define purely quantitative classifications
for XUV disks and a new class of UV-Bright (UV-B) disks, which are specifically defined to require
a&10% disk mass contribution by a young stellar population.
Building on this initial small sample study, we further constrain the conditions of disk regrowth
through consideration of the much larger, newly created ECO catalog in Chapter 3. As tracers of
disk regrowth, we focus on the populations of blue-sequence E/S0s, gas-dominated galaxies, and
E/S0 UV-B disk hosts. To identify E/S0s in ECO we use a semi-quantitative morphology
classifica-tion method that combines by-eye classificaclassifica-tions (where available) with a quantitative morphology
discriminant calibrated on available ECO and RESOLVE by-eye morphology classifications.
Gas-dominated galaxies are identified primarily through the overlap of ECO with the public Arecibo
Legacy Fast ALFA (ALFALFA)α.40 catalog of HI mass estimates (Haynes et al. 2011) but also us-ing the “photometric gas fraction” technique (Kannappan 2004) to assign HI mass estimates based
on the tight correlation betweenu−J color and gas to stellar mass ratio found by Kannappan et al. (2013).
Finally in Chapter 4, we take an even more direct approach to identifying disk regrowth through
examination of kinematic signatures of secondary stellar disks in S0 galaxies. Using deep SOAR
tele-scope and Goodman Spectrograph longslit observations focused on stellar absorption line features,
we extract the detailed stellar velocity profile structure of our targets using cross-correlation with
stellar population templates. We also estimate stellar rotation velocities and velocity dispersions
using a template fitting procedure. We then use the spatial variations of the velocity structure and
presence of two cospatial stellar disks.
1.4 Results Summary
In Chapter 2, we find high, approximately 40% frequencies of both XUV and UV-B disks in a
low-mass E/S0 galaxy sample, with an even higher combined UV disk frequency of approximately
60% since the populations do not always overlap. UV-B disk hosts are found to be a population
of particular interest in connection with the disk regrowth phenomenon, as these galaxies display
relatively significant (&10% by mass) recent disk growth, preferentially blue optical outer-disk colors,
and high atomic gas content compared to E/S0s not hosting UV-B disks. Nearly all of the
blue-sequence E/S0s in the sample below the gas-richness threshold stellar mass host UV-B disks, which
supports the association of low-mass, blue-sequence E/S0s with significant disk growth and reinforces
the idea that mass-scale dependent processes may be important in enabling such growth.
In Chapter 3, we find further evidence that mass scales play an important role in disk growth,
with the focus now on the masses of the group halos that galaxies inhabit. Below group halo mass
∼1011.5M
⊙, we find that blue E/S0s, gas-dominated galaxies, and UV-B disk host galaxies become
significantly more common, supporting a link between disk regrowth and this low group halo mass
regime. We likewise find that the increase in spiral galaxy frequency at low group halo mass and
the typically similar environments of low baryonic mass (.1010M
⊙) E/S0 and spiral galaxies are
both consistent with a model in which E/S0 galaxies can regrow spiral disks in low group halo mass
environments.
In Chapter 4, we find direct, kinematic evidence for secondary stellar disks in 6 S0 galaxies, which
corresponds to a frequency of approximately 25% in our current sample. Given the small number
statistics, we find no statistically significant differences in the stellar masses, environments, or colors
of the S0s that host secondary stellar disks compared to those that do not. However, we find that
the majority of our targets with secondary stellar disks inhabit low group halo mass environments,
suggesting that our full sample could yield more definitive results on the environment distribution
CHAPTER 2: EXTENDED UV DISKS AND UV-BRIGHT DISKS IN LOW-MASS E/S0 GALAXIES
We have identified 15 XUV (extended ultraviolet) disks in a largely field sample of 38 E/S0
galaxies that have stellar masses primarily below∼4×10¹⁰M
⊙ and comparable numbers on the red
and blue sequences. We use a new purely quantitative XUV disk definition designed with reference
to the “Type 1” XUV disk definition found in the literature, requiring UV extension relative to a
UV-defined star formation threshold radius. The 39±9% XUV-disk frequency for these E/S0s is
roughly twice the ∼20% reported for late-type galaxies (although differences in XUV-disk criteria
complicate the comparison), possibly indicating that XUV disks are preferentially associated with
galaxies experiencing weak or inefficient star formation. Consistent with this interpretation, we find
that the XUV disks in our sample do not correlate with enhanced outer-disk star formation as traced
by blue optical outer-disk colors. However, UV-Bright (UV-B) disk galaxies with blue UV colors
outside their optical 50% light radii do display enhanced optical outer-disk star formation as well
as enhanced atomic gas content. UV-B disks occur in our E/S0s with a 42+9−8% frequency and need
not coincide with XUV disks, thus their combined frequency is 61±9%. For both XUV and UV-B
disks, UV colors typically imply<1 Gyr ages, and most such disks extend beyond the opticalR25
radius. XUV disks occur over the full sample mass range and on both the red and blue sequences,
suggesting an association with galaxy interactions or another similarly general evolutionary process.
In contrast, UV-B disks favor the blue sequence and may also prefer low masses, perhaps reflecting
the onset of cold-mode gas accretion or another mass-dependent evolutionary process. Virtually all
blue E/S0s in the gas-rich regime below stellar massMt∼5×10⁹M⊙ (the “gas-richness threshold
mass”) display UV-B disks, supporting the previously suggested association of this population with
active disk growth.
2.1 Introduction
In hierarchical models of galaxy formation, galaxies often experience mergers that result in
early-type remnants. Disk structures are also predicted to regrow around some of these remnants
late-type morphologies. Observationally, a transition stage from late to early types, brought about
by interactions, may be glimpsed in the population of E+A (post-starburst) galaxies (e.g., Yang
et al. 2008). However, observational evidence for the opposite predicted transition, that from
early-to late-type morphology, has remained more elusive.
The ultraviolet regime offers a natural choice for studying possible disk growth. Recently,GALEX
has enabled the discovery of extended ultraviolet (XUV) disks (e.g., Thilker et al. 2005; Gil de Paz
et al. 2005). These XUV disks show ongoing star formation beyond the optical radii and traditional
star formation thresholds of late-type galaxies, providing an intriguing new look at galaxy disk
growth in progress atz∼0. In a nearby galaxy sample emphasizing late types, Thilker et al. (2007, hereafter T07) find a 20% incidence of “Type 1” XUV disks, characterized primarily by large radial
extents and structured UV morphologies (versus “Type 2” XUV disks, which consist of less-extended
UV-bright zones without morphological specifications).
GALEX has provided a useful platform for detection of star formation in early-type galaxies
as well. Kauffmann et al. (2007) find that extended UV emission is common in high-mass
bulge-dominated galaxies, likely associated with modest reservoirs of cold gas in the disk that help fuel
bulge and black hole growth. Focusing specifically on galaxies with E/S0 morphology, extended
UV emission has also been seen in ring structures around several S0 galaxies (Donovan et al. 2009;
Cortese & Hughes 2009), and Thilker et al. (2010) recently identified an XUV disk around the
nearby S0 NGC 404. Salim & Rich (2010) have also identified several z<0.12 early-type galaxies with extended UV structures in far-ultravioletHST imaging.
The presence of XUV disks, however, can have a variety of interpretations. T07, for example,
suggest an association of XUV disks with interactions or minor perturbations. The raw material
for XUV disk formation could be acquired externally from such interactions or from fresh cosmic
gas accretion, either of which may be consistent with the extended disks and rings of HI commonly
observed around E/S0s (e.g., Sage & Welch 2006; Morganti et al. 2006; Oosterloo et al. 2007;
Oosterloo et al. 2010). Another possibility for creating extended disks in early types is the fallback
of tidal tails in late stage mergers (e.g., Hibbard & Mihos 1995; Barnes 2002; Naab et al. 2006).
The evolutionary significance of disk growth may be greater in some of these scenarios than
others. Of particular interest is the scenario of cold mode gas accretion (e.g., Birnboim & Dekel
2003; Kereˇs et al. 2005; Dekel & Birnboim 2006; Kereˇs et al. 2009), which may be linked to disk
building in “blue-sequence E/S0s,” a recently identified morphologically defined population of E/S0
E/S0s are primarily found in non-cluster environments (KGB), and as shown in KGB and Wei et al.
(2010), many display global gas reservoirs and specific star formation rates that could allow the
growth of significant new disks on relatively short timescales.
Cold mode accretion occurs primarily below a critical shock heating stability mass (e.g., Birnboim
& Dekel 2003; Kereˇs et al. 2005); this mass may coincide with an observed “gas-richness threshold”
stellar mass at Mt ∼ 5×10⁹M⊙, below which blue-sequence E/S0s become suddenly common,
along with gas-dominated galaxies (Kannappan 2004; Kannappan & Wei 2008; see KGB regarding
corrected mass scale). This low-mass regime may be where the most active E/S0 disk growth occurs
(KGB). Blue-sequence E/S0s also occur in modest numbers up to stellar masses of∼3×10¹⁰M ⊙,
the bimodality mass of Kauffmann et al. (2003), above which classical spheroids with older stellar
populations begin to dominate.
To better understand the significance of recent disk star formation in E/S0s, we concentrate on
the mass regime up to the bimodality mass and seek to quantify the incidence of extended-disk
star formation in a representative, largely field sample of E/S0s. In §2.2, we introduce our chosen
sample and basic data. In§2.3, we discuss various methods for identifying extended star formation,
adopting the T07 Type 1 XUV-disk designation as a reference. We then propose modifications
to this definition to create a purely quantitative classification that reflects recent extended disk
star formation in early types. Since we are interested in the presence of disk star formation in a
general sense, we also introduce an alternative UV-Bright (UV-B) disk definition, which can be
used to identify significant disk star formation not necessarily extended relative to traditional star
formation thresholds. In §2.4-2.5, we present demographics and properties of our classified XUV
and UV-B disks, and in§2.6 we compare our results to various formation scenarios and results from
the literature. Finally, we provide a brief summary in§2.7.
2.2 Sample and Data Reduction
Our “GALEX GI” sample of 30 E/S0s was defined forGALEX program GI3-0046 and primarily
draws on the Nearby Field Galaxy Survey (NFGS, Jansen et al. 2000a,b). The sample was selected
to encompass all of the NFGS blue-sequence E/S0s and the majority of NFGS red-sequence E/S0s
in the stellar mass range below∼4×10¹⁰M
⊙(Fig. 2.1), where many E/S0s have substantial gas and
settled blue-sequence E/S0s with the potential for disk regrowth are observed (KGB). The NFGS
8
9
10
11
12
log stellar mass (M
sun)
0.0
0.5
1.0
1.5
2.0
(U-R)
i
color
NFGS E/S0
NFGS Sp/Irr
GALEX E/S0 Sample
Figure 2.1GALEX GI and archival E/S0 sample in color-stellar mass space. The small grey symbols indicate galaxies in the Nearby Field Galaxy Survey, the parent sample for the majority of our E/S0s (§2.2). The dashed line divides the red and blue sequences, and the vertical line marks the
0 50 100 150 arcsec 0 50 100 150 200 arcsec
NUV+FUV
NUV+FUV
a
a
DSS-II red DSS-II red0 20 40 60 80
R (arcsec) 30
25 20
µ
(AB mag/square arcsec)
RUVSF
b
IRAC 3.6µm NUV FUV
NUV PSF conv.
Figure 2.2 Images and surface brightness profiles of NGC 4117, one of several XUV-disk galaxies identified on the red sequence. (a)GALEX NUV+FUV color composite with overlay of the NUV-derived star formation threshold,RUVSF (see§2.3). The inset shows the DSS-II red image with the
same overlay for scale. (b) GALEX and Spitzer surface brightness profiles. A vertical line marks
RUVSF. The black dotted line represents a profile extracted from the 2D (re)convolution of the NUV PSF with the NUV galaxy light withinRUVSF(see§2.3). The inset shows the (re)convolved image.
evolution. In addition to 25 NFGS E/S0s, the sample includes 5 blue-sequence E/S0s from the
“HyperLeda+” sample of KGB with comparable archival data.
To augment this sample, we have cross-matched all M∗ .4×1010M⊙ E/S0s in the
“Hyper-Leda+” sample of KGB with theGALEX andSpitzer archives to find sources imaged with exposure
times similar to those for our prior programs. Excluding Virgo Cluster members from this
cross-matched sample (consistent with the NFGS selection criteria), we find eight additional E/S0s for
our “archival” sample.
Our primary data areGALEX NUV and FUV images at least as deep as those of the Medium
Imaging Survey (MIS). For comparison of UV and optical morphologies, we employ DSS-II red
images (http://archive.stsci.edu/dss/). For profile analysis, we compare to Spitzer IRAC 3.6 µm imaging mostly obtained for program GO-30406 with typical exposure times of 480 s (although
several archival sources have exposure times down to 120 s). The 3.6µm imaging serves as a proxy forK-band data, assuming the Leroy et al. (2008) conversionI3.6= 0.55IK (MJy ster−1). We use
the notation K80 to denote the 80% light radius calculated using the 3.6 µm data, to indicate the direct analogy with theK80 radius of T07.
Table 2.1. Summary of Relevant UV-disk Definitions
Definition Extent Criterion Recent Star Formation Criterion
T07 Type 1 XUV UV visually identified beyondRUVSF structured, bright UV with morphology different from optical
Purely Quantitative XUV UV>3σabove PSF shelf beyondRUVSF NUV−Kconsistent with young population
UV-B blue UV color beyond opticalR50 NUV−Kconsistent with&10% young population
et al. (2007). We apply foreground extinction corrections based on Schlegel et al. (1998) and Cardelli
et al. (1989), but correction factors for internal extinction are not applied (consistent with prior
XUV-disk studies). Spitzer IRAC 3.6µm imaging is also pipeline processed and calibrated according to procedures outlined in the IRAC Instrument Handbook1. In addition to the pipeline processing, we
apply a median background subtraction procedure.
From these data, we extract radial surface brightness profiles and magnitudes by totaling fluxes
in elliptical apertures. The parameters of these ellipses were determined from isophotal fits to optical
images (as reported in Jansen et al. 2000a for NFGS galaxies) and newly derived using the IRAF
ELLIPSE task and SDSS g-band imaging (Abazajian et al. 2009) for non-NFGS sample galaxies (parameters for non-NFGS galaxies in theGALEX GI sample from Stark et al., in prep). Detection
and masking of non-galaxy sources in these images was accomplished using SExtractor (Bertin &
Arnouts 1996). For calculation of comparativeGALEX and Spitzer photometry, our UV and IR
images were convolved with an appropriately sized Gaussian kernel to yield degraded images with
the same PSF FWHM as the lowest-resolution NUV images (FWHM∼4.9′′).
2.3 Identifying Extended Star Formation
Here we discuss UV-based methods for identifying galaxies with recent star formation in disks
and extended disks. Ideally, we seek to employ a purely quantitative method of classification. We
also seek to answer two distinct questions about extended star formation in our sample, for which
different specific identification methods are relevant. First, does it occur beyond traditional star
formation thresholds? This question motivated the original “Type 1” XUV-disk definition of T07,
which we take as a reference in designing a purely quantitative XUV disk definition (§2.3.2). Second,
is it significant (in a mass-contribution sense) in the optical outer disks of galaxies? This question
motivates our introduction of a new “Ultraviolet-Bright” (UV-B) disk definition (§2.3.3; see also
Table 2.1 for a summary of definitions used in this paper).
We note that extension relative to UV-defined star formation thresholds does not necessarily
imply extension beyond the full optical extent of the galaxy. Thus, another natural question about
extended star formation is: does it extend beyond the optical galaxy? We will treat the answer to
this question as a matter of investigation rather than definition, given that the radial extent of star
formation relative to the optical disk may behave fundamentally differently in E/S0s vs. late-type
galaxies, for example, in the case of inside-out disk (re)growth.
2.3.1 Prior Definitions
A natural choice for answering our first guiding question, concerning star formation extended
beyond traditional star formation thresholds, is the T07 “Type 1” XUV-disk definition. T07 define
Type 1 XUV disks as displaying more than one structured UV-bright emission complex beyond
a centralized surface-brightness contour corresponding to the expected star formation threshold
(equated to an NUV surface brightness of 27.35 AB mag arcsec−2by T07, roughly matching typical
Hαand HI thresholds; we label the corresponding radiusRUVSF). In addition to extension relative to this UV contour, the definition requires that the XUV emission take on a different morphology
from any underlying optical emission. T07 also define a Type 2 XUV-disk classification, but this is
not geared towards tracing star formation beyondRUVSF, and an issue2with the definition implies
that we cannot apply it uniformly to early types. Thus, we do not consider Type 2 XUVs further
here and henceforth are referring to Type 1 XUVs when we reference T07 XUV designations.
The T07 XUV definition is the basis for our new XUV definition (described in§2.3.2), but for
completeness, we note that several other measures of bright and/or extended UV disks exist, most
requiring high spatial resolution. For example, visual classification of UV structures such as rings
is common in the literature (e.g., Cortese & Hughes 2009; Salim & Rich 2010; Marino et al. 2011).
A quantitative variant on extended UV disk identification involves measuring individual UV knots
in the outer regions of galaxies (e.g., Zaritsky & Christlein 2007). Another quantitative approach
lacking the high resolution requirement is the blue integrated UV-color cut of Kauffmann et al.
(2007). However, with an integrated color cut alone the correspondence between blue color and
extended star formation is not necessarily one-to-one. We modify this approach by adopting an
outer-disk UV color cut in our UV-B disk definition (see §2.3.3), addressing our second guiding
question regarding significant star formation in the optical outer disks of galaxies.
2The Type 2 XUV-disk classification requires FUV(AB) −K(AB) ≤4 in a large, optically low surface brightness
zone withinRUVSF but outsideK80. Here “large” means an area at least seven times that enclosed withinK80.
The Type 2 definition was developed for a late-type sample and has proved problematic to apply to E/S0s, in that
RUVSFoften lies inside theK80radius, or lies outside but not as far as the definition requires (see also Moffett et al.
2.3.2 A New Purely Quantitative XUV Disk Definition
To answer whether or not star formation occurs beyondRUVSF, we adopt the T07 XUV-disk definition as a useful reference definition and construct a purely quantitative alternative. Table 2.2
indicates the distribution and properties of the 16 XUVs we identify by the original T07 definition;
see Figure 2.2 for an example. The primary criteria of the T07 XUV-disk classification are UV
extension relative to RUVSF and association of this emission with recent star formation. In the following sections, we discuss issues with these criteria that motivate elements of our modified
definition, including consideration of possible UV upturn contributions and of the extended PSF
shelf in theGALEX NUV.
Ensuring Young Ages
A possible concern in identifying XUV disks in E/S0s is the prevalence of the UV upturn, i.e.,
UV emission associated with old stellar populations (O’Connell 1999). To mitigate this issue, we
identify XUV disks in the NUV (in contrast to T07’s use of a combination of FUV and NUV data)
since the UV upturn becomes stronger at FUV wavelengths. Nonetheless, 5 of the 16 XUVs we find
using the original T07 XUV-disk definition have XUV-disk region FUV−K colors red enough to be consistent with a>1 Gyr SSP (simple stellar population, as in T07 Figure 1).
In general, the T07 requirement that UV emission take on a different morphology from any
underlying optical emission should preclude classifying an underlying old population as a separate
XUV disk. However, the subjective requirement of structured emission can be difficult to apply
consistently to samples like our own: our galaxies tend to have smaller angular sizes than those of
T07, implying greater blurring at the low angular resolution ofGALEX, so UV structure may be lost
or be difficult to assess. An XUV-disk definition relaxing this requirement of structured emission has
recently been applied by Lemonias et al. (2011) to a sample containing both early and late types,
and they experiment with using an FUV−rcut to ensure young populations.
Taking a similar approach but focusing on the NUV, we consider color cuts based on a suite of
composite Bruzual & Charlot (2003) stellar population models using a Salpeter (1955) initial mass
function, as described in KGB (see their §2.3). These composite models are built from two (young
and old) components, with set age options, combined in a variety of ratios to create a large model
grid. Similar to the grid of KGB, the young SSP age options are 5, 25, 100, 290, 640, and 1000 Myr,
while the old SSP age options are 1.4, 2.5, 3.5, ..., 13.5 Gyr. The young SSP contributions can be
in the grid are Z = 0.008, 0.02, and 0.05. The young SSP can have 11 different extinction values,
but here we consider only zero-extinction models for comparison to observed outer-disk colors. We
make no explicit restriction on the metallicity combinations of the composite population models we
consider, although we find that consideration of metallicity restrictions that could be reasonable in
specific circumstances, such as Zyoung ≤Zold or Z≤Zsolar, do not substantially change the model
color distributions we report (see Figures 2.3 and 2.4).
In one version of their XUV-disk classifications, Lemonias et al. (2011) used a color cut at
FUV-r = 5, designed to separate galaxies with recent XUV-disk star formation from those containing evolved populations (divider based on empirical red/blue sequence division from Wyder et al. 2007).
However, based on consideration of our stellar population model grid (Fig. 2.3), this color
selec-tion can potentially exclude up to ∼30% of the composite populations with recently star-forming
components.
Thus, we search for a different color selection that better encompasses composite stellar
popula-tions with young components. As a result of the aforementioned difficulties with using the FUV for
this purpose and the practical usefulness of making such a selection in bands where data coverage is
more complete, we prefer the NUV over the FUV. We find that NUV-based colors indeed display a
more cleanly defined region where populations are predominantly old (compare Figures 2.3 and 2.4).
From the model color distributions, it is apparent that the fraction of purely old models increases
significantly beyond NUV−K = 5, which is where young model fractions start to decline as well. Thus, we choose to exclude XUV disks with NUV−K > 5.
Ensuring Extended Emission
When applying the original T07 XUV-disk definition, classifiers must subjectively identify the
presence of extended emission beyondRUVSF. However, when classifying XUVs fromGALEX NUV imaging, especially when considering galaxies with small angular sizes, the∼45′′ shelf in the NUV
PSF (http://www.galex.caltech.edu/researcher/techdoc-ch5.html) may affect this judgment. Thus,
to design a quantitative test for extension relative toRUVSF, we require that the NUV flux detected
outsideRUVSFis significantly greater than (>3σabove) the flux redistributed into this region by an artificial second convolution of the NUV PSF with the fluxinside this radius. This (re)convolution
is in addition to the natural convolution inherent in the images; see Figure 2.2 for an illustration.
We note that for the XUV disks we have identified based on the original, subjective T07 definition,
Final Definition
In summary, for our “purely quantitative XUV-disk” designation, we ensure UV emission beyond
RUVSF by requiring >3σemission above the NUV PSF shelf, and we ensure recent star formation by requiring NUV−K < 5 in the XUV-disk region beyondRUVSF. Properties and demographics of these XUV disks are presented in§2.4 (see also Table 2.2) and largely imply that this population is
associated with recent but not necessarily significant outer-disk star formation.
With our new definition, we identify a similar fraction of XUV disks as when applying the
traditional T07 Type 1 XUV-disk definition (see Table 2.2, Figure 2.5), but the overlap between
these classifications is not perfect. Approximately 70% of the traditionally identified XUVs are
among XUVs identified with our purely quantitative method. In cases where the classifications do
not overlap, the reason is either (1) insufficiently blue NUV−K color to satisfy the new definition’s color cut or (2) UV disk morphology not distinct enough from the optical to satisfy the T07 Type 1
definition. Our color cut is more conservative in rejecting XUV disks that may contain evolved
populations than the T07 requirement of morphological differences compared to the optical. On the
other hand, the T07 morphology requirement may recover XUVs with even weaker or more incipient
star formation than our definition allows, where this star formation has not built up a detectable
optical counterpart.
2.3.3 UV-Bright (UV-B) Disk Definition
To answer whether or not significant UV-detected star formation occurs in the optical outer-disk
region, irrespective of extent beyondRUVSF, we construct a second quantitative classification. We designate a population with a&10% young component by mass as one containing “significant”
star formation (in practice for our model set>8%,§2.3.2). Considering the aforementioned stellar
population model grid, a more conservative color cut than was used in the purely quantitative
XUV case appears necessary to select galaxies containing significant recent star formation (Fig.
2.4). Requiring NUV−K <4.5 presents a natural choice for this definition, given the falloff in the fraction of models with a&10% young population component beyond this value.
To quantify our region of interest for this definition, i.e., the optical outer disk, we select the
region beyond the optical 50% light radius. Thus, our UV-B disk classification requires only NUV−K <4.5 beyond the optical 50% light radius. The properties and demographics of the UV-B disks are presented in§2.5 (see also Table 2.2) from which we conclude that these galaxies correlate well with
−2
0
2
4
6
8
FUV−r
0.0000
0.1000
0.2000
0.3000
0.4000
0.5000
Relative Frequency
Young comp. age 1 Gyr (>8%) Young comp. age 1 Gyr (1−8%) No 1 Gyr comp.
Figure 2.3 FUV−r color for selected composite stellar population models (grid as described in
§2.3.2), illustrating issues with using this color as a clean young/old population divider. Blue and
−4
−2
0
2
4
6
8
NUV−K
0.0000
0.0500
0.1000
0.1500
0.2000
0.2500
0.3000
0.3500
Relative Frequency
Young comp. age 1 Gyr (>8%) Young comp. age 1 Gyr (1−8%) No 1 Gyr comp.
UV−B cut
XUV cut
Figure 2.4 NUV−K color for selected composite stellar population models (grid as described in
§2.3.2), illustrating NUV−K cuts chosen for our analysis. Blue and green histograms represent
numbers of models with >8% and 1-8% young population contributions by mass, normalized to the total numbers of such models. The red histogram represents numbers of models containing no young (age ≤1 Gyr) component, normalized to the total numbers of such models. It is apparent that the fraction of purely old models increases significantly beyond NUV−K = 5, so we use this value to reject XUV disks likely to contain evolved populations as described in §2.3.2. A more
conservative color cut at NUV−K = 4.5 appears necessary if we wish to select populations with a significant young population as in our UV-B disk classification (here >8%, corresponding to the
8 9 10 11 12 0.0
0.5 1.0 1.5 2.0
(U-R)
i color
Type 1 XUV-disk E/S0
NFGS E/S0 NFGS Sp/Irr GALEX E/S0 Sample
8 9 10 11 12
log stellar mass (Msun)
XUV-disk E/S0
8 9 10 11 12
UV-B disk E/S0
Figure 2.5 GALEX GI and archival E/S0 sample in color-stellar mass space (as in Figure 2.1), showing UV disks (asterisks) identified according to three different classifications: (left) the original T07 XUV-disk definition, (middle) our new, purely quantitative XUV definition, and (right) the UV-B disk definition.
2.4 XUV Disk Properties and Demographics
With our purely quantitative definition, we identify XUV disks in 15/38 or 39+9−9% of our E/S0
sample (see Table 2.2 for the identifications and Fig. 2.8 for images of classified XUVs). These
XUV-disk classifications supersede the preliminary, purely visual classifications of Moffett et al. (2010),
which were made without reference toRUVSF. In the following, we present the demographics and basic properties of the identified XUVs.
2.4.1 Extents and Ages
The XUV disks in our E/S0s can extend beyondR25, as has been found in Type 1 XUV disks for late types (e.g., Thilker et al. 2005; Gil de Paz et al. 2005; T07; see also Zaritsky & Christlein
2007). We find radial extents (to the last measured NUV point)∼0.7−2.3R25, with mean∼1.3R25
and ∼70% extending beyond R25. Relative to the older populations traced by near-IR light, the average radial extent of the young XUV-disk component in our E/S0s is∼2 times theK80 radius. Relative to the centralized younger populations traced by NUV light, the average radial extent of
our XUV disks is∼1.5 timesRUVSF.
Compared to XUV disks in late-type galaxies, our E/S0 XUV disks tend to be redder. The
reported outer-disk FUV−NUV colors of late-type XUV-disk galaxies in the literature range
pri-marily between small negative values and ∼0.5 (Thilker et al. 2005; Gil de Paz et al. 2005, 2007).
to the early-type XUV-disk galaxy NGC 404, Thilker et al. 2010). However, the contour atRUVSF
for our early-type XUVs tends to occur closer to K80 than it does for late-type XUVs (enclosing on average∼3 times the area of the K80contour versus∼15 for late types; see T07). Thus, redder XUV-disk colors in early types may simply indicate a greater contribution from the underlying old
stellar population than is typical for late types.
The XUV-disk FUV−NUV colors we compute for our E/S0s are consistent with <1 Gyr ages from simple stellar population models. We choose to report SSP-equivalent ages for our XUVs
in light of the inherent degeneracies involved in estimating separate old/young population ages
from composite population models. We note that age estimates from stellar population models are
affected by uncertainties in modeling the UV contribution from old stellar populations and will also
vary depending on the assumed star formation history. Comparing with Bruzual & Charlot (2003)
UV model colors for an instantaneous starburst with Z = 0.02 (as in T07 Figure 1), our average XUV-disk FUV−NUV color of∼1.4 corresponds to an SSP with an approximate age of 500 Myr.
One of our XUV-disk galaxies does have XUV-disk region FUV−K color red enough to be
consistent with a>1 Gyr SSP (as in T07 Figure 1). However, all of our XUV-disk galaxies, including this red FUV−K case, display independent indicators for recent or potential star formation, in the form of either Hαor HI detections in the NFGS or the literature.
2.4.2 Demographics
We find XUV disks in both red- and blue-sequence E/S0s and over a wide range in stellar mass
(Fig. 2.5). On the red sequence, the XUV-disk frequencies are 0+23% and 60+18
−20% above and below
the gas-richness threshold mass (at stellar massMt∼5×10⁹M
⊙, KGB), respectively. On the blue
sequence, the corresponding frequencies are 33+22−18% and 50±18%.
If we ignore mass dependence, we find no clear evidence for a preference in XUV-disk incidence
between red- and blue-sequence E/S0s. Assuming a probability for an XUV-disk galaxy to be on the
blue sequence equal to the overall sample blue-sequence fraction, binomial statistics yields a 46%
probability of obtaining at least the number of XUV-disk galaxies observed on the blue sequence
out of the total number of XUVs identified.
Likewise, if we ignore sequence dependence, we find that the XUV-disk galaxy stellar mass
distribution is not significantly different from that of the parent E/S0 sample (61% probability of
being drawn from the same distribution in a Kolmogorov-Smirnov test). Binning the data in mass
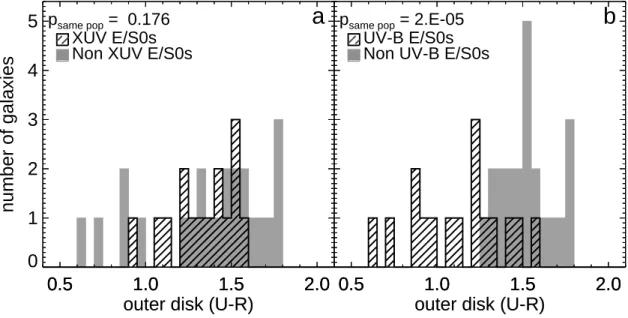
0.5
1.0
1.5
2.0
outer disk (U-R)
0.5
1.0
1.5
2.0
0.5
1.0
1.5
2.0
outer disk (U-R)
0
1
2
3
4
5
number of galaxies
p
same pop= 0.176
XUV E/S0s
Non XUV E/S0s
a
0.5
1.0
1.5
2.0
outer disk (U-R)
0.5
1.0
1.5
2.0
0.5
1.0
1.5
2.0
outer disk (U-R)
p
same pop= 2.E-05
UV-B E/S0s
Non UV-B E/S0s
b
2
3
4
5
6
NUV−K within UV extent
0.001
0.010
0.100
1.000
10.000
M
HI
/ M
*
UV−B Disk
XUV Disk
above and belowMt, although the significance of this difference is not high (∼1.8σconfidence). We note that XUV disks identified according to the original T07 definition have an even more
uniform color/mass distribution (Fig. 2.5). Considering the slope of the color-stellar mass sequences,
this difference is consistent with what one might expect as a consequence of our purely quantitative
XUV definition excluding XUV disks with the reddest colors.
2.4.3 Star Formation
Although our XUV disks reflect recent star formation, we find that they do not show substantial
recent star formation as traced by blue optical outer-disk colors (Fig. 2.6). Likewise, the E/S0s
with XUV disks do not show enhanced atomic gas content relative to the E/S0s without XUV disks,
instead yielding a 36% Kolmogorov-Smirnov test probability of the sameMH I/M∗distribution (Fig.
2.7). These possibly counterintuitive results imply that XUV disks are not necessarily associated
with strong star formation and may instead be associated with weak/incipient star formation due
to a process affecting the galaxy population broadly, an idea that we return to in§2.6.
We note that the T07 requirement of different UV-optical morphology may pick out weak star
formation to an even greater degree than our purely quantitative approach, since the UV-optical
morphology difference could imply that the UV-detected star formation is not substantial or
sus-tained enough to have built up an optical counterpart.
2.5 UV-B Disk Properties and Demographics
With the UV-B disk classification, we identify 16/38 or 42+9−8% of our sample as UV-B disks (see
Table 2.2 for identifications; Figs. 2.8 and 2.9 for images of classified UV-Bs). Although we find
similar frequencies of XUV and UV-B disks in our sample, and about half of the galaxies with UV-B
disks also host XUV disks, the overall properties and demographics of these two classes display a
number of differences, as we discuss in the following sections.
2.5.1 Extents and Ages
Similar to our quantitatively identified XUV disks, the UV-B disks we identify typically extend
beyondR25, with an average extent (to the last detected NUV point) of∼1.4R25and all extending beyondR25. The average UV-B disk extent relative to the near IR is slightly larger than for XUV disks at ∼2.3K80 while the average extent relative to the UV is smaller than for XUV disks at
The UV-B disk FUV−NUV colors we observe are also consistent with <1 Gyr SSP ages. For UV-B disk galaxies, the average FUV−NUV color outside the optical 50% light radius is∼0.6, which
corresponds to a slightly younger ∼300 Myr SSP-equivalent age than is found for XUV disks. No
UV-B disks display FUV−Kcolors red enough to imply SSP ages older than 1 Gyr.
2.5.2 Demographics
In contrast to the widespread distribution of XUV disks, UV-B disks are preferentially found on
the blue sequence and may prefer the low-mass regime as well (see color-mass distribution in Fig.
2.5).
If we ignore mass dependence, we find clear evidence for a preference in UV-B disk incidence
between red- and blue-sequence E/S0s. Assuming a probability for a UV-B disk galaxy to be on
the blue sequence equal to the overall sample blue-sequence fraction, binomial statistics yields a low
0.7% probability of obtaining at least the number of UV-B disks observed on the blue sequence out
of the total number of UV-Bs identified.
If we ignore sequence dependence, we find that the UV-B disk galaxy and full sample stellar
mass distributions have an 8% Kolmogorov-Smirnov test probability of being drawn from the same
distribution, which implies they are not conclusively distinct. Similarly, the UV-B disk frequencies
we calculate are 19+15−10% and 59 +12
−13%, above and belowMt respectively, which are more different
than in the XUV-disk case, but still only distinct at approximately 2σconfidence.
2.5.3 Star Formation
In contrast to XUV disks, the UV-B disks in our sampledocorrelate with elevated star formation
as traced by blue optical outer-disk color (Fig. 2.6). E/S0s with UV-B disks also show enhanced
HI content relative to E/S0s without UV-B disks (Fig. 2.7), with 0.1% Kolmogorov-Smirnov test
probability of the sameMH I/M∗ distribution. Thus, it appears that UV-B disks are closely linked
to significant star formation potential and pronounced optical outer-disk star formation.
2.6 Discussion
In this section, we compare our identified XUV- and UV-B disk galaxy properties and
demo-graphics to XUV-disk and early-type galaxy formation scenarios and related literature results. We
note, however, that uniform knowledge of the local and global environments of our sample galaxies
NGC4117
20" 20" NGC3073 20" NGC5338 20" NGC3032
NGC3522
20" 20" NGC5173 20" NGC7077 20" NGC7360
UGC6003
20" 20" UGC6570 20" UGC6805 20" UGC7020A
NGC3773
20" 20" IC1024 20" NGC3156
Figure 2.8 Smoothed NUV contours (purple) overlaid on DSS-II red images of XUV-disk E/S0s.
RUVSF is indicated in white, and contours start at∼28.6 AB mag arcsec−2 and go up by 2×, 5×,
10×, and 25× in intensity. Eleven of these are Type 1 XUVs by the T07 definition: NGC4117, NGC3073, NGC5338, NGC3522, NGC5173, NGC7077, NGC7360, UGC6003, UGC7020A, IC1024,
and NGC3156. Eight of these are also UV-Bs: NGC3073, NGC5173, NGC7077, UGC6003,