Changes in Weight and Glucose Can Protect Against
Progression in Early Diabetes Independent of
Improvements in

-Cell Function
Y. R. Patel, M. S. Kirkman , R. V. Considine, T. S. Hannon, and K. J. Mather
Indiana University School of Medicine (Y.R.P., M.S.K., R.V.C., T.S.H., K.J.M.), Indianapolis, Indiana 46202; Harvard University (Y.R.P.), Cambridge, Massachusetts 02138; and University of North Carolina (M.S.K.), Chapel Hill, North Carolina 27599
Context:Evidence-based strategies to prevent progression of dysglycemia in newly diagnosed type 2 diabetes are needed.
Objective:To undertake a secondary analysis of the Early Diabetes Intervention Program (EDIP) in order to understand the features that were protective against worsening glycemia.
Design:EDIP was a randomized, placebo-controlled trial.
Setting:Two university diabetes centers.
Patients:A total of 219 overweight individuals with fasting glucose⬍7.8 mmol/L and 2-hour oral glucose tolerance test (OGTT) glucose⬎11.1 mmol/L.
Interventions:Acarbose versus placebo, on a background of dietary recommendations, with quar-terly visits to assess glycemia and intervention adherence for up to 5 years.
Main Outcome Measures:Progression of fasting glucoseⱖ7.8 mmol/L on two consecutive quar-terly visits. Cox proportional hazards modeling and ANOVA were performed to evaluate deter-minants of progression.
Results:Progression-free status was associated with reductions in weight, fasting glucose, 2-hour OGTT glucose, and increases in the high-density lipoprotein/triglyceride ratio. The reduction in fasting glu-cose was the only effect that remained significantly associated with progression-free status in multi-variable Cox modeling. The reduction in fasting glucose was in turn primarily associated with reduc-tions in weight and in 2-hour OGTT glucose. Acarbose treatment did not explain these changes.
Conclusions:In early diabetes, reductions in glucose, driven by reductions in weight, can delay progressive metabolic worsening. These observations underscore the importance of lifestyle man-agement including weight loss as a tool to mitigate worsening of glycemia in newly diagnosed diabetes.(J Clin Endocrinol Metab101: 4076 – 4084, 2016)
T
he Early Diabetes Intervention Program (EDIP) was a randomized, placebo-controlled, clinical trial evalu-ating the effect of acarbose vs placebo on a background of lifestyle recommendations to delay the progression of fast-ing plasma glucose (FPG) in a population with screen-detected, early diabetes. The primary analysis of EDIP hasbeen previously published; there was no statistical differ-ence between treatment groups in the cumulative inci-dence of progression of fasting glucose above a threshold of 7.8 mmol/L (140 mg/dL) over the 5-year period of ob-servation (1). We have also previously published findings that this population exhibited surprisingly poor -cell
ISSN Print 0021-972X ISSN Online 1945-7197 Printed in USA
Copyright © 2016 by the Endocrine Society Received May 8, 2016. Accepted August 11, 2016. First Published Online August 17, 2016
Abbreviations: EDIP, Early Diabetes Intervention Program; FPG, fasting plasma glucose; HbA1c, hemoglobin A1c; HDL, high-density lipoprotein; HOMA-IR, homeostasis model assessment of insulin resistance; OGTT, oral glucose tolerance test; TG, triglyceride.
4076 press.endocrine.org/journal/jcem J Clin Endocrinol Metab, November 2016, 101(11):4076 – 4084 doi: 10.1210/jc.2016-2056
function overall, despite their very early, screen-detected diabetes, and there was surprisingly little effect of the study interventions to improve-cell function (2), despite reductions in glucose.
Nevertheless, the study population exhibited a range of responses to study interventions, including reductions in glucose and weight, in relation to differences in progres-sion. Understanding the relationships of these changes in metabolic physiology to disease progression can improve our understanding of the physiology of progression and help us to better identify targets for protection against progression in early diabetes. With this goal in mind, we have undertaken post hoc analyses of the EDIP data to formally evaluate the determinants of progression and, by corollary, protection from progression in EDIP.
Subjects and Methods
The study was approved by the institutional review boards of Indiana University School of Medicine and Washington Univer-sity School of Medicine, and all subjects provided written in-formed consent for the research. Inclusion and exclusion criteria and general methods for the EDIP trial have been previously published (1). Participants were recruited from the surrounding communities using a process that included oral glucose tolerance test (OGTT) screening of asymptomatic individuals without known diabetes. To qualify for the EDIP, volunteers had to have 2-hour 75-g OGTT readings⬎11.1 but fasting glucose⬍7.8 mmol/L. The latter was the diagnostic cut-point for diabetes at the time the trial began. Subjects were randomly assigned to either acarbose or an identical placebo. Study drug administra-tion was initiated at a dose of 25 mg once daily with the evening meal, then titrated at weekly intervals by 25 mg daily to the maximum dose of 100 mg three times daily with meals. Study dosing was reduced as needed in subjects who complained of gastrointestinal side effects. Efforts were made to reach a daily dosage of at least 50 mg three times daily of acarbose or equiv-alent placebo tablets. At baseline, participants met with a study dietitian and were provided with recommendations for a diet appropriate for type 2 diabetes, including carbohydrate and cal-orie restriction and identifying targets for these components, but not identifying a specific weight loss target. At each quarterly visit, participants were weighed and asked to provide diet recall records.
The study definition of progression was met by achieving a fasting glucose valueⱖ7.8 mmol/L on two consecutive quarterly visits.
Study measurements
At study baseline, anthropomorphic and metabolic parame-ters were measured, and a 75-g oral glucose tolerance test (OGTT) was performed. Weight and height were measured with participants wearing light clothing, and body mass index was calculated as weight divided by the square of the height (kg/m2
). Blood pressure was measured in the right arm while subjects were seated using an automated blood pressure cuff (Dinamap, Cri-tikon; GE Healthcare). This testing was repeated at yearly visits
for the duration of observation, up to a maximum of 5 years. Study treatment was withheld the morning of the OGTT. Sub-jects returned quarterly for medication dispensing and blood sampling, including fasting glucose measurements. If subjects met the primary endpoint of the study (ie, progression of fasting glucose) at quarterly or annual visits, their participation was terminated, and no further metabolic measurements were obtained.
Assessment of treatment adherence
At quarterly study visits, previously dispensed medications were collected, and fresh bottles were provided. Medication ad-herence was calculated as the percentage of prescribed medica-tion that was missing from returned bottles. Participants were deemed compliant if at least 80% of the prescribed medications were taken in the interval.
As noted above, adherence with the dietary recommendations was assessed at quarterly visits by measuring body weight and through food records that were reviewed with the study dietitian.
Assays
Glucose concentrations were determined using a glucose ox-idase method (YSI). Hemoglobin A1c (HbA1c) was measured using an immunoturbidimetric assay (Roche Diagnostics). Total and high-density lipoprotein (HDL) cholesterol and triglycerides (TGs) were measured using an enzymatic endpoint assay (Roche Diagnostics). Low-density lipoprotein cholesterol concentration was derived using the Friedewald calculation if the value for TGs was⬍400 mg/dL (4.5 mmol/L). Insulin and proinsulin were measured by RIA (Linco Research), with fasting values being the mean of⫺30- and 0-minute samples. Nonesterified fatty acids were measured using a colorimetric method (Wako). All labo-ratory assays for both sites, other than the YSI plasma glucose measurements, were done at the central study laboratory at the Indiana University School of Medicine.
Calculations
Fasting insulin values consisted of the average of the two baseline values measured at the time of OGTT procedures.
-Cell function was assessed using OGTT data as the insulino-genic index [(30 minute⫺fasting insulin [U/mL])⫼(30 min-ute⫺fasting glucose [mg/dL])], reflecting the OGTT early-phase insulin response, and the insulin area under the curve (calculated using the trapezoidal rule), reflecting the OGTT late-phase in-sulin response. Inin-sulin sensitivity was estimated using inverse fasting insulin, combined with concurrent glucose readings into a homeostasis model assessment of insulin resistance (HOMA-IR) calculation or combined with the insulinogenic index from the OGTT to derive an oral disposition index (2, 3). Where this calculation produced negative values (a numerically possible but physiologically impossible result), those were set to missing for purposes of statistical analyses.
Statistical analysis
Two sets of analyses were undertaken. First, we evaluated anthropomorphic and metabolic determinants of progression of fasting glucose, combining subjects receiving the drug or placebo because there was no effect of drug. These analyses applied Cox proportional hazards modeling to the time-to-progression data, evaluating variables individually and then in multivariable mod-els. The parameters of interest included measures of weight and
metabolic status and explicitly included measures of insulin re-sistance and-cell function. The maximal treatment effects were apparent after the first year of observation, and owing to the study design, this time point also provided the maximal number of evaluable participants in the follow-up interval. Therefore, we evaluated the baseline and 1-year change in the variables of in-terest. We also undertook evaluations using the post-baseline time-dependent change in the variables of interest to evaluate all available data in relation to progression events. Multivariable models were constructed using all variables that exhibited uni-variate associations withP⬍.20; separate models were
con-structed including year 1 change variables or time-dependent change variables. These analyses revealed that the change in fast-ing glucose was a potent determinant of progression, even after adjustment for the potent effect of initial fasting glucose. There-fore, a second set of analyses was undertaken to explore in detail the factors that contributed to this change in fasting glucose, using a parallel approach of identifying univariate associations and then performing multivariable analyses. SPSS software (ver-sion 20; IBM) was used to perform all statistical analyses. Two-sidedPvalues⬍.05 were considered statistically significant for all comparisons, with no adjustment for multiple testing. Signif-icance results near this threshold (.01⬍P⬍.05) are described in the text as having “borderline” significance in view of the exploratory nature of these observations to guard against overinterpretation.
Results
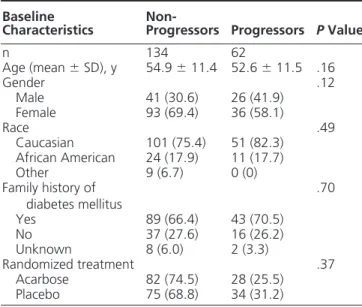
The characteristics of participants at study entry have been previously reported (1). Table 1 presents demographic characteristics comparing the group who progressed to those who did not progress during the 5 years of obser-vation. These groups did not differ by age, sex, race, family history of diabetes, or history of prior gestational diabetes among the female participants. Evaluating non-progres-sor vs progresnon-progres-sor group differences in metabolic variables (Table 2; non-progressor vs progressor within baseline data), the principal difference was in a lower fasting glu-cose at study entry among those who did not progress (6.54 mmol/L) compared to those who did progress (7.19 mmol/L). After the first year of study intervention, there were reductions in weight, fasting glucose, and 2-hour glucose after 75-g OGTT (Table 2; baseline vs year 1). Specifically, progressors exhibited smaller reductions in
Table 1. Baseline Demographic Characteristics of the Population
Baseline
Characteristics Non-Progressors Progressors PValue
n 134 62
Age (mean⫾SD), y 54.9⫾11.4 52.6⫾11.5 .16
Gender .12
Male 41 (30.6) 26 (41.9)
Female 93 (69.4) 36 (58.1)
Race .49
Caucasian 101 (75.4) 51 (82.3) African American 24 (17.9) 11 (17.7)
Other 9 (6.7) 0 (0)
Family history of diabetes mellitus
.70
Yes 89 (66.4) 43 (70.5)
No 37 (27.6) 16 (26.2)
Unknown 8 (6.0) 2 (3.3)
Randomized treatment .37
Acarbose 82 (74.5) 28 (25.5) Placebo 75 (68.8) 34 (31.2)
Data are expressed as number (percentage), unless stated otherwise. Note: This is a comparison of epidemiological characteristics and randomized treatments in progressor/non-progressor subgroups of the EDIP study population. Progression status is defined using the main study definition of progression of FPG as described in theSubjects and Methods.Pvalues are from2
analysis for categorical variables.
Table 2. Metabolic Characteristics of Progressors vs Non-Progressors at Baseline and After 1 Year of Study Intervention
Baseline Year 1 PValue
Non-Progressors Progressors PValue
Non-Progressors Progressors PValue
Progression Group Effect
On-Treatment Effect
Progression-Treatment Interaction
n 134 62 108 56
Weight, kg 97.3⫾21.0 102.4⫾21.2 .11 91.7⫾19.1 98.9⫾22.0 .032 .034 ⬍.0001 .74 FPG, mmol/L 6.54⫾0.77 7.19⫾0.51 ⬍.0001 6.0⫾0.8 7.1⫾0.9 ⬍.0001 ⬍.0001 ⬍.0001 .008 OGTT 120-min glucose, mmol/L 13.02⫾1.58 13.28⫾2.03 .37 11.30⫾2.59 12.07⫾2.80 .07 .06 ⬍.0001 .28 HbA1c, % 6.33⫾0.65 6.38⫾0.57 .55 6.11⫾0.66 6.39⫾0.68 .01 .02 .39 .14 HOMA-IR, U 5.91⫾4.29 6.76⫾3.91 .19 5.25⫾4.89 7.06⫾5.83 .06 .014 .88 .86 Disposition index 4.75⫾8.88 3.91⫾4.58 .49 2.61⫾4.24 2.86⫾3.93 .74 .94 .008 .90 Fasting proinsulin, pmol/L 23.8⫾21.7 22.7⫾13.9 .77 18.2⫾11.1 26.2⫾20.0 .02 .015 .38 .64 Fasting insulin, pmol/L 146.6⫾98.5 152.3⫾93.1 .52 137.2⫾116.2 158.8⫾138.8 .34 ⬍.0001 ⬍.0001 .008 Fasting NEFA, mmol/L 574.8⫾187.3 578.0⫾190.9 .59 491.6⫾167.8 517.1⫾153.1 .76 .27 .001 .93 Total cholesterol, mmol/L 5.13⫾1.04 5.17⫾0.99 .83 4.97⫾0.84 4.96⫾1.02 .91 .68 .007 .56 HDL cholesterol, mmol/L 1.02⫾0.22 0.96⫾0.26 .09 1.05⫾0.24 1.02⫾0.26 .43 .15 .001 .24 LDL cholesterol, mmol/L 4.15⫾0.98 4.04⫾1.02 .50 4.10⫾0.73 3.87⫾0.95 .10 .31 .13 .36 TG, mmol/L 2.11⫾1.10 2.65⫾1.30 .10 1.88⫾0.94 2.58⫾1.10 .007 .009 .017 .59 HDL/TG ratio, mmol/L 0.11⫾0.06 0.09⫾0.09 .05 0.13⫾0.08 0.10⫾0.11 .01 .009 .001 .31
Abbreviations: LDL, low-density lipoprotein; NEFA, non-esterified fatty acids. Note: This is a comparison of metabolic parameters in progressor/ non-progressor subgroups of the EDIP study population. Progression status is defined using the main study definition of progression of FPG as described inSubjects and Methods.Pvalues are from ANOVA (comparisons within each year) or repeated measures ANOVA comparing overall differences by group, time, and the interaction of these terms.
fasting glucose (0.1 mmol/L) than non-progressors (0.5 mmol/L;P⫽.008 comparing this change), whereas both groups experienced similar reductions in 2-hour OGTT glucose (1.7 vs 1.3 mmol/L reductions;P⬍.0001 for the reduction, and P ⫽ .28 comparing this effect between groups) and similar reductions in weight (5 vs 3 kg reduc-tions;P⬍.0001 for the reduction andP⫽.74 comparing this effect between groups; Table 2). These changes were accompanied by reductions in concentrations of fasting insulin, nonesterified fatty acids, HDL cholesterol, TGs, and the HDL/TG ratio, all concordant with the reduction in weight and improved insulin resistance.-Cell function was reduced despite this improvement in insulin resistance (Table 2). The progressors differed from non-progressors in these on-study effects in fasting glucose and fasting
in-sulin (Table 2; non-progressor vs progressor by baseline vs year 1).
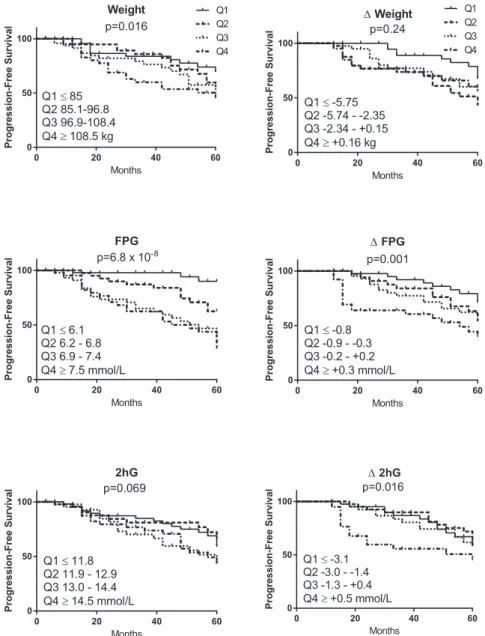
The relationships of these param-eters with time to progression were evaluated by dividing the population by quartiles of the baseline data (n⫽ 219) or the 1-year change data (n⫽ 163). Figure 1 presents Kaplan-Meier analyses of progression-free survival by quartile. Most notably, these pa-rameters did not exhibit monotonic relationships across quartiles. In par-ticular, participants in the highest quartile of weight exhibited a differ-ent rate of progression compared to others, and the top two quartiles of fasting glucose behaved similarly to each other but differed from each of the lower two quartiles. In terms of the effects of change parameters, again the relationships were not monotonic, and in particular those who failed to reduce fasting glucose progressed more rapidly than those who maintained or reduced their fasting glucose. Survival-free pro-gression differed by quartiles of in-sulin resistance (inverse fasting insu-lin, borderline significant atP⫽.03), but there was no difference in pro-gression by quartile of -cell func-tion (oral disposifunc-tion index, P ⫽ .14), change in insulin resistance (P⫽.44), or change in-cell func-tion (P⫽.73; data not shown).
The determinants of progression were evaluated using Cox propor-tional hazards modeling (Table 3). Initial analyses determined that age was related to gression status, but sex and race were not related to pro-gression status or the metabolic parameters evaluated; therefore the models were age-adjusted. Analyses were performed in a planned stepwise manner. First, all indi-vidual parameters of interest were evaluated as adjusted univariate relationships. Next, a multivariable model was built using baseline parameters that met inclusion criteria as univariate terms (P⬍.20). Next was a similar model also incorporating parameters for 1-year change that met criteria for inclusion. Finally, a parallel model was built incorporating baseline plus time-dependent change pa-rameters, incorporating all available data out to 5 years of observation. Parameters that were strongly associated Figure 1. Progression-free survival presented by quartiles of variables of interest. ThePvalue
represents the Cox proportional hazards comparison across the four quartiles of each parameter. Quartiles are numbered from 1 (lowest) to 4 (highest); cut-points for these quartiles are presented on each figure. 2hG, 2-hour glucose on the OGTT.
with progression status in univariate analyses included baseline fasting glucose and year-1 change in fasting glu-cose, change in 2-hour OGTT gluglu-cose, and baseline nones-terified fatty acid concentrations. Weight, change in weight, lipid concentrations, and measures of insulin re-sistance and-cell function were of borderline significance or were not associated with progression by univariate analysis. The multivariable models identified persisting independent highly significant effects only of baseline and change in fasting glucose concentrations (producing par-allel results with evaluations using year-1 change and time-dependent change).
The overall 1-year change in fasting glucose was a low-ering of glucose (ie, a negative value), and as is evident in Figure 1, the risk of progression was lowest among those with the greatest reductions in fasting glucose. We there-fore undertook analyses to better explain this effect. These are shown in Table 4, which presents a set of linear re-gression analyses using the 1-year change in FPG as the dependent variable. In parallel with the approach applied for the Cox modeling, univariate regressions against pa-rameters of interest were first evaluated, followed by mul-tivariable relationships with baseline variables, and then multivariable relationships with baseline and 1-year change variables. Age, sex, and race were not individually associated with the 1-year change in fasting glucose, and including them as adjustments in the univariate associa-tions did not materially alter the other relaassocia-tionships (data
not shown); therefore the unadjusted relationships are presented (Table 4). In contrast to the main study result, which found no treatment differences evaluating the change in fasting glucose collected over 5 years of obser-vation (1), the 1-year change in fasting glucose was greater among those randomized to acarbose, but of borderline significance. The baseline fasting glucose (highly signifi-cant) and baseline HDL/TG ratio (borderline significance) were univariate determinants of change in fasting glucose, both inversely related. The 1-year change in weight and the change in 2-hour OGTT glucose were very strongly associated with the change in fasting glucose, and a less potent effect of borderline significance was also seen with a change in the HDL/TG ratio. These relationships were direct, ie, reductions in fasting glucose were seen in asso-ciation with reductions in these parameters. In the multi-variable analyses, after controlling for the effect of base-line fasting glucose and HDL/TG ratio, the changes in weight and 2-hour OGTT glucose retained significance. The acarbose effect did not remain significant after in-cluding changes in weight, 2-hour glucose, and HDL/TG ratio. Study medication adherence was high (⬎90% at year 1) and was not different between treatment groups; adherence was not related to change in fasting glucose (data not shown).
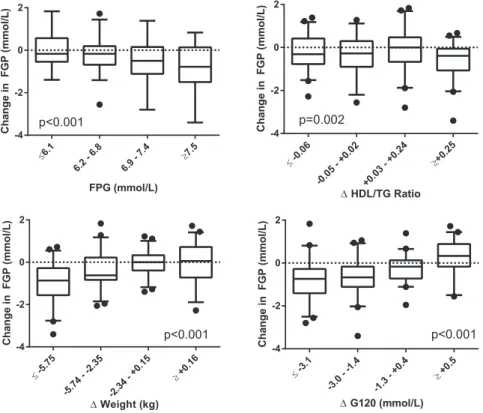
Figure 2 presents the primary determinants of change in fasting glucose graphically, revealing some nonlinearity in the relationships. Noteworthy features include the greater
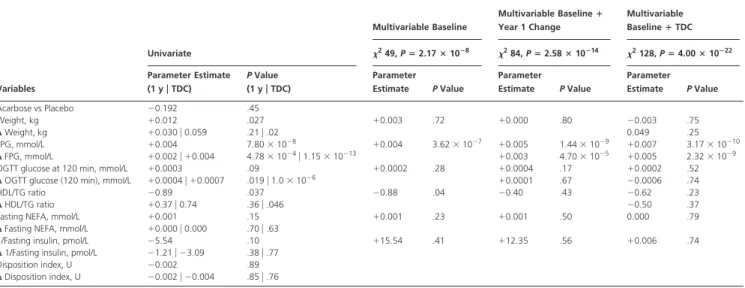
Table 3. Cox Proportional Hazard Analyses Evaluating Association of Baseline, Year 1 Change, and Overall Time-Dependent Change in Metabolic Variables With Progression of Fasting Glucose
Variables
Univariate
Multivariable Baseline
Multivariable Baselineⴙ
Year 1 Change
Multivariable BaselineⴙTDC
249,Pⴝ2.17ⴛ10ⴚ8 284,Pⴝ2.58ⴛ10ⴚ14 2128,Pⴝ4.00ⴛ10ⴚ22
Parameter Estimate (1 y円TDC)
PValue (1 y円TDC)
Parameter Estimate PValue
Parameter Estimate PValue
Parameter Estimate PValue
Acarbose vs Placebo ⫺0.192 .45
Weight, kg ⫹0.012 .027 ⫹0.003 .72 ⫹0.000 .80 ⫺0.003 .75
⌬Weight, kg ⫹0.030兩0.059 .21兩.02 0.049 .25
FPG, mmol/L ⫹0.004 7.80⫻10⫺8 ⫹0.004 3.62⫻10⫺7 ⫹0.005 1.44⫻10⫺9 ⫹0.007 3.17⫻10⫺10 ⌬FPG, mmol/L ⫹0.002兩⫹0.004 4.78⫻10⫺4兩1.15⫻10⫺13 ⫹0.003 4.70⫻10⫺5 ⫹0.005 2.32⫻10⫺9
OGTT glucose at 120 min, mmol/L ⫹0.0003 .09 ⫹0.0002 .28 ⫹0.0004 .17 ⫹0.0002 .52
⌬OGTT glucose (120 min), mmol/L ⫹0.0004兩⫹0.0007 .019兩1.0⫻10⫺6 ⫹0.0001 .67 ⫺0.0006 .74
HDL/TG ratio ⫺0.89 .037 ⫺0.88 .04 ⫺0.40 .43 ⫺0.62 .23
⌬HDL/TG ratio ⫹0.37兩0.74 .36兩.046 ⫺0.50 .37
Fasting NEFA, mmol/L ⫹0.001 .15 ⫹0.001 .23 ⫹0.001 .50 0.000 .79
⌬Fasting NEFA, mmol/L ⫹0.000兩0.000 .70兩.63
1/Fasting insulin, pmol/L ⫺5.54 .10 ⫹15.54 .41 ⫹12.35 .56 ⫹0.006 .74
⌬1/Fasting insulin, pmol/L ⫺1.21兩⫺3.09 .38兩.77 Disposition index, U ⫺0.002 .89
⌬Disposition index, U ⫺0.002兩⫺0.004 .85兩.76
Abbreviation: NEFA, non-esterified fatty acids. Note: Cox proportional hazards analyses for determinants of progression status are shown. Age-adjusted multivariable analyses are presented. The multivariable models include terms that were associated with progression withPⱕ.20 in univariate analyses except parameters of insulin resistance and-cell function, which were forced into the models (seeSubjects and Methods). Change variables (⌬) were included as 1-year change after randomization or as TDC after randomization.兩indicates that parallel testing was done using parameters at 1 year and all available data as time-dependent change. The time-dependent covariate parameters include all available data over the course of observation; for NEFA, these data were available only to year 2, whereas for other parameters these data were available to year 5 after randomization. The parameter estimates represent the strength of association per unit of the independent variable, with positive values representing a direct association and negative values representing an inverse association.
reductions observed among those with higher baseline FPG; the observation that the HDL/TG ratio relationship appears to be dominated by a modest population-wide reduction in this ratio rather than a quartile-dependent relationship; an evident threshold effect for reduction in weight as a determinant of reductions in fasting glucose; and a similar effect with 120-minute glucose, where only those with the greatest reductions in 120-minute glucose showed reductions in fasting glucose.
These results demonstrate an important beneficial effect of weight loss and accompanying reductions in glucose and lipids as factors underlying the prevention of a worsening of fasting glucose in this early diabetes population.
Discussion
Here we have demonstrated that in the EDIP, the on-study reduction in fasting glucose was strongly associated with protection from progression (defined in the EDIP as achieving a fasting glucoseⱖ140 mg/dL, or 7.8 mmol/L). This effect was seen after adjustment for the baseline fasting glucose and is therefore not simply an effect of reducing glucose values in those closest to the threshold; rather, it represents the integrated beneficial effect of study interven-tions. The change in fasting glucose was in turn strongly and directly related to reductions in weight and reductions in 2-hour OGTT glucose. Notably, we observed a threshold effect for weight loss, where approximately 5– 6% weight
loss was most reliably associated with improvements in fast-ing glucose. These changes took place despite the baseline states of fasting hyperglycemia, poor-cell function, and a lack of improvement in-cell function that we have pre-viously reported (2). Treatment with acarbose was asso-ciated with greater reductions in fasting glucose, but this effect was of borderline significance and was weaker than the potent overall roles of weight reduction and lowering of 2-hour glucose values, effects that were not unique to the acarbose treatment. The concurrent increases in the HDL/TG ratio point to underlying changes in diet and weight as drivers of the observed changes. These obser-vations argue that study participation conferred these ef-fects independent of randomized study medications, which suggests that the study-wide dietary recommenda-tions, along with the nonspecific beneficial effects of par-ticipation in a clinical trial, contributed to these results. The magnitude of weight loss associated with these gly-cemic benefits was smaller than that promoted in the Di-abetes Prevention Program (4) and the Look AHEAD study (5) and was achieved with a less intensive interven-tion closer to what is possible in a usual care setting. The current observations provide a positive message that cli-nicians can use in implementing and motivating modest dietary weight loss as a component of diabetes care and prevention of metabolic worsening in early diabetes.
In the EDIP, baseline fasting glucose was a strong de-terminant of progression of dysglycemia, an observation that has been widely reported in epidemiological studies of
Table 4. Determinants of Year 1 Change in FPG
Baseline Variables
Univariate
Multivariable Baseline, R2⫽0.15,P⫽2⫻10⫺6
Multivariable BaselineⴙChange, R2⫽0.34,P⫽3⫻10⫺9
Parameter
Estimate PValue
Parameter
Estimate PValue
Parameter
Estimate PValue
Acarbose vs placebo ⫺0.165 .034 ⫺0.144 .048 ⫺0.063 .41
Weight, kg ⫺0.071 .36
⌬Weight, kg ⫹0.55 2.4⫻10⫺14 ⫹0.264 .003
FPG, mmol/L ⫺0.335 1.1⫻10⫺5 ⫺0.334 8.0⫻10⫺6 ⫺0.174 .025
OGTT glucose at 120 min, mmol/L ⫺0.091 .24
⌬OGTT glucose (120 min), mmol/L ⫹0.534 2.2⫻10⫺13 ⫹0.315 .001
HDL/TG ratio ⫺0.168 .031 ⫺0.17 .019 ⫺0.163 .044
⌬HDL/TG ratio ⫹0.159 .050 ⫹0.097 .23
Fasting NEFA, mmol/L ⫺0.014 .86
⌬Fasting NEFA, mmol/L ⫹0.095 .23 1/Fasting insulin, pmol/L ⫹0.024 .77
⌬1/Fasting insulin, pmol/L ⫺0.09 .30
Disposition index, U ⫺0.052 .53
⌬Disposition index, U ⫹0.138 .13 ⫹0.085 .27
Abbreviation: NEFA, non-esterified fatty acids. Note: Generalized linear model analyses for determinants of change in fasting glucose from baseline to year 1 are shown. The multivariable models include terms that were associated with progression withPⱕ.20 in univariate analyses, with no terms forced into the modeling. The parsimonious model includes only terms individually significant atP⬍.05 in the prior model. The parameter estimates represent the strength of association per unit of the independent variable, with positive values representing a direct association and negative values representing an inverse association.
progression of dysglycemia (6 –10) and studies of diabetes treatments and their effects on diabetes progression (11– 15). Under the definition of progression used in the EDIP, this relationship can be seen as tautological, with initial glucose values closer to the threshold predisposing indi-viduals to crossing the fixed threshold defining progres-sion. This problem of logic also applies to other studies of diabetes progression that apply diagnostic cut-points as endpoints. However, we also observed that baseline glu-cose was inversely associated with the protective reduc-tions in fasting glucose (Table 4), such that those with the highest baseline glucose values exhibited the largest on-study reductions in glucose (Figure 2). This effect did not remove the strong predictive effect of fasting glucose, sug-gesting that dual effects are in play, with an elevated glu-cose reflecting a more adverse overall risk status but also a greater opportunity for improvement in glucose, with its attendant benefits. Although participants were newly di-agnosed with diabetes based on a screening OGTT at the time of study entry, it is possible that different durations and rates of change of dysglycemia before diagnosis sep-arate those who progress vs those who do not, and that these tendencies manifest as the observed differences in absolute fasting glucose and differences in rate of change starting from the start of observation while on study.
It is perhaps paradoxical that the ac-arbose intervention was effective in lowering fasting glycemia (Table 4) but was not effective in preventing overall 5-year progression (1). The underlying premise of the trial was that targeting postprandial hyperglycemia with acar-bose would mitigate the glucose excur-sion-related risk of progression of early diabetes. The mechanism(s) underlying the contribution of hyperglycemia to pro-gressive glycemic dysregulation are in-completely understood but are likely re-lated to oxidant load, with adverse effects on-cells (16) and on peripheral insulin responses (17). If we assume that this toxic effect of hyperglycemia is reversible (an assumption with reasonable support) (18), the lack of benefit of an effective glu-cose-lowering therapy can be interpreted either as an insufficient potency of glu-cose lowering for this stage of disease or as concurrent progression despite effec-tive therapy. These observations are consistent with a more advanced state of underlying metabolic dysfunction among the progressors, where the over-all glucose-lowering effect of acarbose was insufficient to mitigate the overall glucose toxicity arising from fasting and/or post-OGTT hyperglycemia. Data from the current study do not allow us to comment on other physiological factors that might contribute to progressive loss of meta-bolic control, but these data are consistent with an im-portant direct effect of hyperglycemia on progressive loss of glycemic control and a protective effect of reduction in glycemia. It is not currently known whether other inter-ventions to reduce glycemia, differing in mechanism of glucose lowering, in magnitude of glucose reductions and in reductions of fasting vs prandial glucose excursions, will exert differential effects to mitigate progressive dys-glycemia in early diabetes. The current model of diabetes progression suggests that after reaching the stage of im-paired glucose tolerance, progressive loss of-cell func-tion becomes the dominant factor in the progression of loss of glycemic control (7, 19 –25). Insulin resistance is generally understood to be a necessary background state, with improvements in insulin resistance aiding glycemic control by allowing overall better glucose management with existing levels of-cell function (7, 19 –21, 26). Our population exhibited a reasonable range of physiological parameters of interest for these components of metabolic physiology, including HOMA-IR and disposition index Figure 2. Determinants of 1-year change in FPG, presented by quartile. The upper, middle, and
lower boundaries of the boxes represent the 75th, 50th, and 25th percentiles for each quartile; the outermost lines are at the 95th and fifth percentiles and data points beyond these limits are individually shown. Significance values are presented for the comparison of change in FPG by quartile.
(Table 1). Our data are in contrast with the expectation that treatment effects might be mediated by improvements in insulin resistance and/or-cell function. We found that progressors and non-progressors did not differ at baseline on these features (Table 2). Despite on-study reductions in weight and improvements in the HDL/TG ratio, HOMA-IR was not different after 1 year of study inter-vention, and progression groups did not differ in this fea-ture. The disposition index was significantly reduced (worse) after 1 year of study intervention, an effect that was not different between groups. In this context, it is not surprising that neither insulin resistance nor-cell func-tion was individually related to the risk of progression. These observations do not rebut the prior literature link-ing the beneficial effects of treatments targetlink-ing insulin resistance or-cell function, and it seems likely that the relevant factors that determined differences in the rates of progression were unmeasured factors for which weight loss is a marker, such as inflammation, cytokine stress, immune activation, and other putative pathophysiologi-cal factors (27). Nevertheless, these observations highlight the possibility that treatments that achieve weight loss and glucose reductions can produce metabolic benefits even in the absence of beneficial effects on insulin resistance and
-cell function.
Limitations
A clinical trial population is defined by the needs of a particular study question, which can limit generalizability and produce a limited range of values for parameters that are affected by inclusion criteria. It is possible that this effect may have limited our ability to demonstrate contri-butions of insulin resistance or-cell function to the pro-gression of fasting glucose. Also, the currently defined sub-groups may differ in one or more unmeasured factors that importantly influenced the outcomes evaluated here, al-though it seems unlikely that such factors dominate the currently observed highly significant effects. The statisti-cal threshold applied in these exploratory analyses could be insufficiently rigorous to exclude false-positive obser-vations; nevertheless, the major findings presented here achieved very high degrees of statistical significance, and we have been careful not to overinterpret observations with borderline significance. Due to the study design, we have no data on participants after they met criteria for progression, which limits analyses to events before the progression event. It would be of interest in subsequent studies to consider ongoing progression after individuals cross study-defined or diagnostic thresholds.
Conclusions
In a population with early, screen-detected diabetes, reductions in glucose, driven by reductions in weight, can
delay progressive metabolic worsening. These observa-tions underscore the importance of lifestyle management including weight loss as a tool to mitigate the worsening of glycemia in newly diagnosed diabetes.
Acknowledgments
Address all correspondence and requests for reprints to: Kieren Mather, MD, FRCPC, Professor of Medicine, Indiana University School of Medicine, 1120 West Michigan Street, CL365, Indi-anapolis, IN 46202. E-mail:[email protected].
The EDIP was supported by an investigator-initiated grant from Bayer with additional support from the National Institutes of Health (Grants P60 DK20542, P60 DK20579, GCRC M01RR00750, and M01RR00036). M.S.K. was a faculty mem-ber at Indiana University at the time of the EDIP study, and Y.R.P. produced this paper during his training in public health at Indiana University School of Medicine.
Author contributions: Y.R.P. and K.J.M. wrote the manu-script. Y.R.P. performed statistical analyses. R.V.C. and M.S.K. provided study data. T.S.H., R.V.C., and M.S.K. edited the man-uscript and contributed to the discussion.
ClinicalTrials.gov Identifier: NCT01470937.
Disclosure Summary: All authors report no dualities of in-terest that are pertinent to the paper. K.J.M. and M.S.K. partic-ipate in a clinical trial that receives support from Merck, Sanofi, Novo Nordisk, and Abbott.
References
1. Kirkman MS, Shankar RR, Shankar S, et al.Treating postprandial hyperglycemia does not appear to delay progression of early type 2 diabetes: the Early Diabetes Intervention Program.Diabetes Care. 2006;29(9):2095–2101.
2. Hannon TS, Kirkman MS, Patel YR, Considine RV, Mather KJ.
Profound defects in-cell function in screen-detected type 2 diabetes are not improved with glucose-lowering treatment in the Early Di-abetes Intervention Program (EDIP). Diabetes Metab Res Rev. 2014;30(8):767–776.
3. Sjaarda LG, Bacha F, Lee S, Tfayli H, Andreatta E, Arslanian S.Oral disposition index in obese youth from normal to prediabetes to di-abetes: relationship to clamp disposition index. J Pediatr. 2012; 161(1):51–57.
4. Knowler WC, Barrett-Connor E, Fowler SE, et al.Reduction in the incidence of type 2 diabetes with lifestyle intervention or metformin.
N Engl J Med. 2002;346(6):393– 403.
5. Ryan DH, Espeland MA, Foster GD, et al.Look AHEAD (Action for Health in Diabetes): design and methods for a clinical trial of weight loss for the prevention of cardiovascular disease in type 2 diabetes.
Control Clin Trials. 2003;24(5):610 – 628.
6. Edelstein SL, Knowler WC, Bain RP, et al.Predictors of progression from impaired glucose tolerance to NIDDM: an analysis of six pro-spective studies.Diabetes. 1997;46(4):701–710.
7. Ferrannini E, Natali A, Muscelli E, et al.Natural history and phys-iological determinants of changes in glucose tolerance in a non-diabetic population: the RISC Study. Diabetologia. 2011;54(6): 1507–1516.
8. Meigs JB, Muller DC, Nathan DM, Blake DR, Andres R.The nat-ural history of progression from normal glucose tolerance to type 2 diabetes in the Baltimore Longitudinal Study of Aging.Diabetes. 2003;52(6):1475–1484.
9. Rasmussen SS, Glümer C, Sandbaek A, Lauritzen T, Borch-Johnsen K.Determinants of progression from impaired fasting glucose and impaired glucose tolerance to diabetes in a high-risk screened pop-ulation: 3 year follow-up in the ADDITION study, Denmark. Dia-betologia. 2008;51(2):249 –257.
10. Gautier A, Roussel R, Ducluzeau PH, et al.Increases in waist cir-cumference and weight as predictors of type 2 diabetes in individuals with impaired fasting glucose: influence of baseline BMI: data from the DESIR study.Diabetes Care. 2010;33(8):1850 –1852. 11. Kitabchi AE, Temprosa M, Knowler WC, et al.Role of insulin
se-cretion and sensitivity in the evolution of type 2 diabetes in the diabetes prevention program: effects of lifestyle intervention and metformin.Diabetes. 2005;54(8):2404 –2414.
12. Lindström J, Peltonen M, Eriksson JG, et al.Determinants for the effectiveness of lifestyle intervention in the Finnish Diabetes Pre-vention Study.Diabetes Care. 2008;31(5):857– 862.
13. Ramachandran A, Snehalatha C, Mary S, Mukesh B, Bhaskar AD, Vijay V.The Indian Diabetes Prevention Programme shows that lifestyle modification and metformin prevent type 2 diabetes in Asian Indian subjects with impaired glucose tolerance (IDPP-1).
Diabetologia. 2006;49(2):289 –297.
14. Turner RC, Cull CA, Frighi V, Holman RR.Glycemic control with diet, sulfonylurea, metformin, or insulin in patients with type 2 di-abetes mellitus: progressive requirement for multiple therapies (UK-PDS 49). UK Prospective Diabetes Study (UK(UK-PDS) Group.JAMA. 1999;281(21):2005–2012.
15. Kahn SE, Lachin JM, Zinman B, et al.Effects of rosiglitazone, gly-buride, and metformin on-cell function and insulin sensitivity in ADOPT.Diabetes. 2011;60(5):1552–1560.
16. Robertson RP, Harmon J, Tran PO, Tanaka Y, Takahashi H. Glu-cose toxicity in-cells: type 2 diabetes, good radicals gone bad, and the glutathione connection.Diabetes. 2003;52(3):581–587. 17. Kim JK, Zisman A, Fillmore JJ, et al.Glucose toxicity and the
de-velopment of diabetes in mice with muscle-specific inactivation of GLUT4.J Clin Invest. 2001;108(1):153–160.
18. Retnakaran R, Qi Y, Opsteen C, Vivero E, Zinman B.Initial short-term intensive insulin therapy as a strategy for evaluating the pres-ervation of-cell function with oral antidiabetic medications: a pilot study with sitagliptin.Diabetes Obes Metab. 2010;12(10):909 – 915.
19. Nijpels G.Determinants for the progression from impaired glucose tolerance to non-insulin-dependent diabetes mellitus.Eur J Clin In-vest.1998;28(suppl 2):8 –13.
20. Faerch K, Vaag A, Holst JJ, Hansen T, Jørgensen T, Borch-Johnsen K.Natural history of insulin sensitivity and insulin secretion in the progression from normal glucose tolerance to impaired fasting gly-cemia and impaired glucose tolerance: the Inter99 Study.Diabetes Care. 2009;32(3):439 – 444.
21. Cali AM, Man CD, Cobelli C, et al.Primary defects in-cell function further exacerbated by worsening of insulin resistance mark the development of impaired glucose tolerance in obese adolescents.
Diabetes Care. 2009;32(3):456 – 461.
22. Ferrannini E, Gastaldelli A, Miyazaki Y, Matsuda M, Mari A, De-Fronzo RA.-Cell function in subjects spanning the range from normal glucose tolerance to overt diabetes: a new analysis.J Clin Endocrinol Metab. 2005;90(1):493–500.
23. DeFronzo RA, Banerji MA, Bray GA, et al.Determinants of glucose tolerance in impaired glucose tolerance at baseline in the Actos Now for Prevention of Diabetes (ACT NOW) study.Diabetologia. 2010; 53(3):435– 445.
24. Campbell RK.Fate of the-cell in the pathophysiology of type 2 diabetes.J Am Pharm Assoc (2003).2009;49(suppl 1):S10 –S15. 25. Guerrero-Romero F, Rodríguez-Morán M.Assessing progression to
impaired glucose tolerance and type 2 diabetes mellitus.Eur J Clin Invest. 2006;36(11):796 – 802.
26. Nichols GA, Hillier TA, Brown JB.Progression from newly ac-quired impaired fasting glucose to type 2 diabetes.Diabetes Care. 2007;30(2):228 –233.
27. Fonseca VA.Defining and characterizing the progression of type 2 diabetes.Diabetes Care.2009;32(suppl 2):S151–S156.