USING HIGH-DIMENSIONAL DISEASE RISK SCORES IN COMPARATIVE EFFECTIVENESS RESEARCH OF NEW TREATMENTS
Richard Wyss
A dissertation submitted to the faculty of the University of North Carolina at Chapel Hill in partial fulfillment of the requirements for the degree of Doctor of Philosophy in the
Department of Epidemiology.
Chapel Hill 2015
Approved by:
Til Stürmer
M. Alan Brookhart
Michele Jonsson Funk
Cynthia J. Girman
iii
ABSTRACT
RICHARD WYSS: Using High Dimensional Disease Risk Scores in Comparative Effectiveness Research of New Treatments
(Under the direction of Dr. Til Stürmer)
Nonexperimental research using automated healthcare databases can supplement
randomized trials to provide both clinicians and patients with timely information to optimize
treatment decisions. These studies, however, are susceptible to confounding and require design
and statistical methods to control for large numbers of confounding variables. The propensity
score (PS), defined as the conditional probability of treatment given a set of covariates, has
become increasingly popular for controlling large numbers of covariates in
pharmacoepidemiologic studies. During early periods after the introduction of a new
treatment, however, accurately modeling the PS can be difficult because of rapid change over
time in drug prescribing patterns and few exposed individuals. A historically estimated disease
risk score (DRS), which summarizes covariate associations with the outcome absent of
exposure, has been proposed as an alternative to PSs for controlling large numbers of
covariates during these periods. Little is known about the performance and potential benefits
of using DRSs for confounding control when evaluating the comparative effectiveness of newly
marketed drugs.
In this study, we examined the benefits and challenges of using historically estimated
iv
drug approval. We further evaluated novel strategies for determining the validity of fitted DRS
models in their ability to control confounding. We investigated these methodological questions
using Monte Carlo simulations and empirical data. The empirical analyses included 20% and 1%
samples of Medicare claims data to compare the new oral anticoagulant dabigatran with
warfarin in reducing the risk of combined ischemic stroke and all-cause mortality in older
populations.
When PS distributions are separated, DRS matching can improve the precision of effect
estimates and allow researchers to evaluate the treatment effect in a larger proportion of the
treated population. However, accurately modeling the DRS can be challenging compared to the
PS. When evaluating the validity of DRS models, measures of predictive performance do not
always correspond well with reduced bias in treatment effect estimates. Calculating the pseudo
bias within a “dry run” analysis can provide a more direct measure for assessing the ability of
fitted DRS models to control confounding.
v
To my wife, Annah, for your love and support
and
vi
ACKNOWLEDGEMENTS
I would first like to thank my adviser, Til Stürmer, for his guidance and mentoring. His
example and mentorship has been essential in helping me grow as a student of
pharmacoepidemiology. Thank you for facilitating many valuable research opportunities and for
always being willing to make time in your schedule to answer questions and discuss
methodological concepts. I am very grateful for the opportunity that I have had to work with
you these past years.
I would like to thank the members of my dissertation committee: Alan Brookhart,
Michele Jonsson Funk, Cynthia J Girman, and Ross Simpson. Thank you for your encouragement
and the many hours you invested in providing your guidance and expertise.
I would also like to thank Alan Ellis for the many hours that he has invested in providing
his expertise in the projects that we have worked on together and Virginia Pate for her help and
expertise in programming. I am also very grateful for the friendships and support from my
classmates in the pharmacoepidemiology program.
Lastly, I would like to express my deep appreciation and love for my wife Annah and son
Daniel for their love, patience and support. I would also like to express my deep gratitude to my
vii
TABLE OF CONTENTS
List of Tables ... x
List of Figures ... xi
List of Abbreviations ... xii
Chapter 1. Background and Specific Aims ... 1
1.1 Specific Aims ... 1
1.2 Comparative Effectiveness Research ... 3
1.2.1 Current Methodological Limitations ... 5
1.3 Summary Scores and Causal Inference ... 6
1.3.1 Counterfactual Framework ... 6
1.3.2 Propensity Score Methods ... 7
1.3.3 Disease Risk Score Methods ... 8
1.4 Anti-Coagulant Medications and Cardiovascular Disease in Patients with Atrial Fibrillation ... 14
1.4.1 Early Evaluation of New Oral Anticoagulant Drugs for Patients with Atrial Fibrillation ... 17
Chapter 2. Methods ... 19
2.1 Study Population ... 19
2.2 Study Design ... 20
2.3 Choice of Outcomes ... 21
2.4 Variable Selection... 21
2.5 Monte Carlo Simulations ... 22
viii
2.5.2 Simulations for Aim 2 ... 23
2.6 Aim 1: Evaluating Potential Benefits of the Disease Risk Score ... 23
2.6.1 Overlap in the Distribution of Disease Risk Across Rreatment. ... 23
2.6.2. Controlling for Instrumental Variables ... 25
2.7 Aim 2: Model Validation ... 27
2.7.1. Validation of Propensity Score Models ... 27
2.7.2. Validation of Disease Risk Score Models... 27
Chapter 3. Using Disease Risk Scores to Control Large Numbers of Covariates in Comparative Effectiveness Research of New Treatments... 32
3.1 Introduction ... 32
3.2 Background ... 33
3.3 Simulation Study: an Illustrative Example ... 36
3.4 Simulation Results ... 37
3.5 Empirical Study: Dabigatran vs Warfarin in Patients with Atrial Fibrillation ... 38
3.6 Empirical Results ... 40
3.8 Tables and Figures ... 45
Chapter 4. Metrics to Evaluate Disease Risk Scores in Non-Experimental Research ... 52
4.1 Introduction ... 52
4.2 Background and Notation ... 54
4.2.1 Challenges When Modeling the DRS and Evaluating its Ability to Control Confounding ... 55
4.3 Dry Run Analysis ... 57
4.4 Simulation Study ... 58
4.5 Simulation Results ... 60
ix
4.7 Empirical Results ... 64
4.8 Discussion ... 65
4.9 Tables and Figures ... 68
Chapter 5. Conclusions & Public Health Significance ... 74
5.1 Summary of Specific Aims ... 74
5.1.1 Summary of Aim 1 ... 75
5.1.2 Summary of Aim 2 ... 76
x
LIST OF TABLES
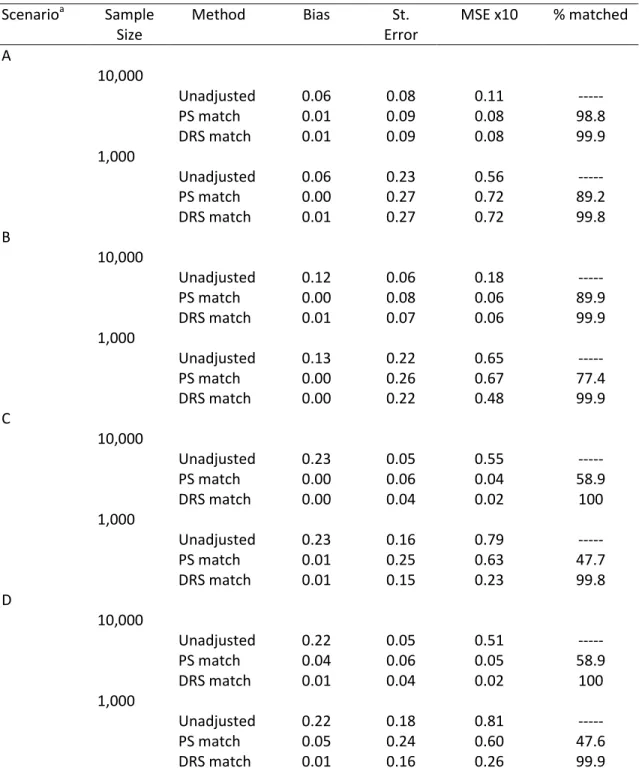
Table 3.1 Simulation results ... 45
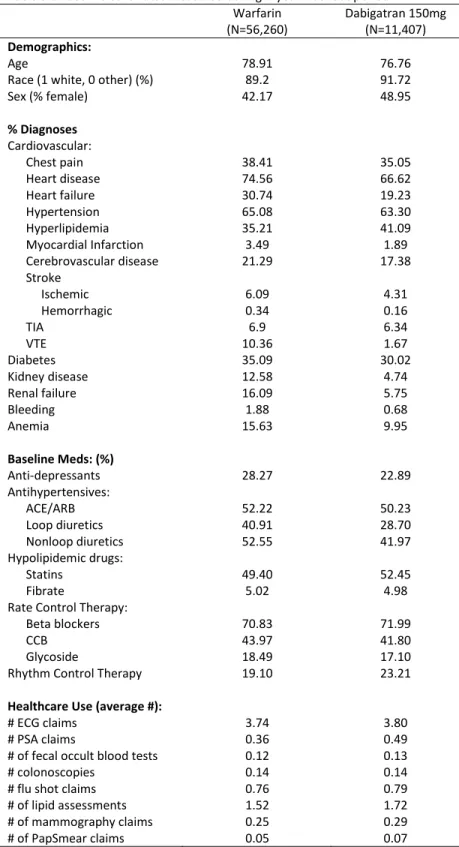
Table 3.2 Baseline covariates measured during 1-year washout period ... 46
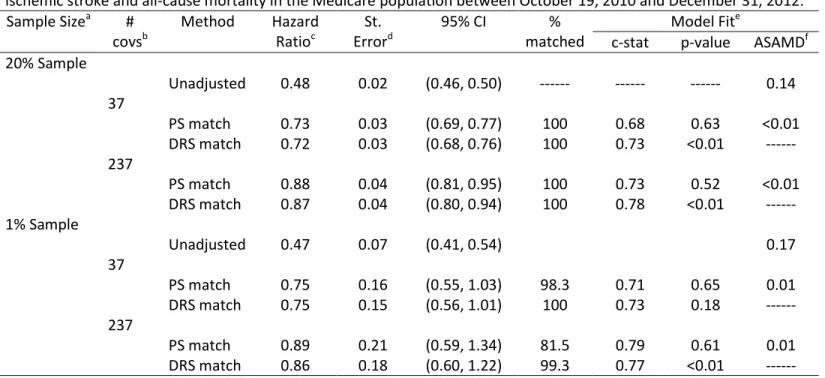
Table 3.3 Empirical results comparing new users of dabigatran vs warfarin ... 47
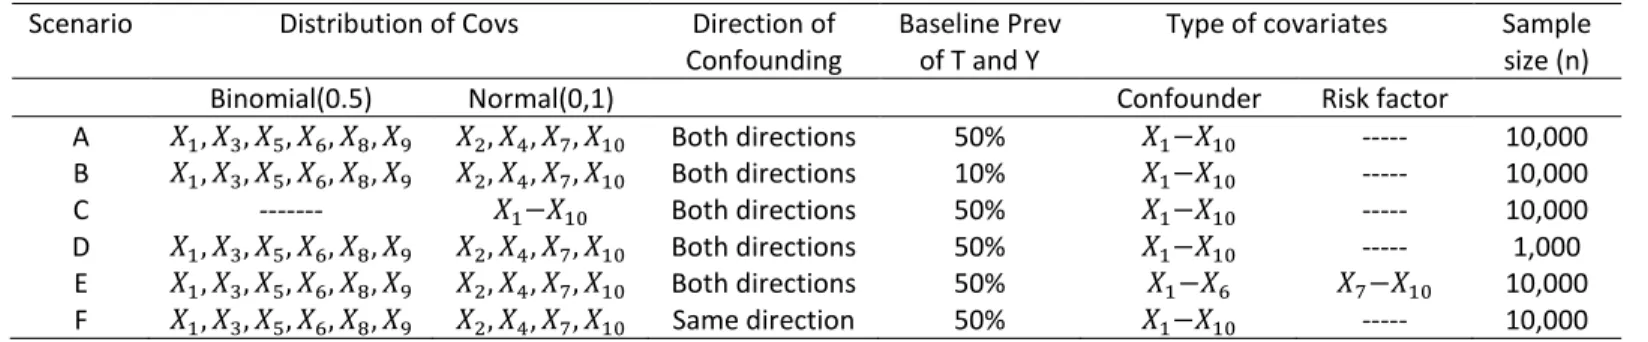
Table 4.1 Simulation scenarios ... 68
Table 4.2 Baseline covariates during 1 year washout period ... 69
xi
LIST OF FIGURES
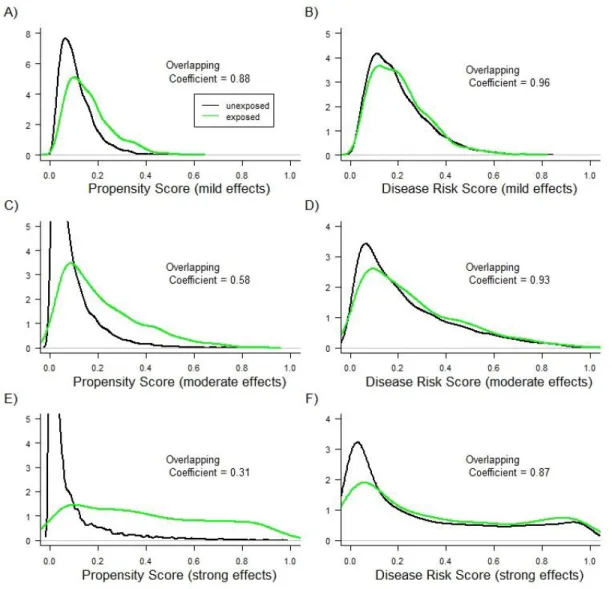
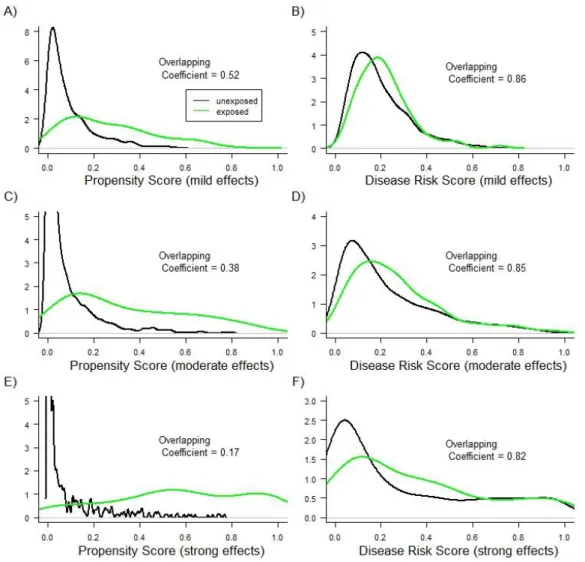
Figure 3.1 PS and DRS distributions across treatment groups with a sample size of 10,000 ... 48
Figure 3.2 PS and DRS distributions across treatment groups with a sample size of 1,000 ... 49
Figure 3.3 PS and DRS distributions across dabigatran and warfarin treatment groups for a 20 percent sample of the Medicare data ... 50
Figure 3.4 PS and DRS distributions across dabigatran and warfarin treatment groups for a 1 percent sample of the Medicare data ... 51
Figure 4.1 Box plots of the correlation coefficients for all parameter combinations ... 71
Figure 4.2 Measures for evaluating DRS models plotted against the absolute bias in the effect estimate ... 72
xii
LIST OF ABBREVIATIONS
AF Atrial fibrillation
CVD Cardiovascular disease
DRS Disease risk score
ICD-9 International classification of disease, 9th edition
HR Hazard ratio
PS Propensity score
RCT Randomized controlled trial
1
CHAPTER 1
BACKGROUND AND SPECIFIC AIMS
1.1 Specific Aims
Controlling large numbers of confounding variables presents unique challenges
when evaluating new treatments in comparative effectiveness research. Summary scores,
which reduce covariate information to a single dimension, have become increasingly
popular for controlling large numbers of baseline covariates. The propensity score, defined
as the conditional probability of treatment given a set of measured covariates, has become
the most widely used summary score in pharmacoepidemiologic research.1, 2 It has been
hypothesized, however, that modeling the PS during early periods of treatment
introduction can be difficult as the number of individuals receiving the new treatment can
be small and factors affecting treatment assignment can change rapidly during early periods
of dissemination.3, 4
An alternative summary score to the PS is the prognostic score, also known as the
disease risk score (DRS). Instead of modeling covariate associations with treatment, the DRS
models the relationship between covariates and the potential outcome under the control or
comparator treatment.5-7 Because factors affecting disease risk are more stable over time, it
has been proposed that modeling the DRS within historical data prior to treatment
introduction can provide an alternative to the PS for controlling large numbers of covariates
2
validity and potential benefits of a historically estimated DRS remain unclear. In this study
we used both Monte Carlo simulations and empirical data to examine the benefits of using
a historically estimated DRS for controlling large numbers of covariates when evaluating
new treatments. We further develop and evaluate methods for assessing the validity of DRS
models directly in their ability to control for confounding. Empirical analyses focused on
comparing of the new oral anti-coagulant dabigatran with warfarin in preventing combined
ischemic stroke and all-cause mortality using Medicare claims data. There has been recent
interest in the use of new oral anticoagulant drugs as an alternative to warfarin for patients
with atrial fibrillation.8-10 Although clinical studies evaluating these new drug classes have
shown promising results,10 their comparative effectiveness in real world patient populations
remain largely unknown. With limited data at the beginning of drug approval, estimation of
the PS as a function of large numbers of covariates can be problematic. In contrast,
estimating the DRS within historical data could allow researchers to effectively control for
large numbers of covariates immediately after drug approval, when data on safety is most
important. Improved methods for confounding control during early periods of drug
approval and evolving drug therapies can enhance treatment decisions for healthcare
providers and the patient community.
Aim 1: Use both Monte-Carlo simulations and empirical analyses to better
understand potential benefits of using a historically estimated DRS when controlling large
numbers of confounding variables during early periods of drug approval. The empirical
3
anticoagulant medication dabigatran compared with warfarin in preventing ischemic stroke
and all-cause mortality in patients with atrial fibrillation in the Medicare population.
Rationale:There remains little evidence and understanding of the benefits of a
historically estimated DRS compared with traditional PS methods in practice. It remains
unclear what specific advantages the DRS provides over traditional PS methods.
Aim 2: Use both simulations and substantive analyses to develop and compare novel
strategies for evaluating risk models in their ability to control for confounding.
Rationale:Accuratelymodeling the DRS presents unique challenges that are not
shared by traditional outcome regression modeling or PS estimation. These difficulties
highlight the importance of evaluating the validity of the fitted risk model in its ability to
control for confounding. The validity of fitted DRS models has primarily been assessed
through measures of predictive performance which give an indirect assessment of the
ability of the DRS to control for confounding. Recent methods that use the control
population to create pseudo treatment and pseudo control groups have been proposed as a
more direct measure for assessing the validity of risk models in terms of confounding
control. It remains unclear what metrics are optimal for evaluating risk models.
1.2 Comparative Effectiveness Research
Randomized controlled trials (RCTs) are the gold standard for evaluating the
performance of a treatment or drug.11 The strict design of RCTs, including randomization
and blinding, ensures the internal validity and effective control of variables that may bias
results. However, information provided by RCTs can be limited for real world clinical
4
sizes and shorter durations of treatment.12-15 RCTs can also have limited generalizability
due to restrictions placed on study participation including age, comorbidity and
co-medication.13, 14 Further, RCTs often assess efficacy versus placebo rather than versus an
alternative treatment for the same indication.
Comparative effectiveness research has gained considerable attention in recent
years. It is becoming increasingly recognized that RCTs cannot address every question
regarding treatment decisions for patients in real world clinical practice. Large automated
healthcare databases, such as administrative data and electronic medical records, are
increasingly being used to evaluate drug performance and safety.15 Compared with RCTs,
observational studies are better suited to provide information on drug utilization as well as
benefits and harms of drugs in real world settings with populations covering a wide range of
patient characteristics.11, 14, 15 Automated databases can provide valuable information on
the real time performance of medical treatments. This is critical for the active surveillance
of drug effects in real world populations.16 Observational studies using healthcare and
administrative datasets complement RCTs to improve healthcare providers’ decisions
regarding drug and treatment choices.15 However, the evaluation of drug effects using
observational data is susceptible to both measured and unmeasured confounding that is
caused by the lack of randomization. The validity of studies using automated databases is
limited by the ability of current statistical and epidemiologic methods to effectively control
5
1.2.1 Current Methodological Limitations
The continual development and application of novel methods is essential to reduce
bias in observational studies and more accurately address important public health issues
regarding drug effects and treatment decisions in real world populations. The development
of improved methods for confounding control is particularly needed during early periods of
drug approval.3 During these early periods, there is often rapid change over time in drug
prescribing patterns or in the use of a treatment.4 New users of a recently approved drug
will often have different patient characteristics than new users of the same drug after the
drug has been on the market for an extended period of time. Such changes over early
periods of drug approval present significant challenges for comparative effectiveness
research and can make rapid response for drug safety difficult. Developing improved
methods to control for confounding during early periods of drug approval is needed to
provide the best evidence for treatment decisions during these early stages.
Standard methods for confounding control have traditionally consisted of multiple
regression models. Although useful in many situations, these methods are limited for
studies involving large numbers of confounders due to computational complexity, the high
likelihood of model misspecification and the limited ability to model more complicated
functional relationships such as interactions and higher order terms for rare outcomes.7 To
address these limitations, methods that collapse the information of a large number of
covariates into a single-dimensional summary score and then use this summary measure for
6
1.3 Summary Scores and Causal Inference
1.3.1 Counterfactual Framework
The Neyman-Rubin counterfactual framework provides a formal framework for
researchers to determine causal effects in both experimental and non-experimental
studies.18-20 Under the counterfactual model for causal inference, each person in the study
population has a potential outcome corresponding to each possible treatment level. For
example, if represents a dichotomous treatment, then represents the potential
response had the individual received treatment and the potential response had the
individual received the control or comparator treatment. In practice, only one of the
potential outcomes is observed for each individual. The observed response, , has the
following relationship with the potential outcomes
.
The treatment variable, , is said to have a causal effect on the observed outcome,
, for a given individual if . For a population of individuals, has an average causal
effect on within the entire population if , where and represent
the expected or average value of the random variables and respectively.
A fundamental obstacle in non-experimental studies is estimating treatment effects
in the presence of confounding factors. If controlling for a set of baseline covariates, ,
results in treatment assignment being independent of potential outcomes, then average
treatment effects in the population are identifiable.19 Known as the strongly ignorable
treatment assignment assumption, this condition is formally expressed as
7
Heckman21 showed that when estimating the treatment effect on the treated, the strongly
ignorable treatment assignment assumption is unnecessarily restrictive and the weaker
condition, , is sufficient. Known as the weakly ignorable treatment assignment
assumption, this condition is sufficient to identify average treatment effects on the treated
population.5, 21
1.3.2 Propensity Score Methods
For a dichotomous treatment, , the propensity score is defined as the conditional
probability of treatment assignment given a set of baseline covariates, . Formally
expressed as , Rosenbaum & Rubin1 show that conditioning on the PS
results in covariates being independent of treatment assignment, formally denoted as . If treatment assignment is strongly ignorable given a set of baseline
covariates, i.e. , Rosenbaum & Rubin1 show that treatment assignment is
strongly ignorable given the PS, i.e. . This independence allows for the
identification of average treatment effects in the full study population or average treatment
effects in subgroups of the study population, e.g., the treated population. If treatment
assignment is weakly ignorable, i.e. , then conditioning on the propensity score
satisfies allowing for the identification of average treatment effects in the
treated population.
The development and advancement of PSs in various applications and settings has
been a key factor for improved methodological standards and validity when evaluating drug
effects in non-experimental settings. However, the performance of PSs is limited in certain
8
or emerging treatments.22 Factors affecting treatment assignment are not necessarily
biological in nature and are more likely to vary and change over time compared to factors
that affect the outcome or disease.3, 6, 7 For example, physicians becoming more familiar
with a new treatment may extend the indication to patients with less severe disease or
more severe co-morbidities. Other situations where transient factors affect indication for
treatment include a newly approved treatment quickly diffusing through the market and
the issuance of black box warnings. Modeling the PS can potentially be difficult when
factors affecting treatment assignment change over short periods of time.
The PS is also not a natural measure to evaluate treatment effect heterogeneity.
When making treatment decisions, clinicians are almost always concerned about how the
effect of a treatment varies over various patient profiles affecting the risk for the outcome
of interest (e.g., 10 year risk for cardiovascular disease based on the Framingham risk
score). Although the PS allows us to detect and account for treatment effect heterogeneity,
it does not provide the best information for health care providers in determining what
subgroups of the patient population are most likely to benefit from a given treatment
regime.
1.3.3 Disease Risk Score Methods
The disease risk score (DRS) has been shown to be a valid alternative to PSs for
controlling large sets of confounders.5, 7, 23, 24 Originally introduced by Peters in 194125 as a
way to reduce dimensionality when matching, the DRS has been used by a variety of
researchers to control for confounding and assess treatment effect heterogeneity.26, 27 The
9
variables with a single-dimensional score.27 Unlike PSs, however, DRSs summarize the
associations of baseline covariates with the potential outcome under the control therapy
instead of treatment, i.e., the risk for the outcome.
Despite the early introduction of DRSs, their use was inhibited in part due to an early
study by Pike, et al.28 that examined their statistical properties.6, 28 Pike demonstrated that
adjustment for the DRS can result in exaggerated statistical significance of effect
estimates.28 After reexamining these findings, Cook & Goldman29 found that this
exaggeration is small except when there is a very strong correlation between confounders
and the exposure (correlation coefficient exceeding 90%), which is unlikely to occur in
practical settings.6, 7, 29 Leacy further explains that this exaggeration in statistical significance
is due to issues of model misspecification rather than the statistical properties of the DRS.30
Recently, Hansen5 has solidified the theoretical foundation for the use of DRSs in
causal inference. Hansen showed that the DRS acts as a prognostic balancing score that can
yield valid effect estimates with a causal interpretation.5 Formally Hansen defines the
prognostic score, or disease risk score, as any scalar or multi-dimensional function of that
satisfies the condition .5 In other words, conditioning on the DRS results in a
form of covariate balance where the potential response under control is independent of a
set of measured covariates, . If the outcome follows a generalized linear model, Hansen5
shows that one possible prognostic score, or DRS, is the linear predictor of , or the
conditional mean of given (i.e., ). Hansen5 further shows that if treatment
assignment is weakly ignorable given a set of baseline covariates, i.e. , then
10
estimates of the treatment effect in the treated population through stratification or
matching on the DRS.
Using simulations, Arbogast and Ray7 evaluated the properties of effect estimates
when applying DRSs. Their study showed the DRS to perform similar to PSs and outcome
regression models for the settings evaluated.7 Stürmer et al.24 and Cadarette et al.31 used
data from Medicare recipients to evaluate the performance of disease risk scores compared
to PS methods and traditional outcome regression in real world settings. In these examples,
results were similar from the application of DRSs, PSs, or traditional multivariable
regression.
Due in part to this recent theoretical work and evaluation of the properties of DRSs
using both simulations and empirical data, there has been increased interest in the
application of DRSs to evaluate drug performance.23 Although generally not superior to PSs,
the DRS can be advantageous to PSs for controlling confounding in certain settings.24 For
example, studies with rare exposures (e.g. emerging therapies) and studies involving
multiple therapies can benefit from DRSs which model covariate associations with the
outcome rather than treatment.7, 31 Further, DRSs provide a natural measure to evaluate
treatment effect heterogeneity. Evaluating treatment effect heterogeneity across the
distribution of disease risk provides a straightforward approach for clinicians to identify
subgroups of patients that are most likely to benefit from the treatment, thereby improving
treatment decisions made by healthcare providers.3
Despite this recent attention, there remain many unanswered questions regarding
11
these summary measures should be estimated. Although various strategies for estimation
have been proposed, there remains uncertainty regarding which estimation strategy is
optimal in diverse settings. This uncertainty is particularly acute for studies using large
administrative datasets to evaluate the comparative effectiveness of drugs because there
have been relatively few applications of disease risk scores in these settings. Multiple
researchers have expressed the need for further empirical and simulation studies to clarify
the application of DRSs in real world practice.6, 31
Traditionally, the DRS has been estimated in two ways. The first is to fit a regression
model to untreated individuals within the cohort and then use this model to predict the
disease risk for all individuals within the full cohort. The second is to fit a regression model
to the full cohort (both treated and untreated) as a function of baseline covariates and
treatment, and then estimate the disease risk for each individual after setting treatment
status to untreated.3, 5, 7
Fitting the DRS to the full cohort benefits from increased sample size, but requires
accurately modeling the relationship between the treatment and outcome.5 Hansen shows
that when estimating the DRS within the full cohort, incorrectly modeling the modification
of treatment by baseline covariates (i.e. disease risk) can result in estimated scores that
carry information about the true treatment effect. This non-ancillarity in the estimated
scores can obscure the effect estimate when used for stratified or matching analysis.
Correctly modeling treatment effect heterogeneity by disease risk can be difficult,
particularly for large numbers of covariates. Therefore, Hansen recommends using only the
12
DRS using only the untreated cohort presents its own challenges. Fitting the DRS only within
the untreated cohort can introduce bias by substantially increasing the potential for
overfitting the model.3, 5
Recently, alternative strategies for estimating DRSs that use data from outside the
defined new user cohort have been proposed. Both Hansen and Glynn discuss potential
advantages of using outside data to estimate the DRS.3, 5 Hansen explains that estimating
the DRS within an alternate sample of controls can avoid the complications of overfitting
that can occur when using same-sample estimation. Glynn suggests that out-of-sample
estimation of the DRS can be particularly advantageous when evaluating evolving drug
therapies because the first patient receiving the new treatment can be matched to a
concurrent patient receiving the old treatment based on the estimated disease risk.3
In contrast with predictors of treatment, factors that predict outcome or disease
occurrence are more likely to be biological in nature and less likely to vary over time and be
impacted by physician decisions which can be difficult to identify.3, 6 Because the DRS is
likely to be stable over time and across populations, Glynn proposes that disease risk can be
accurately estimated from either a separate population, or the same population but with
historical data from a period prior to the current study period.3
During early periods of drug approval, there is usually limited data to accurately
estimate either the PS or DRS as a function of large numbers of covariates, particularly for
studies involving rare outcomes or rare exposure. Further, during early periods of a newly
13
assignment. Out-of-sample estimation for the DRS potentially avoids these challenges by
using a sample with sufficient data to accurately estimate the disease risk.
While having the potential to improve confounding control for the early evaluation of
treatment therapies, the performance and potential benefits of historical estimation of
disease risk is not well established. Using observations, or information, from historical data
can present important challenges. Covariate assessments and coding practices can change
over time making a historically estimated DRS not generalizable to future time periods and
populations.
The challenges outlined above when estimating the DRS highlight the importance of
evaluating the validity of fitted DRS models in their ability to control for confounding. If
prognostic balance could be evaluated within the full study population, then measures of
prognostic balance could be used to evaluate the validity of fitted DRS models in a similar
way that measures of covariate balance across treatment groups are used to evaluate PS
models. Prognostic balance, however, can only be evaluated within individuals receiving the
comparator treatment where the potential outcome under control, , is observed. It is
unclear how well measures of prognostic balance within only the control group correspond
to a reduction in bias in the estimated treatment effect. Measuring prognostic balance only
within the comparator group can potentially reward models that are overfit to the control
population. Further, in the presence of unmeasured confounding, the DRS does not result in
prognostic balance within subgroups of treatment, but only marginally within the entire
population.5, 32 Measures of prognostic balance only within the control population can
14
The inability to evaluate prognostic balance within the full study population has led
to researchers evaluating DRS models primarily through measures of predictive
performance, such as the c-statistic and goodness of fit tests. However, it is unclear how
well measures of predictive performance correspond with the ability of DRS models to
control confounding. When fitting PS models, previous studies have shown that measures
of predictive performance do not always correspond well with reduced bias in the
estimated treatment effect.33, 34 Little attention has been given to determining what metrics
are optimal for evaluating fitted DRS models.
1.4 Anti-coagulant medications and cardiovascular disease in patients with atrial fibrillation
Atrial fibrillation (AF) is the most common cardiac dysrhythmia in the United States
and is a growing public health concern.35, 36 AF is an established risk factor for stroke,
cognitive dysfunction, and premature death.37-39 It has been estimated that AF accounts for
up to 15% of strokes in people of all ages and up to 30% of strokes in people over 80 years
of age.40, 41 Results from the Framingham Heart Study showed the prevalence of AF to be
6% and estimated that the lifetime risk for developing AF is approximately 25% for both
men and women 40 years of age and older.39 The Framingham Heart Study has further
shown that the risk for AF increases with age. As the elderly population increases in the
United States, the prevalence of AF is expected to increase substantially over the next few
decades.42
Standard practice for treating patients with AF includes treatment with an
anti-coagulant for the prevention of thromboembolic events.8 Long term oral anticoagulant
15
Warfarin has been the most widely used VKA and has been shown to decrease rates of
stroke in patients with AF in several trials.8, 43 Warfarin reduces blood coagulation by
inhibiting vitamin K-dependent clotting factors. However, the magnitude of the effect on
these factors is variable and difficult to predict. Warfarin is a drug with a very narrow
therapeutic window and pronounced inter- and intraindividual variation of effects on
coagulation. Warfarin thus needs intense monitoring of its effects on coagulation based on
the INR that needs to be kept within a narrow range. Both ineffectiveness (too low INR) and
increased risk of bleeding (too high INR) are quite common. Consequently, AF patients
being treated with warfarin need to be closely monitored to assure that patients are
attaining an effective dose range. Several studies have shown that as many as 45% of
patients on warfarin are not within the therapeutic range for a sufficient period of time.8, 10, 44 Although most patients have been shown to benefit from warfarin, concern for these
potential complications and adverse bleeding events has often led to an underuse of
anticoagulant medications among persons with AF.45, 46 It is estimated that warfarin has
only been used by 30-60% of appropriate patients with AF.45, 47, 48
New oral anti-coagulant medications that focus on inhibiting a specific factor in the
coagulation pathway have recently been developed to overcome the shortcomings of
warfarin.43 There are numerous oral anticoagulant agents in development. The most
advanced in clinical research belong to two drug classes: direct thrombin inhibitors (DTIs)
and factor Xa (FXa) inhibitors.8 Clinical studies evaluating these drug classes in patients with
AF have shown promising results. Dabigatran, a direct thrombin inhibitor, showed reduced
16
in the RE-LY trial.49 The ROCKET-AF trial showed the oral FXa inhibitor Rivaroxaban to be
noninferior to warfarin in reducing rates of stroke and produced no significant difference in
the risk of major bleeding.41 In the ARISTOTLE randomized trial comparing the direct FXa
inhibitor apixaban to warfarin in patients with AF, apixaban was also shown to be
noninferior to warfarin in reducing stroke while resulting in fewer major bleeding events.50
Unlike warfarin, clinical data have further shown that these novel agents have predictable
pharmacokinetic, pharmacodynamics, and anticoagulant response thereby. The predictable
performance of these newer agents reduces the need for dose adjustments and frequent
monitoring of coagulation parameters.8, 9, 51 The abundant clinical data supporting the
efficacy of these novel oral anticoagulant agents has led to the recent FDA approval of
dabigatran in October 2010, rivaroxaban in November 2011, and apixaban in December
2012. In addition to these oral anticoagulants, there are several additional novel
anticoagulant agents in advanced development.
As novel anticoagulants become more widely used, it is possible that there will be a
paradigm shift in the prescribing of anticoagulation treatments for patients with AF.8
Although clinical data suggest increased potential for achieving an effective dose range with
these newer agents without the need for frequent monitoring, the implications on
population level practice have not been adequately evaluated. Ansel52 discusses limitations
of these clinical trials highlighting important inclusion/exclusion criteria that may not
generalize to these new oral anticoagulants having the same performance in real world AF
patients. A systematic review comparing new oral anticoagulants (dabigatran, rivaroxaban
17
bleeding and hemorrhagic stroke, but an increased risk for gastrointestinal bleeding, a more
common event in the elderly.10 Differential performance of these new anticoagulants
between young and elderly populations is not well established.
Many clinicians acknowledge that there are gaps in the current understanding of
how these new medications perform in clinical practice.52-54 Ansell52 asserts that there are
enough unknowns regarding the effects of these new oral anticoagulants that health care
providers and patients should be cautious when using these medications as first line
treatment. Observational research has the potential to supplement information provided by
the randomized trials and improve our understanding of these new anticoagulants in real
world practice and diverse patient populations. In a systematic review conducted by Adam
et al,10 the authors found that the observational literature on adverse events of new oral
anticoagulants is sparse, consisting only of case reports. We seek to improve the
information regarding the performance of recently introduced novel oral anticoagulant
medications by using the previously described methods to thoroughly investigate their
performance in elderly populations using Medicare data.
1.4.1 Early Evaluation of New Oral Anticoagulant Drugs for Patients with Atrial Fibrillation
Due to the very recent approval of these new oral anticoagulants, their evaluation in
non-experimental settings is difficult, in part due to the limited data available to control for
large sets of confounders. Out-of-sample estimation methods for disease risk are
advantageous because these methods can potentially allow for the control of a large
number of risk factors at the start of drug introduction. While Medicare data do not capture
18
this kind of research based on the population-based nature (real world) and the ability to
evaluate clinically relevant outcomes rather than intermediates within a very short time
(because of the overall size of the population).55, 56 This will potentially allow researchers to
effectively evaluate the comparative effectiveness of these newer medications at earlier
19
CHAPTER 2
METHODS
2.1 Study Population
This study consisted of older individuals ages 65 years and older who were
beneficiaries of the Medicare system. Medicare is a national insurance program for all
Americans over the age of 65. Because all elderly Americans are entitled to these benefits,
individuals receiving Medicare are likely to be representative of the general health care
utilization of elderly adults in the US population. However, the Medicare data made
available for research is limited to parts A, B, and D. Medicare part C, which includes
Medicare Advantage plans, is administered by private insurance companies and is not made
publicly available. Medicare part C covers approximately 25% of all Medicare beneficiaries
and contains individuals who tend to have higher socioeconomic status. Furthermore, the
study populations for the research questions in this study excluded individuals who did not
participate in Medicare part D. The exclusion of Medicare part C recipients and individuals
who do not participate in part D may affect the study population to be more representative
of Medicare beneficiaries of lower socioeconomic status.
The Medicare data from the Center for the Medicare and Medicaid Services (CMS)
Chronic Condition Data Warehouse from 2007 to 2012 are available at UNC. The CCW files
include annual enrollment summary, inpatient, outpatient, skilled nursing facility, carrier
20
and prescription Part D event files. The prescription Part D files include the national drug
code of the medication, service data, strength of the medication, days of supply, quantity
dispensed, encrypted and unique prescriber identifier, unique and encrypted pharmacy
identifier, generic drug name, and the benefit phase of the Part D event. All CCW files are
linked by an encrypted and unique CCW identifier number for each beneficiary. We used
100% of patients nationwide who meet the inclusion and exclusion criteria.
2.2 Study Design
We included individuals who were continuously enrolled in the Medicare data at
least 12 months before and through the end of the study period. A new user cohort study
design was used to evaluate the described research questions.11 We identified Rx claims for
dabigatran and warfarin within Medicare A, B, and D claims data. We determined periods of
new use after a pre-specified washout period. New users of dabigatran who had a
prescription claim for the comparator drug during the specified washout period were
excluded. We identified new users of dabigatran and warfarin between the years
2010-2012. The start of this time period corresponds to FDA approval for dabigatran.
We applied a new user cohort design when evaluating the previously described
research questions to mitigate both measured and unmeasured confounding caused by
indication for treatment and healthy users. Confounding caused by indication for treatment
and healthy-users are two primary sources of bias in comparative effectiveness research.
New user designs reduce the potential for healthy user bias by excluding prevalent users.57
Prevalent users of a drug at baseline of follow-up are more likely to have systematic
21
new initiators of the drug.11, 57 In each of the analyses, we further reduced the magnitude of
confounding caused by indication for treatment by comparing the defined exposure to an
active comparator with similar indication.58
All decisions on exclusion criteria for cohort participation were made prior to
treatment initiation and follow-up. Measured confounders were controlled at baseline
using propensity score matching and disease risk score matching.
2.3 Choice of Outcomes
We considered a combined outcome of ischemic stroke and all-cause mortality.
Ischemic stroke was defined as hospitalization with diagnostic codes in the principal or
secondary positions (Primary Dx 430-434). Birman-Deych, et al59 demonstrated that ICD-9
codes for coronary artery disease, stroke, heart failure, and hypertension had high
specificity (>0.95), low sensitivity (<0.76), and a positive predicted value of 0.95 within the
Medicare Part A data. They further demonstrate that miscoding of ischemic stroke events as
hemorrhagic events was rare. Similar findings have been found by other studies evaluating
the validity of ICD-9 codes in other large administrative databases.60
2.4 Variable Selection
For the empirical analysis, we selected a high-dimensional set of covariates using an
algorithm that is similar in concept to the high-dimensional PS.61 We first selected a reduced
set of covariates a priori using expert knowledge. We then included an additional 200
empirically selected covariates that were identified within Medicare files containing
medication claims, inpatient and outpatient diagnostic codes and procedural codes. When
22
within each data dimension of the Medicare data (codes with a prevalence greater than 0.5
were subtracted from 1). Among the codes selected, we then identified the top 200 codes
based on the strength of their univariate association (odds ratio) with the outcome.
2.5 Monte Carlo Simulations
We used Monte Carlo simulations to better understand and evaluate potential
benefits of DRS matching vs PS matching for Aim 1. Simulations were also used in Aim 2 to
compare various measures for evaluating the validity of the specified DRS models.
2.5.1 Simulations for Aim 1
The simulated causal structure for Aim 1 was motivated by the empirical example
comparing new-users of dabigatran with warfarin in preventing ischemic stroke and
all-cause mortality. We simulated 100 baseline covariates to reflect settings involving
high-dimensional sets of covariates. Baseline covariates included a mixture of both continuous
and dichotomous random variables. We simulated a dichotomous treatment as a function
of the 100 baseline covariates. We then simulated a dichotomous outcome as a function of
the 100 baseline covariates and treatment.
We considered four scenarios where we varied the sample size and the strength of
the effects of covariates on both the treatment and outcome. We allowed coefficients to be
both positive and negative to reflect practical settings where baseline covariates induce
confounding in both directions. We implemented the PSs and DRSs using 1 to 1 caliper
matching where calipers were defined as .01 standard deviations of the respective PS or
DRS distribution. We compared the performance between PS and DRS matching by
23
estimate and the true effect, by taking the mean of this difference over all simulation runs.
The mean squared error (MSE) was calculated by taking the mean of the squared bias over
all simulation runs. We evaluated the precision of the effect estimates using the empirical
standard deviation of the distribution of the treatment effect estimates across all simulation
runs.
2.5.2 Simulations for Aim 2
We created a variety of populations where we varied the causal structures, covariate
distributions and covariate associations. We evaluated scenarios which include rare
outcomes, rare exposures and small sample sizes. In comparison to the complexities of real
world data, these simulated populations were simplified in order to obtain a general
understanding of the statistical properties and performance of various measures for
evaluating the validity of DRS models. Simulations allow us to identify specific settings and
parameters which systematically affect the performance of each of the described methods
for confounding control.
2.6 Aim 1: Evaluating Potential Benefits of the Disease Risk Score
We will evaluate potential benefits of matching on the DRS compared to matching
on the PS. Potential benefits of the DRS remain largely unclear with few studies
demonstrating the application of DRSs in large database research.
2.6.1 Overlap in the distribution of disease risk across treatment.
Strong channeling can create separation in the PS distribution across treatment
groups during early periods of drug approval. This can reduce the number of individuals
24
effect within a large portion of treated patients, particularly when controlling for large
numbers of covariates.
A theoretical advantage of the DRS that has not been discussed is that the degree of
overlap in the DRS distributions across treatment groups will always be as at least as large
as the overlap in the PS distributions across treatment groups. Greater overlap in the DRS
distributions can potentially allow for a greater number of individuals to be compared when
matching on the DRS compared to matching on the PS.
The reason for greater overlap in the distribution of disease risk across treatment is
because of differences in the balancing properties of the PS compared with the DRS.
Matching treatment groups on the PS is a more restrictive condition then matching
treatment groups on the DRS. Matching on the DRS does not require covariates to be
balanced across treatment groups and can include individuals who systematically have
differing covariate distributions across treatment groups, but similar overall risk for the
outcome.5
More formally, because matching on the PS renders baseline covariates
independent of treatment assignment within the matched population, any function of
baseline covariates will also be independent of treatment assignment including the DRS.
Formally,
25
implying that . In other words, once we condition on the PS, the
covariate vector, , or any function of , including the DRS, does not provide any additional
information about treatment assignment.
2.6.2. Controlling for instrumental variables
Including instrumental variables within the PS can also increase the separation in the
PS distribution across treatment groups further limiting the number of patients that can be
matched or compared. In addition, both theory and simulations have shown that controlling
for variables that do not affect the outcome except through treatment (instrumental
variables) can reduce the precision of effect estimates and amplify bias caused by
unmeasured confounders.62, 63
Unmeasured confounding is a fundamental obstacle inpharmacoepidemiology and
observational research in general. Primary sources of unmeasured confounding in
comparative effectiveness research arise from 1) confounding by indication for treatment
and 2) confounding caused by frailty.57, 64, 65 For example, physicians’ treatment decisions
may be based on an evaluation of the patient’s health status and prognosis, the patient’s
theoretical response to treatment, the physician’s past experience with the treatment, or
an assessment of the patient’s ability and willingness to undergo the treatment (e.g., take a
medication as prescribed).66 Further, patients who initiate a preventive medication may be
more likely than other patients to engage in other healthy, prevention-oriented behaviors
leading to bias known as the healthy user effect.67, 68 Conversely, patients in whom the
expected benefit is unlikely to materialize (e.g., because of overwhelming competing risks)
26
therapies. These types of confounding usually result in the distributions of unmeasured
covariates being systematically different between treatment groups.
For studies involving large numbers of covariates, identifying instrumental variables
can be challenging. Pharmacoepidemiologic and medical studies utilizing automated
databases often involve large numbers of potential covariates that have not been selected
with a specific research question in mind and where a multitude of factors other than the
prognosis strongly influence treatment decisions.
While the potential for including instrumental variables is highest for a model
predicting treatment (the PS), it is important to realize that it is not generally avoided by
modeling the risk for the outcome. Once we condition on treatment (either by modeling
treatment or by restricting to the untreated), instrumental variables will become associated
with the outcome via the unmeasured confounders. The DRS, if estimated within the study
population, will also tend to be affected by bias amplification in the presence of
unmeasured confounders.
By modeling covariate associations with the outcome within historical data prior to
treatment introduction, the DRS implicitly avoids controlling for instrumental variables.32
Out-of-sample estimation of DRSs is therefore likely to minimize bias caused by
unmeasured confounding compared with PS methods or outcome regression models,
including conventionally estimated DRSs. These potential advantages of greater overlap in
the DRS distribution across treatment groups and the avoidance of controlling for
27
for a larger proportion of treated individuals to be compared during periods where the
number of individuals receiving the new treatment therapy can be small.
2.7 Aim 2: Model Validation
2.7.1. Validation of Propensity Score Models
We will evaluate the validity of the specified PS models by calculating the average
standardized absolute mean difference (ASAMD) of the measured covariates across
treatment groups, where the ASAMD for a single covariate is defined as
where
the value of for the ith individual in the treatment group,
number of individuals in the treatment group,
sample variance of in the treatment group.
The ASAMD is a straightforward measure to summarize covariate balance and has
been shown to perform well compared to other measures of covariate balance when
evaluating the validity of PS models in their ability to control confounding.69, 70
2.7.2. Validation of Disease Risk Score Models
Hansen5 showed that unlike propensity balance where covariates are balanced with
respect to treatment within the entire study population, conditioning on the DRS results in
‘prognostic balance’ where covariates are balanced with respect to the potential outcome
under the comparator treatment. Because this potential outcome is not observed for each
28
directly in terms of prognostic balance across the entire population. It remains unclear what
measures are optimal for evaluating risk models in their ability to control for confounding.
Within the simulated populations, we evaluated the correlation between various
measures for assessing the validity of fitted DRS models and bias in the estimated treatment
effect. We evaluated the predictive performance of the estimated DRSs by assessing the
calibration and discrimination of the predicted values. The calibration was assessed using
the Hosmer-Lemeshow goodness of fit test71 defined as
where
number of observations in the gth group,
observed number of cases in the gth group,
expected number of cases in the gth group.
We also evaluated the calibration of predicted values by calculating the prediction
error for each DRS model. The mean prediction error was calculated as
,
where the observed response for individual and is the predicted response from
the risk model.
We assessed the discrimination of the predicted values by calculating the c-statistic
defined as the area under the receiver operating characteristic curve.72 This curve is a plot
29
calculated by comparing all disjoint pairwise combinations of individuals and calculating the
proportion of those combinations where the predicted value for the individual with the
event is higher than the predicted value for the individual with no event.
Finally, we evaluated the performance of a resampling method proposed by
Hansen73 that assesses the validity of DRS models in their ability to control for confounding
rather than their predictive performance. This strategy draws weighted samples from the
control population to create “pseudo treatment” and “pseudo control” groups so that the
distribution of covariates across the pseudo treatment groups are representative of those
across the treatment groups in the original study cohort. With no treatment effect
separating the pseudo treated and pseudo control groups, the fitted DRS models can be
evaluated directly in their ability to control for confounding within the pseudo population.
The pseudo treatment and pseudo control groups are created as follows:
1. Estimate the propensity score for each individual in the study population.
2. Create a pseudo treatment group by taking a weighted sample of
individuals from the control population with weights proportional to the
odds of receiving treatment. Formally,
where weight for individual and propensity score for
individual .
3. Sampling in step 2 can be done with or without replacement. When sampling
30
individuals from the control population with weights equal to one. If
sampling without replacement, the pseudo control group is created by
simply taking individuals from the control population that were not selected
for the pseudo treatment group in step 2 (the complement of the pseudo
treatment group).
Sampling the pseudo treatment group with replacement is similar in concept to
standardized mortality ratio weighting where a subset of the control population is weighted
so that the propensity score distributions between the weighted control group (which in
this case is the pseudo treatment group) and treatment group in the original study cohort
are exchangeable. Because , where is a set of measured baseline covariates
and is the propensity score, this exchangeability on the PS implies exchangeability on
the measured covariates . With the covariate distributions across the pseudo treatment
groups being representative of those within the actual treatment group, we can perform a
“dry run” by fitting the DRS within the pseudo control group, or a historical set of controls,
and then evaluating its ability of the fitted model to control for confounding within the full
pseudo population. Since the degree of confounding within the pseudo population should
be representative of confounding in the original study cohort, DRS models that successfully
control for confounding within the pseudo population should also control for the same
measured confounders within the original study cohort.
When sampling with replacement, the same individuals can potentially be sampled
many times over. Sampling without replacement avoids this problem, but requires a more
31
individual change with each draw from the finite population. Chen & Dempster74 describe a
method to maximize information when taking a weighted sample without replacement
32
CHAPTER 3
USING DISEASE RISK SCORES TO CONTROL LARGE NUMBERS OF COVARIATES IN COMPARATIVE EFFECTIVENESS RESEARCH OF NEW TREATMENTS
3.1 Introduction
Evaluating the comparative effectiveness of newly introduced treatments presents
unique challenges in pharmacoepidemiologic research. The propensity score, defined as the
conditional probability of treatment given a set of observed covariates, has become a
standard tool for controlling large numbers of confounding variables.1, 2 However,
accurately modeling the PS for a new treatment can be difficult if the treated population is
small or factors affecting treatment assignment change rapidly.3, 4
In a recent paper, Glynn et al.3 proposed using an alternative covariate summary
score, the disease risk score (DRS), to control for confounding in settings involving new
treatments. Unlike the PS, which models covariate associations with treatment, the DRS
models covariate associations with the outcome within the control or comparator
treatment group. Glynn et al. argued that factors affecting disease risk are more likely to be
stable over time than are factors affecting treatment, potentially simplifying the estimation
of the DRS compared to a time-varying PS. Glynn et al. also advocated using data collected
prior to the introduction of the new treatment to avoid overfitting and provide ample data
33
Little evidence exists to confirm the theoretical advantage of a historically estimated
DRS over a traditional PS when evaluating new treatments. A number of studies have shown
that simply fitting time-specific PS models can perform well when the indication for
treatment changes rapidly over time.4, 75 Further, the limitations of the PS when the number
of exposed individuals is small are not well understood. Previous studies have also shown
that overfitting the PS model does not necessarily compromise confounding control.76
There remain few examples demonstrating the application of a historically estimated DRS
when evaluating new treatments. Potential advantages and challenges of using DRSs in
these settings remain unclear.
In this paper, we use both simulations and an empirical example to compare the
performance of the DRS with that of the PS when controlling large numbers of covariates in
settings involving newly introduced treatments. We discuss both challenges and potential
advantages of using the DRS for confounding control as well as required assumptions for
using historical data to model the DRS. We then evaluate the performance of DRS matching
with PS matching in an empirical example where we compare the new oral anticoagulant
dabigatran with warfarin in preventing ischemic stroke and all-cause mortality in patients
diagnosed with atrial fibrillation (AF) in the Medicare population.
3.2 Background
In comparative effectiveness research, investigators are often interested in
comparing two alternative treatment therapies. Following Rubin’s77 description of the
counterfactual framework, let represent the potential response had the individual
34
the comparator or control treatment. In practice, only one of these potential outcomes is
observed for each individual.18, 19
Hansen5 formally defines the DRS as any scalar or multidimensional function of a set
of baseline covariates, , that, when conditioned on (e.g., matching or subclassification),
results in being independent of . In the absence of unmeasured confounding, this
independence is sufficient to identify average treatment effects in the treated population.5, 21 If the outcome follows a generalized linear model, one possible DRS is the linear predictor
of , or the conditional mean of given (i.e., ). Because is observed only for
individuals receiving the comparator treatment, in practice the DRS must be estimated
indirectly for the treated population.
Challenges when modeling the DRS. The DRS has typically been estimated in two
ways. The first is to fit a regression model within the cohort of individuals receiving the
comparator treatment and then extrapolate this model to predict disease risk for the full
cohort. The second is to fit a regression model for the full cohort (i.e., both treatment and
comparator groups) as a function of baseline covariates and treatment, and then estimate
the disease risk for each individual after setting treatment status to zero.3, 5, 7, 27, 31 Fitting
the DRS to the full cohort benefits from increased sample size, but requires accurately
modeling the relation between treatment and outcome. Small misspecifications in the
full-cohort DRS model can introduce bias by resulting in estimated scores that are non-ancillary,
or carry information about the treatment effect.5, 30 Consequently, Hansen5 recommends
using only the control population when fitting the DRS model. Leacy30 explained that using
35
are more robust to model misspecification. Fitting the DRS only among individuals receiving
the comparator treatment, however, can lead to overfitting,5 which results in
overestimating disease risk for high-risk comparator patients and underestimating disease
risk for low-risk comparator patients. Such overfitting can lead to apparent treatment effect
heterogeneity over the distribution of disease risk and potentially bias overall effect
estimates.3, 5
Both Hansen5 and Glynn et al.3 have proposed using controls from a period prior to
the current study to fit the DRS model. Glynn et al. suggested that estimating the DRS with
historical data can be particularly advantageous in pharmacoepidemiologic studies using
large administrative healthcare databases to evaluate newly introduced treatments or
evolving drug therapies. This approach can avoid overfitting the risk model to the
comparator group within the study cohort, but assumes that the effects of risk factors on
the outcome, surveillance of individuals, and coding practices do not change over time.
Violation of these assumptions could result in fitted DRS models that are not generalizable
to the study population.
Potential benefits of matching on the DRS. A theoretical advantage of the DRS that
has not been widely discussed is that the degree of overlap in the distribution of disease risk
across treatment groups will always be at least as large as the overlap between the PS
distributions. This is due to the fact that matching on the PS is more restrictive than
matching on the DRS. Matching on the PS will only include individuals who, in expectation,
have similar covariate distributions across treatment. Matching on the DRS, however, will
36
treatment, but can also include individuals who systematically have differing covariate
distributions across treatment, but similar overall risk for the outcome.5 More formally,
once covariates are independent of treatment, then any function of baseline covariates,
including the DRS, will also be independent of treatment. Therefore, PS-matched treatment
groups will be balanced on the DRS in expectation. However, because the DRS does not
balance covariates with respect to treatment, but only with respect to , DRS-matched
groups may not be balanced on the PS. The potential for greater overlap in DRS
distributions across treatment groups may allow a larger percentage of the treated
population to be compared when matching on the DRS versus the PS.
3.3 Simulation Study: an Illustrative Example
We simulated a causal scenario that was motivated by an empirical example
(described below) comparing dabigatran with warfarin in preventing ischemic stroke and
all-cause mortality among new users. We simulated 100 baseline covariates. As in most
pharmacoepidemiologic settings, the majority of these baseline covariates were
dichotomous (simulated as binomial random variables). We simulated a dichotomous
treatment and a dichotomous outcome according to equations 3.1 and 3.2.
[3.1]
[3.2]
We considered four scenarios where we varied the sample size and the strengths of
covariate-treatment and covariate-outcome associations. In scenario 1, coefficients in
Equations 1 and 2 were selected randomly from uniform distributions so that the effects of
37
were selected to allow for moderate and strong effects, respectively, on the treatment and
outcome. In Scenario 4 we included treatment effect heterogeneity to demonstrate how
effect estimates can differ when different numbers of individuals are matched on the PS
versus the DRS. We allowed coefficients to be both positive and negative to reflect practical
settings where baseline covariates induce confounding in both directions. We simulated
each scenario with sample sizes of 10,000 and 1,000.
We measured the performance of DRS and PS matching in three ways. We
calculated the bias, defined as the expected value of the difference between the effect
estimate and the true effect, by taking the mean of this difference over all simulation runs.
The mean squared error (MSE) was calculated by taking the mean of the squared bias over
all simulation runs. To evaluate precision, we estimated the standard error using the
empirical standard deviation of the distribution of the treatment effect estimates across all
simulation runs.
3.4 Simulation Results
For simulation scenarios not involving treatment effect heterogeneity, Figures 3.1
and 3.2 show the PS and DRS distributions by treatment group for one simulation run with a
sample size of 10,000 (Figure 3.1) or 1,000 (Figure 3.2). As expected, the degree of overlap
(i.e., area of overlapping region) between the DRS distributions was always larger than the
degree of overlap between the PS distributions. Varying the sample size and the strengths
of covariate-treatment and covariate-outcome associations affected the overlap in PS
distributions more strongly than it affected the overlap in DRS distributions (Figures 3.1 and