2
Acknowledgements
3
Table of Contents
List of Tables and Figures ... 4
Abstract ... 5
Introduction ... 5
Materials and Methods ... 7
Results ... 12
Discussion ... 27
Conclusion ... 30
References ... 32
Appendix I: Survey ... 35
Appendix II: SAS code ... 48
A. Codebook ... 48
B. Analysis Macro ... 64
4
List of Tables and Figures
Table 1: Geographic regions sampled in each country ... 8
Table 2: Definitions of indicators for analysis ... 9
Table 3: Size and demographics of schools surveyed ... 12
Table 4: Sample sizes in water quality model ... 21
Table 5: Bivariate coefficients of water quality model in Kenya ... 21
Table 6: Water quality regression model in Kenya ... 22
Table 7. Average E. coli count of treated water by water source type in Kenya ... 23
Table 8: Bivariate regression coefficients in Rwanda ... 23
Table 9: Full model coefficients in Rwanda ... 24
Table 10: Average E. coli count in school stored water by sanitation facility type in Rwanda ... 24
Table 11: Bivariate regression coefficients in Mozambique ... 25
Table 12: Full model coefficients in Mozambique ... 25
Table 13: Bivariate regression coefficients in Uganda ... 26
Table 14: Full model regression coefficients in Uganda ... 27
Table 15: E. coli count by removal type ... 27
Figure 1: Countries in school analysis and overall study ... 7
Figure 2: Primary and secondary water sources ... 13
Figure 3: Primary water sources types ... 14
Figure 4: Water quality risk categorization ... 14
Figure 5: Proximity and quality of primary water source ... 15
Figure 6: Continuity and reliability of primary water sources ... 16
Figure 7: Sanitation facility types ... 16
Figure 8: Sanitation facility characteristics ... 17
Figure 9: Boy student-to-latrine ratios by country ... 18
Figure 10: Girl student-to-latrine ratios by country ... 18
Figure 11: Handwashing facilities and materials... 19
Figure 12: Percent of schools with water and soap/ash ... 19
Figure 13: Menstrual hygiene facilities ... 20
5
Abstract
Adequate water, sanitation, and hygiene (WaSH) infrastructure can prevent contamination of drinking water and thus reduces disease and death. Attention has been focused on recommendations and monitoring of household WaSH, but less emphasis has been placed on school settings, a place where children spend much of their day. Unlike the Millennium Development Goals (MDGs), the proposed Sustainable Development Goals (SDGs) include schools in the WaSH targets for universal access, however the current level of school WaSH access is understudied. To gauge current levels of WaSH access, quality, quantity, and continuity of service in schools, 2270 schools were randomly sampled in regions of six Sub-Saharan African countries: Ethiopia, Kenya, Mozambique, Rwanda, Uganda, and Zambia. Using surveys developed from internationally established indicators and field- and lab-based microbiological water quality testing, we found a majority of schools had access to safe water: 78% of schools sampled reported access to an improved water source1 and 74% had
stored water with low risk water quality2. Improved sanitation facilities3 were reported in 80% of
schools, but access was largely inadequate: fewer than 25% of schools met the World Health Organization’s (WHO) recommended student-to-latrine ratio. Hygiene indicators reflected fewer than 10% of schools had hand-washing facilities on the day of the survey. All six countries reported fewer than 20% of schools with at least 4 of the 5 recommended menstrual hygiene facilities. These results along with additional indicators reflect low access to sanitation and hygiene in schools, especially compared to the level of access to safe water. Linear regression models testing factors associated with water quality by country provide evidence that improved water sources within 30 minutes for collection significantly improved water quality in Mozambique. Results from Kenya suggest water treatment practices may be improper and inadequate to improve water quality. Given the associations between poor sanitation and hygiene access and adverse health outcomes,
development organizations and governments should emphasize these areas in developing WaSH infrastructure in schools to meet the targets for universal access.
Introduction
An estimated 748 million people lack access to improved water, and 2.5 billion people lack access to improved sanitation (JMP, 2014). Prüss-Ustun et al (2013) estimated that 842,000 diarrheal deaths in the year 2012 were attributable to inadequate access to water, sanitation, and hygiene (WaSH). Safe water and sanitation have been shown to relate to numerous health outcomes, improving one’s overall quality of life and reducing preventable diseases and preventable deaths (Gentry-Shields and Bartram, 2013). In 2000, the United Nations established eight Millennium Development Goals, including target (7c) for improving water and sanitation access at the household level (UN General Assembly, 2000).
WaSH interventions have been shown to help reduce the risk of diarrheal disease (Fewtrell et al, 2005; Cairncross et al, 2010). Although the water source type and latrine facility type are important for limiting contact with bacterial contaminants, hand-washing has shown to be effective in reducing the risk of diarrheal disease up to 42% - 47% (Curtis et al, 2003). Much research has been done to estimate the proportion of people with access to water and sanitation, and to study factors associated with adequate access at the household level, but less emphasis has been placed on
1The Joint Monitoring Programme (JMP) of WHO/UNICEF defines an “improved” water source as one that prevents
contamination based on how it was constructed and how it is used (see definitions in Table 2).
2 The lowest risk water quality is <1 E. coli count per 100 mL (WHO, 2011).
6
extra-household settings, particularly schools, which are considered one of the six main non-household settings (Cronk et al, 2015).
Schools are important extra-household settings for adequate WaSH access because children are more susceptible to waterborne illnesses (Prüss-Ustun, 2014). Studies have documented higher rates of infectious, gastrointestinal, neuro-cognitive and psychological illnesses where school children were exposed to inadequate water and sanitation facilities in developing and developed countries (Jasper et al, 2012), which makes schools especially important settings given that
respiratory and gastrointestinal diseases are leading causes of death of children worldwide (WHO, 2010). Although the studies showing neurocognitive and psychological effects were based in the United States and primarily evaluated lead contamination, hardly any research has been conducted of such exposures in schools in low-resourced settings around the world. Further, poor water supply and the need to walk long distances to a source has been shown to lead to dehydration and poor education outcomes (Bar-David et al., 2005).
Recent studies of WaSH programming in schools have shown its impact. In a study of schools in the Nyanza province of Kenya, Garn et al (2013) found that comprehensive WaSH programs in schools improved school enrollment and gender parity. Freeman et al (2012), in a randomized control trial of interventions, found school WaSH improvements in the Nyanza
province of Kenya positively impacted female student attendance. Dreibelbis et al (2013) found that, in addition to access to WaSH at home improving school enrollment, the quality of latrines at school was the most important factor influencing school attendance. Further, because they are settings where students learn and interact, schools have the capacity for teaching practices and developing behaviors specific to WaSH.
Although the importance of providing and monitoring adequate WaSH in schools is
becoming increasingly recognized, the implementation of programs lags substantially. The 2014 UN-Water GLAAS report, a biannual assessment of drinking water and sanitation in 94 developing countries, stated that while over 75% of the countries had nationally approved policies, only 22% had plans that were fully implemented and reviewed (UN, 2014). Over a third of the countries reported targets for universal access for water and sanitation, and nearly 30% reported the same goal for hygiene promotion.
For the first time, schools are proposed as target settings for WaSH development in the next set of international development goals in 2015, the Sustainable Development Goals (SDG). The international community, along with many national governments, recognize the importance of WaSH promotion and access in schools, yet the current level of access and the appropriate monitoring techniques are largely unknown. In 2013, UNICEF reported the compiled data of indicators of WaSH access in schools across multiple countries in southern and eastern Africa (UNICEF, 2013). Since the data were reported by each country, indicators across countries are not easily compared due to the lack of standardization of terminology and methodology, and of information collected in monitoring.
This study represents the largest known cross-country study of water, sanitation, and hygiene in schools. This study used internationally established guidelines for determining the survey data to collect, and used the same methods across countries, which allows for direct comparison. This research presents crucial information regarding the status of WaSH in schools for policy-makers and practitioners, as the next set of development goals commences in 2015. With a new overarching goal of universal access to WaSH in schools proposed in the SDGs, several indicators have been
7
Given the evidence for gaps in WaSH access in schools described above, it is also unknown which factors should be prioritized in creating an agenda for school WaSH interventions. Using the Escherichia coli (E. coli) water quality data to estimate health risk, a linear regression model was run to determine the factors associated with better and worse water quality, and thus the factors that should be prioritized.
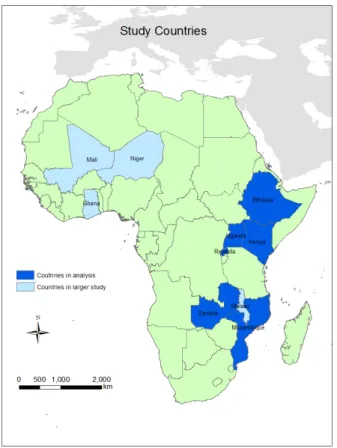
This research, on behalf of World Vision International and the University of North Carolina at Chapel Hill (UNC) Water Institute, presents the status of WaSH in schools across six countries in Sub-Saharan Africa (Figure 1). The countries include: Ethiopia, Kenya, Mozambique, Rwanda, Uganda, and Zambia. The results serve as a baseline understanding of the quality, quantity, continuity and reliability of WaSH access in the sampled regions of these six countries, so that development and governing organizations can create agendas to help bring the world into an era of universal access (JMP, 2014).
Figure 1: Countries in school analysis and overall study
Materials and Methods
Study population and design
8
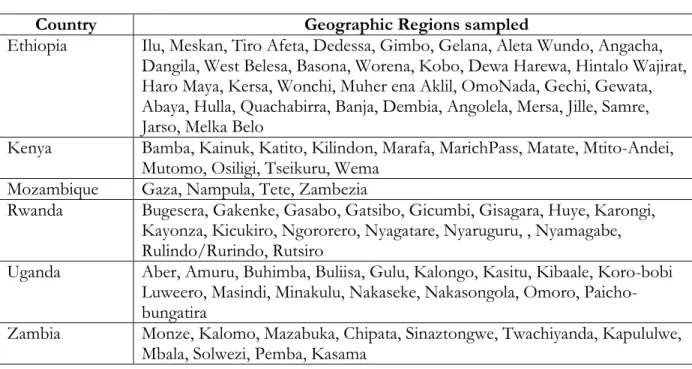
Within each country, schools were sampled from the regions where World Vision supports programs, primary rural settings. A stratified random sample of World Vision schools and non-World Vision schools was generated from the list of schools in these regions, shown in Table 1.
The sample size of schools in each country was determined from calculations to detect a difference between access to improved water sources between the World Vision and non-World Vision groups. Power of 0.8, confidence intervals at 95%, and 𝑝1 = 0.5 and 𝑝2 = 0.6 were used in the calculation. In each country, the calculated sample size, 810 with 405 in each group, either exceeded the total frame size in each country or was logistically too difficult for surveyors to
complete. As a result, school sample sizes were reduced to reach a more manageable sample for each country. Since disproportionate samples were taken from each stratum, the data were weighted to allow for population estimates.
Table 1: Geographic regions sampled in each country
Country Geographic Regions sampled
Ethiopia Ilu, Meskan, Tiro Afeta, Dedessa, Gimbo, Gelana, Aleta Wundo, Angacha, Dangila, West Belesa, Basona, Worena, Kobo, Dewa Harewa, Hintalo Wajirat, Haro Maya, Kersa, Wonchi, Muher ena Aklil, OmoNada, Gechi, Gewata, Abaya, Hulla, Quachabirra, Banja, Dembia, Angolela, Mersa, Jille, Samre, Jarso, Melka Belo
Kenya Bamba, Kainuk, Katito, Kilindon, Marafa, MarichPass, Matate, Mtito-Andei, Mutomo, Osiligi, Tseikuru, Wema
Mozambique Gaza, Nampula, Tete, Zambezia
Rwanda Bugesera, Gakenke, Gasabo, Gatsibo, Gicumbi, Gisagara, Huye, Karongi, Kayonza, Kicukiro, Ngororero, Nyagatare, Nyaruguru, , Nyamagabe, Rulindo/Rurindo, Rutsiro
Uganda Aber, Amuru, Buhimba, Buliisa, Gulu, Kalongo, Kasitu, Kibaale, Koro-bobi Luweero, Masindi, Minakulu, Nakaseke, Nakasongola, Omoro, Paicho-bungatira
Zambia Monze, Kalomo, Mazabuka, Chipata, Sinaztongwe, Twachiyanda, Kapululwe, Mbala, Solwezi, Pemba, Kasama
Data collection
Data were collected through a specialized survey and water quality sampling. The survey was created by the UNC Water Institute project team and used in each of the six countries. The survey questions targeted indicators of international standards in WaSH, and indicators specific to schools where standards existed, such as safe storage of water and student-to-latrine ratios, largely following WHO guidelines (see Appendix I for survey). The survey contained sections covering the following areas: school demographics; water source and service (quality, quantity, continuity, and reliability); sanitation facilities (type, quantity, and quality); hand-washing, hygiene, and menstrual hygiene (type of materials, continuity); and water quality (microbiological quality). Enumerators surveyed
9
Although data collection was primarily through interviews with school administrators, direct observation was used in answering questions relating to the presence of the three hand-washing materials (water, soap or ash, and drying materials) on the day of the survey.
In addition to the survey, data collection included GPS point collection and water quality sampling. A GPS point was taken at the school and at the primary water source, and then recorded on the survey. Microbiological water quality samples were taken from the stored water at each school. In Mozambique and Uganda, the Compartment Bag Test (Stauber et al, 2014) was used to obtain Escherichia coli (E. coli) colony count per 100mL; the remaining countries used national laboratories for testing E. coli count per 100mL.
To avoid non-response, enumerators were permitted to sample head teachers or head administrators, rather than the same position. Multiple visits were also permitted to survey a school if no one was present on the original day of survey. As a result, all selected schools responded. Indicators for analysis
The following indicators are based on international standards and were collected directly or derived from the survey results: improved water source; safe storage of water; safe container for storage; safe removal of water; round trip time for travel and collection of water; student-to-latrine ratio for girls and boys; improved sanitation facilities; regular handwashing access; access to menstrual hygiene facilities.
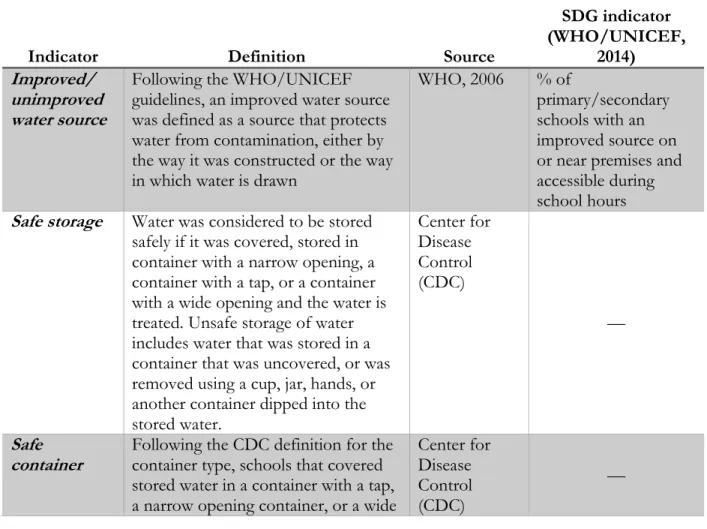
Table 2: Definitions of indicators for analysis
Indicator Definition Source
SDG indicator (WHO/UNICEF,
2014) Improved/
unimproved water source
Following the WHO/UNICEF guidelines, an improved water source was defined as a source that protects water from contamination, either by the way it was constructed or the way in which water is drawn
WHO, 2006 % of
primary/secondary schools with an improved source on or near premises and accessible during school hours Safe storage Water was considered to be stored
safely if it was covered, stored in container with a narrow opening, a container with a tap, or a container with a wide opening and the water is treated. Unsafe storage of water includes water that was stored in a container that was uncovered, or was removed using a cup, jar, hands, or another container dipped into the stored water.
Center for Disease Control (CDC)
—
Safe
container Following the CDC definition for the container type, schools that covered stored water in a container with a tap, a narrow opening container, or a wide
Center for Disease Control (CDC)
10 opening container were considered “safe,” meaning that contamination into the stored water was limited. This variable was created for the regression model.
Safe removal Determined by the methods of water extraction from storage in which contamination of stored drinking water is limited: removal with a tap/spigot on the container, use of a ladle or long spoon, removal with a cup if the school reported having a tapped container, or removal directly from the source and water not stored. This variable was created for the regression model. Center for Disease Control (CDC) —
Round trip Time for travel to and from the source and for collection is less than 30 minutes.
WHO/UNIC
EF, 2014 —
Student-to-latrine ratio The WHO recommends schools to have no more than 25 girl students to 1 latrine for girls and no more than 50 boy students to 1 latrine/urinal. Some countries had their own
recommendations in this range, but for consistency across countries, the WHO standard was used in this analysis for all countries.
WHO, 2009; Garn et al, 2014
% primary and secondary schools with at least 25:1 girl to toilet ratio, at least 50:1 boy student to toilet and urinal ratio, and at least one toilet for male staff and one for female staff Improved/
unimproved sanitation facility
Following WHO/UNICEF guidelines, a sanitation facility was considered “improved” if it separated human waste from human contact.
WHO, 2006 % of primary and secondary schools with separated basic sanitation facilities (separate excreta from contact)
Regular handwashing access
Recommended handwashing facilities include water, soap or ash, and drying materials. Two indicators of access to handwashing were used: presence of water, soap or ash, and a drying material on the day of the survey, and reporting of “always accessible” to each of these three materials.
Jumaa, 2012 % of primary and secondary schools with a handwashing facility with soap and water
Menstrual hygiene equipped
From the literature, the following five resources were determined to be the most necessary and feasible to have in schools: presence of water; separate-sex facilities; presence of a door; a
Water aid, 2012; Mahon and
Fernandes, 2010; Sumpter
11 lock on the door; and a pit or bin for disposal. Proportions for each of these five resources are reported, as well as the proportion of schools with at least 4 of the 5 aspects.
and Torondel, 2013
places for changing; places for disposal
Water quality risk
Risk categorization of E. coli count/100mL: low risk <1;
intermediate risk 1-100; high risk 100-1000; very high risk >1000
WHO,
Guidelines for Drinking-water quality, 4th edition,
2011
—
Regression analysis
Following the work of Fewtrell et al (2005) establishing the relationship between water quality and diarrheal disease reductions, a linear regression analysis was done to determine the WaSH facilities and actions associated with better water quality. The dependent variable in the model was E. coli coliform count per 100mL, which serves as a means of estimating risk for diarrheal disease. Variables that reflected presence of a facility (water source, storage, sanitation, handwashing, and hygiene), access (distance to water source, student-to-latrine ratios), and water treatment were included in a list of explanatory variables to test in the model.
The list of possible explanatory variables included indicators (1 = 𝑦𝑒𝑠, 0 = 𝑛𝑜) for
improved water source, safe container, safe removal, water treatment, round trip collection within 30 minutes, improved sanitation, girl student: latrine ratio at or below 25:1, boy student: latrine ratio at or below 50:1, handwashing materials present on the day, and at least 4 menstrual hygiene facilities present.
Bivariate regression models were run for each explanatory variable with the dependent variable E. coli count per 100mL. From the list of explanatory variables that had significant
regression coefficients, Pearson correlation coefficients were calculated between all the variables to determine any variables with high correlations with one another. The indicator variable for treatment of water was included throughout, despite the significance of its bivariate coefficient, because of the direct relationship treatment of water has on E. coli.
If two variables had a correlation greater than 0.8, one was eliminated from the list of variables. The method used to determine which one to eliminate was first to determine which was related to water directly (improved source, container, removal, treatment). If both were not (there were no instances when two water variables were highly correlated), then the variable that
represented direct potential to contaminate water was chosen (handwashing, improved sanitation). The student:latrine ratio variables and the menstrual hygiene variable were generally eliminated first if there were a correlation with one of them, because they also reflect the operational capability of schools, in addition to factors that lead to better or worse water quality. They are the least frequent variables included in the full model because they often were correlated with other variables. If no two variables had a correlation greater than 0.8, all the selected variables were included in a full model.
12
The final model consisted of the water treatment indicator, variables with significant bivariate coefficients that did not have high correlations with other variables in the model, and significant interaction terms. Regression coefficients, standard errors, t-values, and p-values were reported for the full model.
Significance was set at the 𝛼 = 0.05 level. Data processing and analysis
The Access databases for each country were converted to SAS datasets using Stat/Transfer 12.0. The data were cleaned and analyzed using SAS 9.3 (SAS Institute Inc., Cary, NC). Within each country, the proportion of schools with each indicator was calculated using PROC
SURVEYSELECT, in which the data were weighted according to the different probabilities of selection within each stratum. PROC SURVEYTTEST was used to create a distribution of E. coli counts/100mL.
A linear regression model was also used to assess the factors associated with water quality using PROC SURVEYREG in SAS. Due to the variability in national policies and agendas for WaSH in countries, and with the goal of providing targeted feedback to individual countries, the model was stratified by country to obtain the factors significantly associated with water quality in each country.
Results
School populations
Table 2 shows the sample size of schools in each country, as well as the median number of students in schools in each country, which ranged from 345 (Mozambique) to 758 (Rwanda). The median number of male students was higher than the number of female students in each country except Rwanda and Uganda.
Table 3: Size and demographics of schools surveyed
Country
Schools surveyed
Schools with water
quality samples
Median total students
Median male students
Median female students
Ethiopia 579 14** 649 338 297
Kenya 198 198 381 200 184
Mozambique 198 108 345 177 166
Rwanda 469 185 758 375 390
Uganda 251 244 511 238 263
Zambia 575 172 451 227 218
Total 2270 921 491 247 238
13 3.2 Water facilities
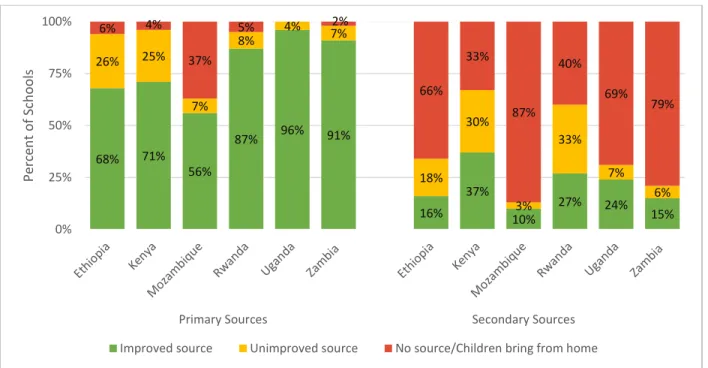
An improved water source was reported in 78% of schools, and in a majority of schools in each country (Figure 2). Rwanda, Uganda, and Zambia reported the highest rates of access to improved water sources (87% to 91%), while Mozambique reported the lowest level of access to an improved source (56%) and only 10% for secondary sources.
Figure 2: Primary and secondary water sources
Kenya and Rwanda were the only two countries in which a majority of schools reported having a secondary water source, at 67% and 60% respectively (Figure 2). As few as 13% of schools in a country (Mozambique) reported access to a secondary source. Of schools that reported having access to a secondary water source, the percent of schools with improved secondary sources ranged from 45% (Rwanda) to 77% (Uganda).
A borehole was the most common improved water source in three of the six countries: Uganda (74%), Zambia (80%), and Mozambique (49%) (Figure 3). Piped water into the yard was the most common source in Rwanda (46%). Water source types in the remaining two countries,
Ethiopia and Kenya, were distributed across multiple sources. The most common unimproved primary sources reported were surface water (18% in Kenya, 11% in Ethiopia) and unprotected springs (12% in Ethiopia). Mozambique reported the highest percentage of schools with no water source at 37%.
68% 71%
56%
87% 96% 91%
16% 37%
10%
27% 24%
15%
26% 25%
7% 8%
4% 7%
18% 30%
3% 33%
7% 6%
6% 4%
37%
5% 2%
66% 33%
87% 40%
69% 79%
0% 25% 50% 75% 100%
Primary Sources Secondary Sources
Perc
en
t
o
f Sch
o
o
ls
14 Figure 3: Primary water sources types
Using the latest classification of health risk for E. coli coliforms per 100mL established by the WHO (WHO, 2011), all five countries included in the water quality analysis had a majority of
schools with E. coli counts in the lowest risk category of <1 coliform/100mL (Figure 4). This
percentage in the low risk category was as high as 90% of schools in Zambia. Nearly 20% of schools in Kenya had very high risk water quality, however, followed by Rwanda (3%). Three countries (Mozambique, Uganda, and Zambia) had no school in this highest risk category. Ethiopia was excluded from the water quality analysis because data was reported only for 14 of 579 schools. Figure 4: Water quality risk categorization
18%
46%
17% 49%
74%
80% 29%
24% 18%
37%
0% 25% 50% 75% 100%
Ethiopia Kenya Mozambique Rwanda Uganda Zambia
Perc
en
t
o
f Sch
o
o
ls
Other
No source/children bring from home
Unprotected spring
Surface water
Unprotected dug well
Protected spring
Protected dug well
Public Tap
Rainwater
Borehole
Piped water to yard
Piped water to dwelling
63% 71% 79%
83% 90%
0% 25% 50% 75% 100%
Kenya Mozambique Rwanda Uganda Zambia
P
erce
n
t
o
f
scho
o
ls
15
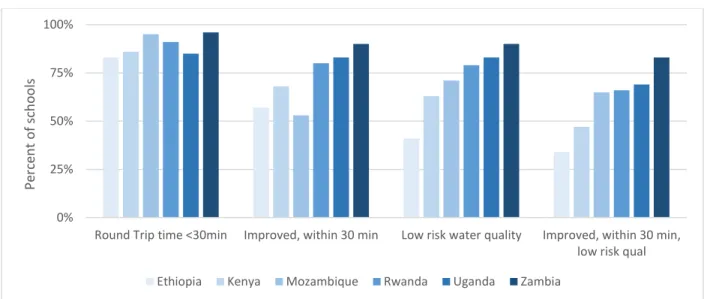
As Figure 5 below shows, in all countries, over 75% of schools had a water source within 30 minutes for total collection time, and over 50% had access to an improved source that was within 30 minutes. In three of the six countries this percentage was at least 80%. Integrating quality shows that over 50% of schools in every country (except Kenya where the percentage was 47%) had low risk water quality from an improved source less than 30 minutes away for collection.
Figure 5: Proximity and quality of primary water source
The proportion of schools in each country that safely store water ranged from 14% in Mozambique to 65% in Rwanda (Figure 6). The low proportion of schools that safely stored water in Mozambique is largely due to the high percentage of schools (51%) that reported dipping a cup into the container to remove water for drinking. In addition to Mozambique, Zambia and Ethiopia had fewer than 50% of schools safely storing water, at 16% and 34% respectively. This low
proportion results from the relatively high percentage of schools that do not cover stored water, 51% of schools in Zambia and 43% in Ethiopia.
A majority of schools in all countries, ranging from 56% in Ethiopia and Kenya to 89% in Uganda, reported continual water service (24 hours/day) from the primary source (Figure 6). At least 75% of schools in every country except Zambia reported no breakdown of the main water source in the preceding two weeks. In Zambia, 25% of schools reported no breakdown, however only 43 of 575 schools responded to the question.
0% 25% 50% 75% 100%
Round Trip time <30min Improved, within 30 min Low risk water quality Improved, within 30 min, low risk qual
Perc
en
t
o
f sc
h
o
o
ls
16
Figure 6: Continuity and reliability of primary water sources
3.3 Sanitation facilities
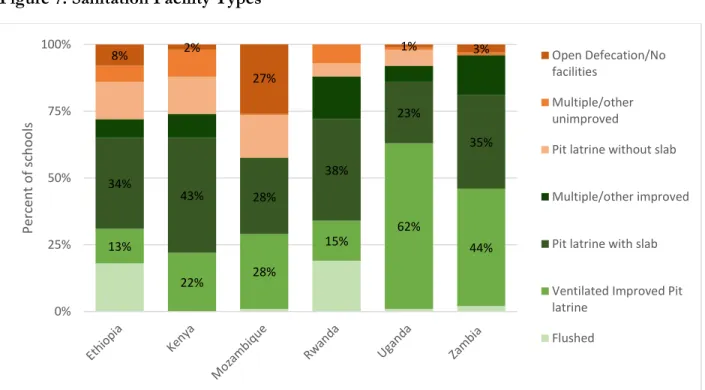
A majority of schools in all six countries reported access to an improved sanitation facility, ranging from 57% in Mozambique to 96% in Zambia (Figure 7). The most common improved sanitation facility types reported were ventilated improved pit latrines and pit latrines with slabs. The most common unimproved sanitation facilities were pit latrines without slabs and open defecation or no facilities. Open defecation or a lack of facilities was reported most frequently in Mozambique, at 27%, followed by 8% in Ethiopia (Figure 7).
Figure 7: Sanitation Facility Types 0%
25% 50% 75% 100%
Safe storage Two week no breakdowns Continual water service
Perc
en
t
o
f sc
h
o
o
ls
Ethiopia Kenya Mozambique Rwanda Uganda Zambia
13%
22% 28%
15% 62% 44%
34%
43% 28%
38%
23%
35%
8% 2%
27%
1% 3%
0% 25% 50% 75% 100%
Perc
en
t
o
f sc
h
o
o
ls
Open Defecation/No facilities
Multiple/other unimproved
Pit latrine without slab
Multiple/other improved
Pit latrine with slab
Ventilated Improved Pit latrine
17
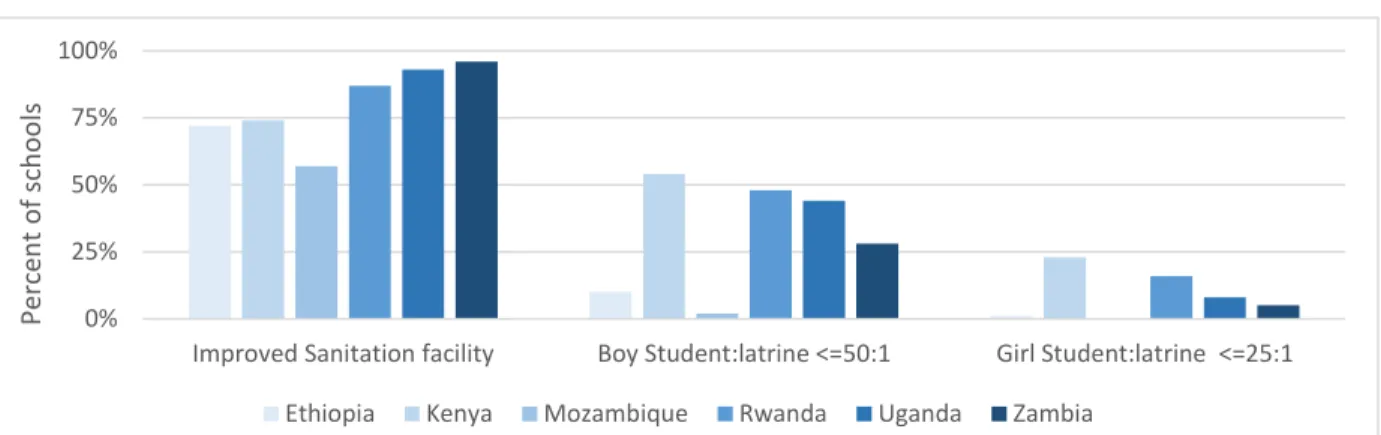
All countries had fewer than 25% of schools that met the WHO recommended 25:1 student-to-latrine ratio for girls (Figure 8). Ethiopia and Mozambique had no school that met the standard for girls. In each country, the percentage of schools meeting the student-to-latrine ratio for boys was more than double the percentage of schools that met the ratio for girls. Nearly half, or more than half of the schools in three countries met the 50:1 ratio for boys (Kenya – 54%, Rwanda – 48%, Uganda – 44%). The number of schools that met the ratio for boys was below 10% in Ethiopia and Mozambique.
Figure 8: Sanitation facility characteristics
Figures 9 and 10 show the skewed right distribution of the student-to-latrine ratio for boys and girls in each country. Four countries, Kenya, Rwanda, Uganda, and Zambia, have 75% of
schools with student-to-latrine ratios at or below 100:1, as observed in third quartiles of the boxplots in Figures 9 and 10. The distributions of the ratios in Ethiopia and Mozambique are spread through larger values, and have third quartiles that extend to 250:1.
0% 25% 50% 75% 100%
Improved Sanitation facility Boy Student:latrine <=50:1 Girl Student:latrine <=25:1
Perc
en
t
o
f sc
h
o
o
ls
18
Figure 9: Boy student-to-latrine ratios by country
Figure 10: Girl student-to-latrine ratios by country
3.4 Handwashing
19
and drying materials) on the day of the survey. In all countries, only 5% or fewer of schools reported always having access to water, soap or ash, and drying materials.
Figure 11: Handwashing facilities and materials
Figure 12 shows the proportion of schools meeting the SDG handwashing target of having water and soap; the figure shows the proportions of school with both materials on the day and the proportion reporting the materials as present always.
Figure 12: Proportion of schools with water and soap/ash
3.5 Menstrual Hygiene
Of the five criteria for menstrual hygiene, most schools in each country reported having separate-sex facilities. Few schools reported having locking doors, and even fewer reported having a
0% 25% 50% 75% 100%
Reporting access to handwashing facilities
Water, soap/ash, & drying materials observed
Water, soap/ash, & drying materials reported always present
P
er
cen
t
of
sc
h
oo
ls
Ethiopia Kenya Mozambique Rwanda Uganda Zambia
0% 25% 50% 75% 100%
%water and soap on day %water and soap always
P
er
cen
t
of
sc
h
oo
ls
20
water supply at the facility. Fewer than 20% of schools in each country had at least 4 of the 5 facilities: separate-sex bathrooms, a clean water supply, a door, a lock on the door, and a bin for waste. Fewer than 20% of schools in each country had at least 4 of the criteria. Access to a water supply by the facility and a locking door were the facilities most lacking in schools.
Figure 13: Menstrual hygiene facilities
Figure 14: Percent of schools with number of recommended menstrual hygiene criteria 0%
20% 40% 60% 80% 100%
4-5 facs Separate-sex facilities
Water supply Door Locking door Waste disposal bin
Perc
en
t
o
f Sch
o
o
ls
Ethiopia Kenya Mozambique Rwanda Uganda Zambia
0% 25% 50% 75% 100%
Ethiopia Kenya Mozambique Rwanda Uganda Zambia
Perc
en
t
o
f sc
h
o
o
ls
Number of menstrual hygiene facilities out of 5 recommended criteria
21 Regression Model
The data from each country were first combined in a total dataset and a full model with reference cells for each country showed that the dummy variables were significant (p<0.05). This suggested that the relationships in the model vary by country, so the models were stratified by country. Ethiopia and Zambia are excluded from this analysis due to small sample sizes.
Table 4 shows the sample sizes for the model for each of the countries. Table 4: Sample sizes in water quality model
Country surveyed Schools Sample size in model
Ethiopia 579 ---
Kenya 198 185
Mozambique 198 108
Rwanda 469 185
Uganda 251 244
Zambia 575 ---
Total 2270
I.
Kenya
Table 5: Bivariate coefficients of water quality model in Kenya
Parameter Estimate Standard Error t Value Pr > |t|
Main Source Improved -463.81 134.72 -3.44 0.0007
Water treatment 100.16 114.42 0.88 0.3825
Safe Container 58.52 112.52 0.52 0.6037
Safe Removal -56.72 96.58 -0.59 0.5577
Round trip < 30 min -24.57 135.47 -0.18 0.8563
Improved sanitation 75.60 103.61 0.73 0.4665
Girl student-to-latrine ratio -43.77 111.61 -0.39 0.6954
22
Handwashing on day -273.50 49.08 -5.57 <.0001
4-5 Menstrual hygiene facilities -272.97 180.23 -1.51 0.1316
As Table 5 above shows, only an improved main water source and having handwashing materials on the day were significant in individual bivariate models with E. coli count in Kenya. These variables were included in the full model, along with the variable for treatment of water because of relationship between treatment of water and presence of E. coli (Table 6).
Table 6: Water quality regression model in Kenya
Parameter Estimate Standard Error t Value Pr > |t|
Intercept 366.325 116.135 3.15 0.0019
Main Source Improved -184.29 129.81 -1.42 0.1573
Water treatment 921.30 309.37 2.98 0.0033
Handwashing On Day -366.32 116.14 -3.15 0.0019
Main Source Improved*
Water treatment -1048.8 317.79 -3.3 0.0012
Main Source Improved*
Handwashing On Day 311.81 124.53 2.5 0.0131
All variables have negative coefficients, representing a reduction of E. coli count when they are present, except for water treatment and the interaction between improved source and
handwashing. The positive regression coefficients of water treatment suggests that treating the water increases E. coli count by 921. Because water treatment, especially chlorine (which was used in 55 of the 61 schools that treated water), kills or lowers E. coli counts, the positive coefficient is not likely due to the treatment itself. Of the 198 schools surveyed in Kenya, 136 reported not treating water, 94 of which used improved sources, and 43 schools accessed rainwater as their primary water source.
23
Table 7. Average E. coli count of treated water by water source type in Kenya
Water source type Number of schools Average E. coli count
Improved
Piped water into dwelling 1 0
Piped water into yard 3 0
Public tap 2 0
Borehole 11 0.09
Protected dug well 7 7.38
Protected spring 1 1986
Rainwater 15 6.04
Unimproved
Unprotected dug well 2 2400
Unprotected spring 1 0
Water selling cart or truck 1 2400
Surface water 11 1117
The positive coefficient of the interaction term of improved source and handwashing (Table 6) suggests that handwashing is effective in reducing E. coli when the water source is not improved, as each bivariate coefficient was significantly negative (Table 5).
II.
Rwanda
Table 8: Bivariate regression coefficients in Rwanda
Parameter Estimate Standard Error t Value Pr > |t|
Main Source Improved 5.49 6.21 0.88 0.3778
Water Treatment 2.53 8.33 0.30 0.7621
Safe Container -10.70 12.25 -0.87 0.3833
Safe Removal -8.02 10.72 -0.75 0.4555
Round trip < 30 min -53.54 42.10 -1.27 0.2051
Sanitation improved 12.61 5.95 2.12 0.0353
Girl student-to-latrine
ratio -15.05 6.15 -2.45 0.0153
Boy student-to-latrine
24
Handwashing on day -0.21 10.06 -0.02 0.9832
4-5 Menstrual hygiene
facilities -18.50 17.61 -1.05 0.2949
Table 9: Full model coefficients in Rwanda
Parameter Estimate Standard Error t Value Pr > |t|
Main Source Improved 7.20 5.57 1.29 0.1979
Water Treatment 3.28 8.78 0.37 0.7094
Sanitation improved 10.90 4.91 2.22 0.0276
Girl student-to-latrine
ratio -15.22 7.61 -2.00 0.0469
No interaction terms were significant. The student-to-latrine ratio for boys was highly correlated (𝜌 = 0.92) with improved sanitation, so it was excluded from the model, but is clearly associated with better conditions.
Student-to-latrine ratios are more indicative of the operation capability of schools than because they have a direct impact on water quality. The significance of the girl student-to-latrine ratio here reflects overall that schools that provide adequate access to sanitation have better water quality. Improved sanitation, however, had a positive coefficient suggesting that having improved sanitation facilities worsens water quality. One factor that was not able to be included in this analysis is the condition of the latrines, which reflects potential for contamination even more than the type of facility. Table 6 below shows the average E. coli count by the type of latrines, and the high averages for flushed toilets and pit latrines with slabs (two improved source types) are likely the causes for the positive regression coefficient.
Table 10: Average E. coli count in school stored water by sanitation facility type in Rwanda
Water source type Number of schools Average coli count E. Max count E. coli
Improved
Flushed to piped
system 6 2.47 10
Flushed to septic tank 11 10.32 50
Flushed to pit latrine 70 25.64 660
Ventilated improved
pit latrine 70 5.65 60 Pit latrine with slab 178 25.55 900
25
Multiple or other
improved 45 9.10 120
Unimproved
Flushed to elsewhere 3 15 30
Pit latrine without slab 25 7.89 60
Hanging toilet 13 0 0
Community latrines 12 0 0
Open defecation 2 0 0
Multiple or other
unimproved 5 0 0
III.
Mozambique
Table 11: Bivariate regression coefficients in Mozambique
Parameter Estimate Standard Error t Value Pr > |t|
Main Source Improved -37.73 12.37 -3.05 0.0029
Water treatment 1.783 7.89 0.23 0.8217
Safe container 13.25 5.30 2.50 0.0140
Safe removal 15.37 8.82 1.74 0.0844
Round trip < 30 minutes -34.45 14.90 -2.31 0.0227
Sanitation improved -1.14 5.80 -0.20 0.8446
Girl student-to-latrine
ratio **excluded due to lack of variability (all 0) Boy student-to-latrine
ratio -0.060 9.96 -0.01 0.9952
Handwashing on day -11.39 2.71 -4.20 <.0001
4-5 menstrual hygiene
facilities -3.67 3.01 -1.22 0.2251
Several variables showed significant bivariate coefficients in bivariate models with E. coli: improved water source, water treatment, safe container, round trip time, and handwashing on the day. None of these variables were correlated above 0.8, and were all included in the full model as shown in Table 12 below.
Table 12: Full model coefficients in Mozambique
26
Intercept 62.20 17.80 3.49 0.0007
Main Source Improved -31.37 13.13 -2.39 0.0187
Safe Container 9.34 5.72 1.63 0.1052
Water Treatment -13.39 9.25 -1.45 0.1508
Round Trip < 30
minutes -27.41 14.59 -1.88 0.0631
Handwashing on day 1.82 8.00 0.23 0.8200
In Mozambique, of the four variables that had significant bivariate models with water quality (Table 11), only improved main water source was significant in the full model (Table 12). The coefficient was negative, suggesting that having improved water sources reduces the E. coli count in the water, which is what the expected relationship would be.
IV.
Uganda
Table 13: Bivariate Regression Coefficients for Uganda
Parameter Estimate Standard Error t Value Pr > |t|
Main Source Improved -29.86 11.61 -2.57 0.0107
Water treatment 9.16 3.81 2.41 0.0169
Safe container 3.68 2.17 1.69 0.0918
Safe removal 22.73 4.77 4.77 <.0001
Round trip < 30 min -5.97 4.34 -1.38 0.1699
Sanitation improved -16.24 6.85 -2.37 0.0186
Girl student-to-latrine
ratio -5.03 2.34 -2.15 0.0329
Boy student-to-latrine
ratio 0.65 2.26 0.29 0.7732
Handwashing on day 10.51 11.24 0.94 0.3505
4-5 Menstrual hygiene
facilities 3.71 2.79 1.33 0.1855
Several variables showed significant bivariate coefficients: improved water source, water treatment, safe removal of stored water, improved sanitation, and girl student-to-latrine ratio. Checking correlation coefficients shows that water treatment and girl student-to-latrine ratio have a high correlation (𝜌 = 0.82). Water treatment is selected over girl student-to-latrine ratio for
27
Table 14: Full model regression coefficients in Uganda
Parameter Estimate Standard Error t Value Pr > |t|
Intercept 27.42 9.43 2.91 0.0039
Main Source Improved -16.31 8.79 -1.85 0.0649
Safe Removal 17.87 4.15 4.31 <.0001
Water Treatment 6.29 3.27 1.92 0.0554
Improved sanitation -8.07 5.66 -1.43 0.1553
While four variables had significant bivariate models and were not correlated with one another, only safe removal of water remained significant in the full model (𝑝 < 0.0001), and had a unexpected positive coefficient. An evaluation of E. coli count by removal type shows that tapped containers have higher mean counts than other methods of removal, and covered, tapped containers have higher counts than uncovered containers (Table 15). As this is opposite as would be expected, this likely suggests that poor behaviors are being practiced that could lead to contamination of the stored water supply.
Table 15: E. coli count by removal type
Removal Type n Average E. coli count Uncovered n Average E. coli count Covered
Tapped/poured 9 12.01 28 33.44
Cup 19 5.77 122 4.52
Dipper or ladle 0 — 2 0
Jar 1 0 5 25.19
Hands 0 — 1 0
Discussion
This study found that over 50% of schools in the surveyed regions of the six countries had access to an improved water source that required less than 30 minutes for travel and collection. Five of the six countries in the analysis (excludes Ethiopia) sampled water quality in at least half of the schools, and over 60% of schools sampled had water quality in the lowest risk category for health. Adequate access to sanitation and hygiene were substantially lower, in comparison to water. Water sources and facilities
28
an estimate of 53% for the Eastern and Southern Africa region (ESAR) in 2013 (UNICEF, 2013). This discrepancy is partially due to continued improvement over a few years’ time, as well likely attributable to UNICEF’s use of non-standardized data across countries to calculate the proportion.
While Mozambique reported the lowest percentage of schools with an improved source in this study (56%), a previous study by Admiraal and Doepel found 96.7% of schools in periurban towns in the Nampula province in Mozambique with access to improved water. This difference in the proportion of schools with access is likely explained by the difference in setting: Admiraal and Doepel’s study was conducted in periurban towns, while the schools in this study were primarily in rural settings, and rural settings have been shown to have lower access to WaSH services (JMP, 2013). Both studies found similar low rates of safe storage of water (14% in this study and 24% in Admiraal and Doepel), suggesting that practices in Mozambique put students at risk of water-related illnesses despite the source type.
Mozambique also had the highest rate (37%) of schools with no water source of the six countries studied. Given the associations between lack of access to water and poor health outcomes (Pruss-Ustun, 2014; Jasper et al, 2012), access to a water source should be improved in
Mozambique.
Although the overall percent of schools with high risk water quality was low (0% in four countries), Kenya showed a relatively high percentage of schools (16%) in this category. In Kenya, the treatment of water was positively associated with higher E. coli counts, This was not expected, especially given that chlorine was the primary water treatment method. An evaluation of water quality by water source type showed that treated water from many unimproved sources had high E. coli counts, which suggests that the water was highly contaminated to begin with and not adequately treated or stored. The significant negative interaction term between improved sources and treatment suggests that treated water from improved sources has reduced counts of E. coli. The high risk water quality in Kenya is likely due to poor source water quality and is not adequately treated or stored to reduce contamination prior to consumption.
Although an improved water source is more likely to protect the source from outside contamination at the time of collection, much evidence exists for contamination of the water in transport and storage before consumption (Wright et al, 2004). Indicators of proper storage techniques (Figure 3) reflect that in barely 50% of schools water was stored in a safe manner.
Sanitation
The results from this study suggest that improved sanitation facility types do exist in a majority of schools, but access for students is limited due to the high student-to-latrine ratio found in each country. With few schools meeting the international standard of 25:1 for girls and 50:1 for boys, access to sanitation is limited, which puts schoolchildren at risk for diarrheal and other water-related diseases (Jasper et al, 2012).
Admiraal and Doepel’s study in Mozambique found that 80.3% of schools in their study region had access to a functioning latrine, while 72.1% had access to an improved sanitation facility. Again, this difference compared with the 57% with improved sanitation of this study is likely explained by the difference in rural and periurban settings, given that rural schools, generally, have fewer resources and are more difficult to access, compared with urban.
29
This percentage is much larger than the result in this study (Figure 2), but comes from a smaller sample and smaller geographic region than this study.
The schools with very large ratios (ones identified as outliers as circles) largely represent the schools that have no facilities, or schools where there are a large number of students but hardly any sanitation facilities. As Figures 9 and 10 show, many schools are identified as having outlying values for the ratio, which suggests that many schools have a severe insufficiency of facilities.
The ratio of students to latrines is included in the indicators for universal sanitation access for the SDGs, and the low number of schools meeting this target now shows the significant areas for improvement in school sanitation programs. This analysis has not included the condition of the latrines, which qualitative results from the survey suggest is also substandard.
Hygiene
Access to adequate handwashing facilities is severely lacking in the schools studied in list countries. Handwashing provides protection against diarrheal disease, up to 47% (Curtis et al, 2003), yet 10% or fewer of schools in each country studied had handwashing materials on the day of the survey. Even fewer reported having the materials at all times. Provision of handwashing
materials and facilities is a top area for improvement of WaSH in schools in the areas of study in these six countries, given the clear relationship between handwashing, diarrheal disease, and school absence (Curtis et al, 2003; UNICEF, 2013).
Access to menstrual hygiene facilities was also extremely low, with fewer than 50% of schools with many of the five criteria. Given the evidence for student absences due to poor quality of facilities (Dreibelbis et al, 2013), and the suggestion that female students are particularly likely to be absent in schools with poor facilities, infrastructure and attention toward menstrual hygiene management is an important area for policy improvement.
Indicators for handwashing access and menstrual hygiene facilities are included in the SDG target for WaSH access in schools (WHO/UNICEF, 2014). Although the target for handwashing only addresses access to water and soap, drying is an important component in hygienic handwashing (Jumaa, 2012), and should also be emphasized in constructing facilities for handwashing. As
summarized in Table 1, the attributes of a menstrual hygiene facility described in the SDGs are captured in this study’s definition of facilities, and given the low proportion of schools with facilities, this is another large gap that needs attention for meeting the SDGs by 2030.
Limitations
While many of the questions on the survey are based on international guidelines for WaSH, some of the indicators are subject to recall and interviewer bias. Priority in analysis was directed toward questions that were more objective or observable, such as water source type or existence of water and soap for handwashing on the day of the survey. Questions that were subject to more recall bias, such as round trip time for collection, were also analyzed but understood to have limitations with accuracy.
Follow-up research should incorporate more observation data collection, to capture the condition of the facilities and access most accurately. Further, the study also did not incorporate monitoring of data collection at all times, which could reduce methodological errors in the future.
30
in light of the proposed SDG target of universal access to be launched later this year. These results also reflect the emphasis and work that has been done for the WaSH targets for the Millennium Development Goals (MDGs), in the emphasis on access to an improved water source. These results, however, support the findings of other research showing that the source type is not the only factor influencing water quality, and suggest that emphasis should be more evenly distributed on other factors, including water storage and mechanisms for water removal from the container in schools. Regression model
The final models for each country each contained different sets of explanatory variables and interaction terms, in addition to the direction the association with water quality was. This absence of a pattern across the country models provides evidence that WaSH infrastructure and its relationship with water quality is context dependent and varies in different countries. This could partially be attributable to the political climate, as well as the ability for governments to establish and enforce standards for quality. Further, the smaller sample of schools that took water quality samples out of the total surveyed schools is a limiting factor to the model.
In Kenya, treatment of water was associated with increased E. coli in water, but the high E. coli counts from unimproved sources suggests that treatment may not actually be consistent or adequate, and subject to human error. This evidence serves as a reminder that providing resources requires proper training in order to obtain positive health outcomes.
The results from Rwanda suggest that an improved latrine may not be sufficient for
preventing the spread of bacteria, and that the condition of latrines may negate positive benefits of improved sanitation. Further analysis with complete data on latrine condition is needed to clarify these relationships.
The model of relationships in Mozambique matched the expected associations between the explanatory variables and water quality. Only the improved water source and the round trip time variables remained significant in the full model, but both had negative regression coefficients, suggesting that having an improved water source and having a source within 30 minutes is more likely to produce better water quality.
Finally, the model in Uganda showed only safe removal of water was significant in the full model, but with a positive coefficient. Evaluating the average E. coli count by removal method showed that the highest average count was in water reported to be from covered containers from which water was poured or dispensed through a tap. The increased E. coli in this group suggests that unsafe behaviors that lead to contamination are still being practiced. Oversight and enforcement of best practices is needed to prevent safely stored water from becoming contaminated.
This analysis used a simple linear regression, but follow-up analyses should test other models for these data, given that the dependent variable for water quality represents counts, rather than being a continuous measurement. These include testing a negative binomial model or a zero-inflated model, given that the water quality data has many values of zero.
This evaluation focused on factors relating to access and existence of WaSH facilities that were associated with better water quality. Another relationship to be tested in the future is that of intermittency of water supply with water quality, as there is some suggestion intermittent supplies lead to more storing of water, which leads to more opportunity of contamination before drinking.
31
This study comprising 2270 rural schools in Ethiopia, Kenya, Mozambique, Rwanda, Uganda, and Zambia found that an average of 78% of schools in the selected areas of the six countries had access to improved water sources, but fewer than 25% of schools had access to sufficient sanitation facilities for all students, fewer than 20% to sufficient menstrual hygiene, and fewer than 10% to recommended handwashing facilities. It is crucial to recognize these substantial gaps in access to adequate hygiene facilities and materials, which have direct impacts on health outcomes, especially for children. These results suggest that children in schools in the surveyed region have high health risks from very preventable problems. With the new development goals to be launched this year, it is clear that much work still needs to be done to reach the proposed goal of universal access by 2030.
As water quality as a direct impact on human health, the regression analysis supports
previous findings that factors in addition to source type, including water storage and mechanisms for removal, influence water quality, and thus should be equally emphasized in school WaSH
programming.
This research contributes to the knowledge on the levels of WaSH access in schools in Ethiopia, Kenya, Mozambique, Rwanda, Uganda, and Zambia. Understanding the level of access to adequate WaSH infrastructure in schools helps target interventions to narrow gaps in access, with the ultimate goal of reducing the preventable disease and death burden by minimizing routes of contamination. This research is important for public health and government officials, policy-makers and practitioners. The results are especially informative baselines for the new WaSH targets
32
REFERENCES
Alexander, K. T., Oduor, C., Nyothach, E., Laserson, K. F., Amek, N., Eleveld, A., … Phillips -Howard, P. A. (2014). Water, sanitation and hygiene conditions in kenyan rural schools: Are schools meeting the needs of menstruating girls? Water (Switzerland), 6, 1453–1466.
http://doi.org/10.3390/w6051453
Bar-David, Y., Urkin, J., Landau, D., Bar-David, Z., & Pilpel, D. (2009). Voluntary dehydration among elementary school children residing in a hot arid environment. Journal of Human Nutrition and Dietetics, 22(5), 455–460. http://doi.org/10.1111/j.1365-277X.2009.00960.x
Cairncross, S., Hunt, C., Boisson, S., Bostoen, K., Curtis, V., Fung, I. C. H., & Schmidt, W. P. (2010). Water, sanitation and hygiene for the prevention of diarrhoea. International Journal of Epidemiology, 39(SUPPL. 1). http://doi.org/10.1093/ije/dyq035
Cronk, R., Slaymaker, T., & Bartram, J. (2015). Monitoring drinking water, sanitation, and hygiene in non-household settings: Priorities for policy and practice. International Journal of Hygiene and Environmental Health. http://doi.org/10.1016/j.ijheh.2015.03.003
Curtis, V., & Cairncross, S. (2003). Effect of washing hands with soap on diarrhoea risk in the community: A systematic review. Lancet Infectious Diseases. http://doi.org/10.1016/S1473-3099(03)00606-6
Dreibelbis, R., Greene, L. E., Freeman, M. C., Saboori, S., Chase, R. P., & Rheingans, R. (2013; 2012). Water, sanitation, and primary school attendance: A multi-level assessment of determinants of household-reported absence in kenya. International Journal of Educational Development, 33(5), 457-465. doi:10.1016/j.ijedudev.2012.07.002
Fewtrell, L., Kaufmann, R. B., Kay, D., Enanoria, W., Haller, L., & Colford, J. M. (2005). Water, sanitation, and hygiene interventions to reduce diarrhoea in less developed countries: a systematic review and meta-analysis. The Lancet Infectious Diseases, 5(1), 42–52.
http://doi.org/10.1016/S1473-3099(04)01253-8
Freeman, M. C., Greene, L. E., Dreibelbis, R., Saboori, S., Muga, R., Brumback, B., & Rheingans, R. (2012). Assessing the impact of a school-based water treatment, hygiene and sanitation
programme on pupil absence in Nyanza Province, Kenya: A cluster-randomized trial. Tropical Medicine and International Health, 17, 380–391. http://doi.org/10.1111/j.1365-3156.2011.02927.x Garn, J. V, Greene, L. E., Dreibelbis, R., Saboori, S., Rheingans, R. D., & Freeman, M. C. (2013). A
cluster-randomized trial assessing the impact of school water, sanitation, and hygiene
33
Gentry-Shields, J., & Bartram, J. (2014). Human health and the water environment: Using the DPSEEA framework to identify the driving forces of disease. Science of the Total Environment, 468-469, 306–314. http://doi.org/10.1016/j.scitotenv.2013.08.052
Jasper, C., Le, T.-T., & Bartram, J. (2012). Water and Sanitation in Schools: A Systematic Review of the Health and Educational Outcomes. International Journal of Environmental Research and Public Health, 9, 2772–2787. http://doi.org/10.3390/ijerph9082772
Jumaa, P. a. (2005). Hand hygiene: Simple and complex. International Journal of Infectious Diseases, 9, 3– 14. http://doi.org/10.1016/j.ijid.2004.05.005
Mahon, T., & Fernandes, M. (2010). Menstrual hygiene in South Asia: a neglected issue for WASH (water, sanitation and hygiene) programmes. Gender & Development.
http://doi.org/10.1080/13552071003600083
Prüss, A., Kay, D., Fewtrell, L., & Bartram, J. (2002). Estimating the burden of disease from water, sanitation, and hygiene at a global level. Environmental Health Perspectives, 110(5), 537–542. http://doi.org/10.1289/ehp.02110537
Prüss-Ustün, A., Bartram, J., Clasen, T., Colford, J. M., Cumming, O., Curtis, V., … Cairncross, S. (2014). Burden of disease from inadequate water, sanitation and hygiene in low- and middle-income settings: A retrospective analysis of data from 145 countries. Tropical Medicine and International Health, 19(8), 894–905. http://doi.org/10.1111/tmi.12329
Saboori, S., Mwaki, A., Porter, S. E., Okech, B., Freeman, M. C., & Rheingans, R. D. (2011). Sustaining school hand washing and water treatment programmes: Lessons learned and to be learned. Waterlines, 30, 298–310. http://doi.org/10.3362/1756-3488.2011.040
Stauber, C., Miller, C., Cantrell, B., & Kroell, K. (2014). Evaluation of the compartment bag test for the detection of Escherichia coli in water. Journal of Microbiological Methods, 99(1), 66–70.
http://doi.org/10.1016/j.mimet.2014.02.008
Sumpter, C., & Torondel, B. (2013). A systematic review of the health and social effects of menstrual hygiene management. PLoS One, 8, e62004.
http://doi.org/10.1371/journal.pone.0062004
UNICEF. (2010). Raising Clean Hands: Advancing learning, health and participation through WASH in schools - Joint Call to Action 2010. Change. Retrieved from
http://www.unicef.org/media/files/raisingcleanhands_2010.pdf
Water, Sanitation and Hygiene Standards for Schools in Low-Cost Settings; World Health Organization: Geneva, Switzerland, 2009.
WHO. (2010). Global status report on noncommunicable diseases. World Health.
34
http://www.who.int/water_sanitation_health/monitoring/oms_brochure_core_questionsfinal 24608.pdf.
WHO & UNICEF. (2012). Progress on drinking water and sanitation, 2012 update. Update. Retrieved from http://www.wssinfo.org/fileadmin/user_upload/resources/JMP-report-2012-en.pdf
WHO & UNICEF. (2014). Progress on sanitation and drinking-water - 2014 update. … Monitoring Programme for water supply and sanitation …. http://doi.org/978 92 4 150724 0
WHO & UNICEF. WASH Post-2015: Proposed Targets and Indicators for Drinking-water, Sanitation and Hygiene (2014) Retrieved from
http://www.wssinfo.org/fileadmin/user_upload/resources/post-2015-WASH-targets-factsheet-12pp.pdf (02.15.15)
World Health Organisation, & United Nation’s Children Fund. (2013). WHO / UNICEF Joint Monitoring Programme (JMP) for Water Supply and Sanitation. Retrieved from
http://www.wssinfo.org/data-estimates/table/
World Health Organisation. (2011). Guidelines for Drinking-water Quality. Fourth Edition. 104–8.
http://doi.org/10.1016/S1462-0758(00)00006-6.
35
APPENDIX I: SCHOOL SURVEY
WV-UNC School Evaluation Form
To be administered to head of the school if available. If he/she is not available, a head teacher can be interviewed. If he/she is not available, a teacher who has worked at the school where the interview is about to take place can answer the questions in the survey.
0.01 COVERSHEET
Q 0.001
WV Area or Comparison Area (Circle One)
a. World Vision ADP Enumeration Area
b. Comparison Area
Q 0.002 Unique School
Number
Q 0.003
Visits to School a.1st Visit
_____ / _____ / _____
dd mm yy
b.2nd Visit
_____ / _____ / _____ dd mm yy
c. 3rd Visit
_____ / _____ / _____
dd mm yy
d. 4th Visit
_____ / _____ / _____
36
Q 0.004
Completed Date
_____ / _____ / _____
dd mm yy
Q 0.005
Refusal Date
_____ / _____ / _____
dd mm yy
Q.0.006 Final Result Code
Q 0.007 Name of Enumerator
Q 0.008 Signature of
Enumerator
Supervisor Review
Below is to be filled out by Supervisor
Q 0.009 Name of Supervisor
Q 0.010 Signature of
37
0. 0.02 Visit Record to School
Visit #1 Visit #2
A.1 Day
(day/month/year) ___ ___ / ___ ___ / ___ ___ ___ ___
A.2
___ ___ / ___ ___ / ___ ___ ___ ___
B.1 Day of the week B.2.
C.1Exact time began C.2.
D.1 Interviewer I.D. D.2.
E.1 Contact with Respondent No One E.2. Respondent No One
F. 1 Tel. number if obtained
F.2.
G. 1 Detailed
description of contact or attempt to contact and best time to return
G.2.
H. 1 Temporary Result code
H.2.
Visit #3 Visit #4
I.1 Day
(day/month/year) ___ ___ / ___ ___ / ___ ___ ___ ___
I.2.
___ ___ / ___ ___ / ___ ___ ___ ___
J.1Day of the week
J.2.
K.1 Exact time began K.2.
L.1 Interview I.D. L.2
M.1. Contact with Respondent No One
M.2.
38
N.1 Tel. number if obtained
N.2.
O.1. Detailed
description of contact or attempt to contact and best time to return
O.2.
P.1. Temporary O.1.Result code
P.2.
Result Codes
Temporary Result Codes
100 School not in session
102 Completed part of questionnaire, could not finish 103 No eligible respondent available.
Eligibility: Head of school. If not available, a teacher who has been teaching at this school for more than 1 year.
104 Unoccupied/Vacant/Demolished School – check with supervisor about address 105 Selected address is not a school – check with supervisor about address
106 Other
Final Result codes
201 Completed questionnaire
202 Completed part of questionnaire, could not finish after four returns to ` school 203 Nobody available, for each of four returns
205 Refusal
206 Unoccupied/Vacant/Demolished School
39
WV-UNC School Evaluation Form
FIELD OFFICE
Interviewer’s code & name
……… ………
Completed Date: dd/mm
Team Leader ’s code & name
…… ……….
Checked Date: dd/mm
General Supervisor
………....
Checked Date: dd/mm
Data Entry Supervisor
………..
Entry Date: dd/mm
SECTION 1: IDENTIFICATION
1.01: COUNTRY
1.02: REGION 1=Northern Region; 2=Upper East Region
(This is an example for Ghana. Alter these choices for each country.)
1.03: PROVINCE, STATE, OR ZONE
1.04: DISTRICT
1.05: COMMUNITY
1.06: DATE (DD/MM/YYYY)
1.07: LANGUAGE 1=Dagbanli 2=Mampruli; 3=Kusal; 4=Frafra/Kasim;
5=Likpakpaln/Basare; 6=Talen; 7=Nabt; 8=Other (specify)
(This is an example for Ghana. Alter these choices for each country.)
1.08: GPS Waypoint of School:
Lat: ____ _________ ° __________________’ (decimal degrees)
Long: ____ _________ ° __________________’ (decimal grees)
Altitude _______________________ meters